- CFD trading
- CFD trading
- Markets
- Markets
- Accounts
- Accounts
- Platforms
- Platforms
- Premium trading tools
- Premium trading tools
- Share trading
- Share trading
- Invest in shares
- Invest in shares
- Downloads
- Downloads
- Education
- Education
- Resources
- Resources
- Courses
- Courses
- Help & support
- Help & support
- About
- About
- Client support
- CFD trading
- CFD trading
- Markets
- Markets
- Accounts
- Accounts
- Platforms
- Platforms
- Premium trading tools
- Premium trading tools
- Share trading
- Share trading
- Invest in shares
- Invest in shares
- Downloads
- Downloads
- Education
- Education
- Resources
- Resources
- Courses
- Courses
- Help & support
- Help & support
- About
- About
- Client support
 News & analysis
Johnson & Johnson Q4 results are in
26 January 2022Johnson & Johnson (JNJ) reported its Q4 earnings before the opening bell on Wall Street on Tuesday. Let’s take a closer look at how the pharmaceutical giant performed in the previous quarter.
The company reported total revenue of $24.804 billion in Q4 (up by 10.4% from the same period in 2020), below analyst forecast of $25.276 billion.
Earnings per share at $2.13 a share in the previous quarter (up by 14.5%, pretty much in line with analyst forecast of $2.12 a share.
Joaquin Duato, Chief Executive Officer commented on the Q4 and 2021 results: ”Our 2021 performance reflects continued strength across all segments of our business. Guided by Our Credo, I am honoured to assume the role of CEO, leading our global teams in continuing our work to deliver life-changing solutions to consumers, patients, and health care providers.”
”Given our strong results, financial profile, and innovative pipeline we are well positioned for success in 2022 and beyond,” Duato added.
Johnson & Johnson chart (Monthly)
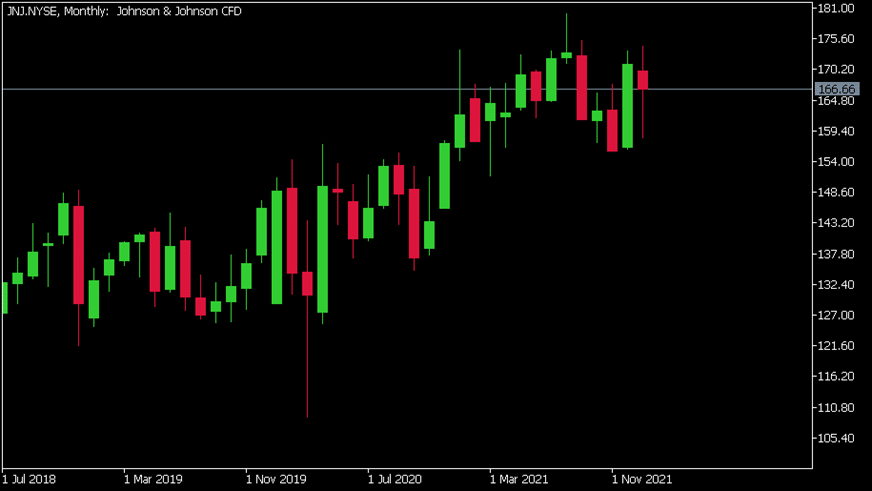
Share price trading higher following the latest results, up by around 2% during the trading day on Tuesday at $166.66 per share.
Johnson & Johnson is the 12th largest company in the world and with a total market cap of $438.19 billion.
You can trade Johnson & Johnson (JNJ) and many other stocks from the NYSE, NASDAQ, HKEX and the ASX with GO Markets as a Share CFD.
Sources: Johnson & Johnson, TradingView, GO Markets MT5, CompaniesMarketCap
Ready to start trading?
The information provided is of general nature only and does not take into account your personal objectives, financial situations or needs. Before acting on any information provided, you should consider whether the information is suitable for you and your personal circumstances and if necessary, seek appropriate professional advice. All opinions, conclusions, forecasts or recommendations are reasonably held at the time of compilation but are subject to change without notice. Past performance is not an indication of future performance. Go Markets Pty Ltd, ABN 85 081 864 039, AFSL 254963 is a CFD issuer, and trading carries significant risks and is not suitable for everyone. You do not own or have any interest in the rights to the underlying assets. You should consider the appropriateness by reviewing our TMD, FSG, PDS and other CFD legal documents to ensure you understand the risks before you invest in CFDs. These documents are available here.
#Indice #Indices #IndicesTrading #IndexTrading #Shares #Stockmarket #StocksNext Article
Tesla earnings have arrived
Tesla Inc. (TSLA) reported its Q4 2021 results after the market close on Wednesday. The world’s largest automaker exceeded analyst expectations on both revenue and earnings per share. The company reported total revenue of $17.719 billion in the fourth quarter vs. $17.132 billion expected. Earnings per share reported at $2.54 vs. $2.36 per s...
January 27, 2022Read More >Previous Article
Verizon tops Wall Street expectations
Verizon Communications Inc. (VZ) released their previous quarter financial results before the market open on Tuesday. The US telecommunication giant t...
January 26, 2022Read More >
- CFD trading
- CFD trading
- CFD trading
- Markets
- Markets
- Accounts
- Accounts
- Platforms
- Platforms
- Premium trading tools
- Premium trading tools
- Share trading
- Share trading
- Invest in shares
- Invest in shares
- Downloads
- Downloads
- Education
- Education
- Resources
- Resources
- Courses
- Courses
- Help & support
- Help & support
- About
- About
- Client support