
Bitcoin/USD – Technical Analysis
2 September 2022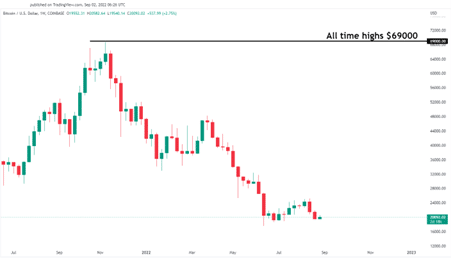
After Bitcoin reached its all time highs around $69,000USD per coin in November of 2021, it’s been downhill ever since. Currently sitting at roughly $20,080USD, it has dropped over 70% of its value in less than a year.
Let’s break this down from a technical viewpoint, keeping it very simple with only a few lines. Not much else is needed.
On a daily time frame, Bitcoin has broken through channel after channel and there’s no signs of slowing down.
Looking at the history of the previous channels, after a breakout below which is marked with a yellow circle, bitcoin has continued to fall.

Let’s zoom in and see potentially where BTC/USD could fall to.
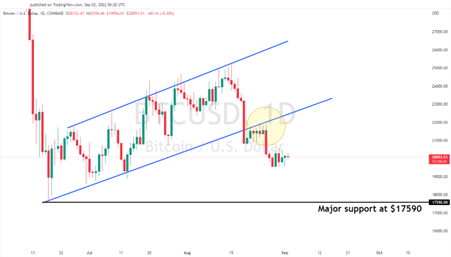
There is a strong support sitting at $17,590USD, which is the previous low of the downtrend which could very much attract the price of bitcoin back down to that level.
Disclaimer: Articles are from GO Markets analysts and contributors and are based on their independent analysis or personal experiences. Views, opinions or trading styles expressed are their own, and should not be taken as either representative of or shared by GO Markets. Advice, if any, is of a ‘general’ nature and not based on your personal objectives, financial situation or needs. Consider how appropriate the advice, if any, is to your objectives, financial situation and needs, before acting on the advice. If the advice relates to acquiring a particular financial product, you should obtain and consider the Product Disclosure Statement (PDS) and Financial Services Guide (FSG) for that product before making any decisions.
Next Article
Brent testing critical level again
Brent Crude oil much like many other commodities has seen its value drop on the back of a strong US dollar and weaker demand forecasts. With the tail wind of the Russia and Ukraine crisis fading, Brent has struggled to maintain its highs of $125 a barrel in the last few months. In addition, the price has dropped to the point where it is r...
Previous Article
Will gold hold its support or will the USD push it below $1660
Will gold hold its support or will the USD push it below $1660 Gold has dumped again after recession fears and a strong US dollar continue to grip ...