- Accounts
- About
- Trading
- Platforms
- Tools
- News & education
- News & education
- News & analysis
- Education hub
- Economic calendar

News & Analysis
Identifying opportunities and managing risk with Autochartist
8 February 2022
Autochartist’s advanced chart pattern recognition can help you with identifying real-time trading opportunities and making more informed trading decisions. Founded in 2004, Autochartist is a financial market analytics company that leverages big data and proprietary technology to provide their services. They provide analytics for currencies, commodities and indices to clients in over 100 countries worldwide and across multiple languages.
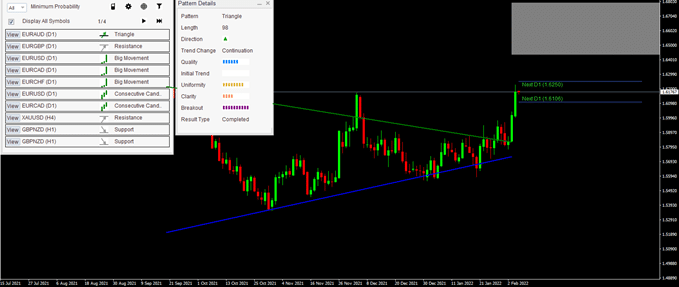
Autochartist will provide you with a Market Scanner directly from your MT4 and MT5 platform. It scans all the available markets for possible trading opportunities and allows traders to observe all symbols and time frames from a single chart.
If you spot an interesting opportunity from the list, you can simply click on the ‘View’ button next to the symbol and your platform will automatically switch the chart over and display the trade opportunity directly to the chart.
In the screenshot below, you can see an example of the first trade opportunity on the Market Scanner. You can view the Pattern Details, which will explain the various properties of the trade opportunity. The grey box would be the forecast region for the symbol and the two blue horizontal lines would be the volatility analysis.
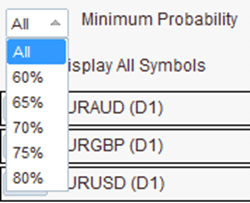
You can also filter the trading opportunities by their probability of success. In general, when selecting a higher probability, you will receive less trading opportunities. This is because the strength of the trading opportunity might not be as great.
The Autochartist trading tool will also include a risk calculator (also known as a position size calculator). The risk calculator can be a very important tool for most traders. It is used to help clients prevent over-exposing their trading account and to safely control their maximum risk per trade.
The risk calculator uses two variables to work out a suggested position size (your third variable). The first two variables are the risk amount and stoploss distance. The risk amount can either be a percentage of trading balance/equity (for example, 1 or 2%) or a fixed amount (for example, $100AUD). The stoploss distance would be in pips. Once you’ve entered these values, you will be suggested a position size for your trade.
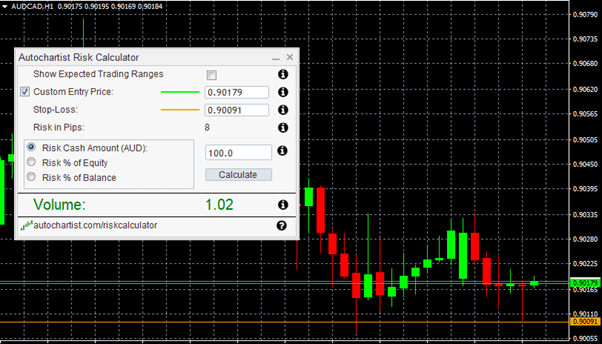
In this example on the AUDCAD, the risk amount is $100 AUD and stoploss is 8 pips, the position for the trade would be 1.02 Lot. The risk calculator is also interactive, you can move the green (open) price line and orange (stoploss) line directly on the chart. You can also enter the prices for a more precise calculation.
Accessing Autochartist.
To access the Autochartist trading tool, you would need to do the following steps:
- Log into your client portal.
- Click on your ‘TOOLS’ tab.
- Select ‘Autochartist’ and follow the download prompts.
- Run the installation file.
Once installed, the Autochartist Market Scanner will be located under the Expert Advisor tab in your MT4/5 Terminal. The Autochartist Risk Calculator will be located under the Indicator tab.
For more information, you can visit our Autochartist information webpage here:
https://www.gomarkets.com/au/autochartist/
Disclaimer: Articles are from GO Markets analysts and contributors and are based on their independent analysis or personal experiences. Views, opinions or trading styles expressed are their own, and should not be taken as either representative of or shared by GO Markets. Advice, if any, is of a ‘general’ nature and not based on your personal objectives, financial situation or needs. Consider how appropriate the advice, if any, is to your objectives, financial situation and needs, before acting on the advice. If the advice relates to acquiring a particular financial product, you should obtain and consider the Product Disclosure Statement (PDS) and Financial Services Guide (FSG) for that product before making any decisions.
Next Article
Amgen reports Q4 results
Amgen Inc. (AMGN) reported its fourth-quarter financial results after the closing bell on Monday. The US biotechnology company reported total revenue of $6.846 billion (a 3% increase from the same period in 2020), just shy of the analyst forecast of $6.868 billion. Earnings per share was reported at $4.36 (up 26% year-over-year), beating anal...
February 8, 2022
Read More >
Previous Article
How to identify key resistance levels
A resistance level is a key tool in technical analysis, indicating when an asset has reached a price level that market participants are unwilling to s...
February 8, 2022
Read More >