- Accounts
- About
- Trading
- Platforms
- Tools
- News & education
- News & education
- News & analysis
- Education hub
- Economic calendar

News & Analysis
Trading Opportunities from Japan’s Shock Interest Rate Decision
25 February 2016After looking at the reasons why the Bank of Japan decided to opt for negative interest rates in the first part of this series, we will now see the factors that can help explain why the yen is not going south.
When there is nothing out there:
As discussed earlier, part of BOJ’s decision to go into negative rates was to push financial institutions, companies and investors to move their money out of the banks and put those funds to work.
However, this is easier said than done. Equity markets across the world are almost in a bear market. Emerging economies (i.e. China, Brazil) are all weak or at least not inviting. The economic outlook for the developed countries (including U.S) has sharply declined in recent weeks. The outlook for the commodities is still not clear (to say the least).
World indices and commodities performance from 21/5/2015 to 17 Feb 2016
Measured from close to close
| Germany | Shanghai | US | Australia | Japan | Commodities | |
|---|---|---|---|---|---|---|
| Return | -21.0% | -36.7% | -9.6% | -12.8% | -21.6% | -26.7% |
| Max. Draw Down | -25.2% | -41.4% | -14.2% | -15.0% | -26.0% | -29.8% |
Therefore, not only do the cash rich Japanese companies have nowhere to go, but in the face of current global uncertainty, they became more conservative and started to roll back their foreign investments and wound up their carry trades.
What is a carry trade?
A carry trade uses currencies with lower rates to buy those currencies with higher interest rates. For example, a hypothetical carry trader in Japan could borrow from a local bank, convert the proceeds to a foreign currency (shorting the yen) and invest the money in a foreign country (long the foreign currency) to collect a higher interest (in practice, it gets a little more complicated than this, but the idea is the same). Since the interest that the carry trader receives from the foreign bank is more than the interest he/she has to pay to the Japanese banks, the carry trade makes money.
The Risk off Scenario
The biggest risk to the carry trades is the currency fluctuations. When risk-off events (such as the existing market turmoil or the commodity rout) forces the currency of the higher interest rate to rapidly depreciate, the Japanese investors would rush back to close those carry trades by selling the foreign currency and buying back the yen.
The unwinding of the carry trades will naturally bid the yen up. To us, this seems to be the biggest driver of JPY’s strength these days.
Yen has had a prolonged history of low interest rates. Therefore, it has been the world’s funding currency for various carry trades for many years. Given this, it is not surprising to see yen strengthening each time there is some sort of a crisis.
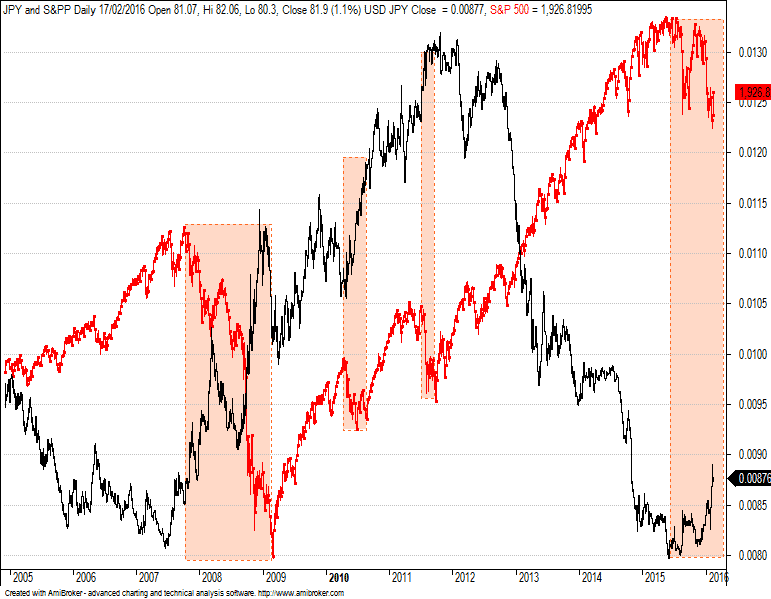
The red line in the chart below is the S&P 500 index and the black line is the Japanese yen versus US dollar. The squares on the chart highlight the four most recent market corrections. As you can see, each time that market posted a significant decline in the past 10 years, yen responded by a notable appreciation against the US dollar.
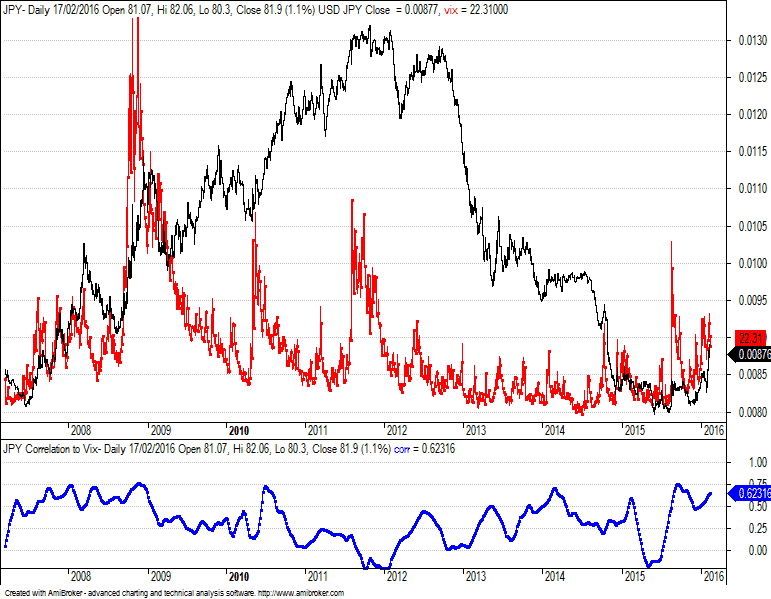
To put this relationship into context, the chart below shows yen (the black line) vs the VIX index (the red line). VIX or the Volatility index is a measure of market nervousness. It has an inverse relationship with the equity markets. Each time traders get worried about stocks, the VIX index increases in value.
The blue line on the lower section of this chart is the 50 day moving average of a 20-day correlation between net changes in yen and VIX. As you can see, there is a generally high correlation between yen and VIX. So whenever VIX rises (as a result of chaos in the stock market) yen rises too.
Impact on Japan Equities:
Currency market is not the only market which has disappointed Kuroda. Japanese equities did not behave well either by showcasing higher volatility than the rest of major indices. The table below compares Japan’s stocks return and maximum drawdown from 29 of Jan (when the negative interest rates were announced) through to 17 of Feb 2016. As you can see Nikkei has depreciated more than any other major indices.
Major indices performance since 29 of Jan
| Japan | US | Australia | Germany | |
|---|---|---|---|---|
| Return | -9.60% | -0.69% | -1.33% | -4.30% |
| Max. Drawdown | -14.65% | -5.73% | -5.45% | -10.67% |
Additionally, since the beginning of February there has been three cases that Nikkei 225‘s daily returns stretched beyond their three or five times standard deviation band. On Monday the 15th of February, Japan’s equities rallied by almost 7.15% (measured from close to close on the cash index) after dropping by more than 5% just in the preceding trading day.
A move like this represents five times the standard deviation of the average daily ranges. History has only seen 12 of these moves since 1965.
The number of times Nikkei 225 daily range has gone Beyond 3 and 5 standard deviation since 1965
| Index | Above 5 Sigma | Below 5 Sigma | Above 3 Sigma | Below 3 Sigma |
|---|---|---|---|---|
| $N225 | 12 | 19 | 107 | 81 |
To make the situation worse, we only need to remind ourselves that Japan’s stock market has an inverse relationship to its currency. This is because most of these companies are export driven and cannot naturally perform when yen is too expensive.
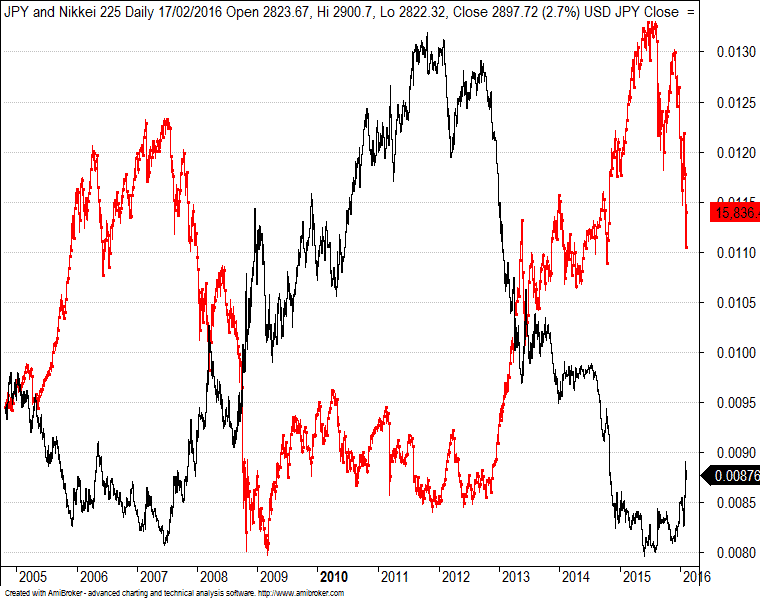
The chart below clearly shows this relationship. The black line is JPY against US dollar and the red line is the Nikkei 225 index. Notice how the pair has gone almost perfectly in the opposite direction since 2005.
So based on the above, as long as Mr. Kuroda is not capable of controlling its own currency and as long as the global market turmoil remains intact, the negative interest rates do not seem to be able to help him.
But if for some reason, yen starts to depreciate again, except for the banking sector, other sectors may get back on their feet.
The reason we are pessimistic on banks is that, as it turns out, Japanese banks (like other European banks) are not intending to pass the negative interest rates on to their customers.
Therefore, further advancement into negative rate territory will eat into banks’ profit margin. The table shows the performance and maximum draw down of Japan’s banking sector (Measured by TOPIX 1615 banks ETF) between 29 of January to 17 of February period.
As you can see, banks have massively underperformed the Nikkei 225.
Banks vs the rest of the market in Japan
| Nikkei 225 | Japanese Banks | |
|---|---|---|
| Return | -9.6% | -20.3% |
| Max Drawdown | -14.65% | -26.3% |
|

Disclaimer: Articles are from GO Markets analysts and contributors and are based on their independent analysis or personal experiences. Views, opinions or trading styles expressed are their own, and should not be taken as either representative of or shared by GO Markets. Advice, if any, is of a ‘general’ nature and not based on your personal objectives, financial situation or needs. Consider how appropriate the advice, if any, is to your objectives, financial situation and needs, before acting on the advice. If the advice relates to acquiring a particular financial product, you should obtain and consider the Product Disclosure Statement (PDS) and Financial Services Guide (FSG) for that product before making any decisions.
Next Article
Crude Oil Opportunities Analysed in 7 Charts
It was only one month ago when oil was the most hated commodity in the market. Analysts were pessimistic and forecasts for oil with a $10 handle were circulating in the financial media. However, against all odds, oil suddenly managed to hold losses and surprisingly recovered by some 53% from a 12-year low in February. Given this sudden and strong c...
March 22, 2016
Read More >
Previous Article
Bank of Japan opts for negative interest rate, but Yen soars
Just days before Japan’s unexpected negative rate announcements, the country’s central bank chief Haruhiko Kuroda was quoted in an interview where...
February 24, 2016
Read More >