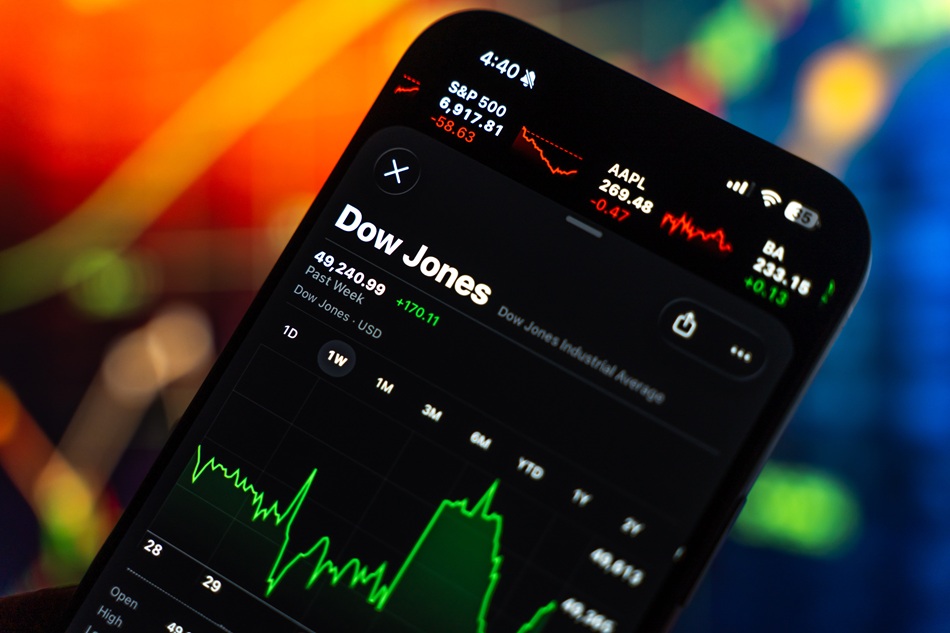
Unpack four popular midterm election assumptions tested against historical data.
A political map can tell traders who won Congress but it can't tell them where the Nasdaq 100, US dollar or gold will go next.
That's the midterm election trap.
With the US elections approaching on 3 November 2026, traders face a market already dealing with elevated bond yields, stubborn inflation and questions about the cost of financing growth. And while the election could change expectations, those expectations don't always translate into price movements.
So, here are 4 markets where the gap between the political narrative and market reality could become clearer.
2026 isn't a typical midterm
Republicans currently control the White House and both chambers of Congress. A Democratic win in either chamber could make major legislation harder to pass, while a Republican hold would preserve the current arrangement.
But neither outcome automatically determines market direction.
The Federal Reserve (Fed) raised interest rates to 3.75% to 4.00% in September, while the 10-year Treasury yield briefly climbed above 5.3% in October. US government debt has also exceeded US$40 trillion.
Those pressures won't disappear when the votes are counted.
Historically, US equities have often rallied after midterms. BlackRock's analysis shows an average S&P 500 gain of 14.1% over the following 6 months since 1970, compared with 5.7% in equivalent non-midterm periods.

Cumulative total return trajectory of the S&P 500 across historical midterm election cycles since 1970, contrasting the post-election performance under divided government against baseline non-midterm years.
Source: BlackRock Investment Institute, Bloomberg Finance L.P.But historical averages are not forecasts. And with interest rates, inflation and AI investment already influencing valuations, 2026 has its own set of risks.
1. US Treasury yields
The assumption:"A political sweep means higher spending and yields. Gridlock means the opposite."
Bond markets care about borrowing, inflation and the cost of financing government debt, not just who controls Congress. With US government debt above US$40 trillion, investors are already assessing how much additional borrowing the Treasury may need and at what cost.
A change in congressional control could alter expectations for taxes, spending and deficits. But campaign proposals still need to become legislation, and the Fed sets monetary policy independently.
If markets expect larger deficits or persistent inflation, Treasury yields could rise, putting pressure on bond prices and borrowing costs across other markets. On the other hand, a weaker growth outlook or stronger demand for safer assets could pull yields lower, regardless of the election result.
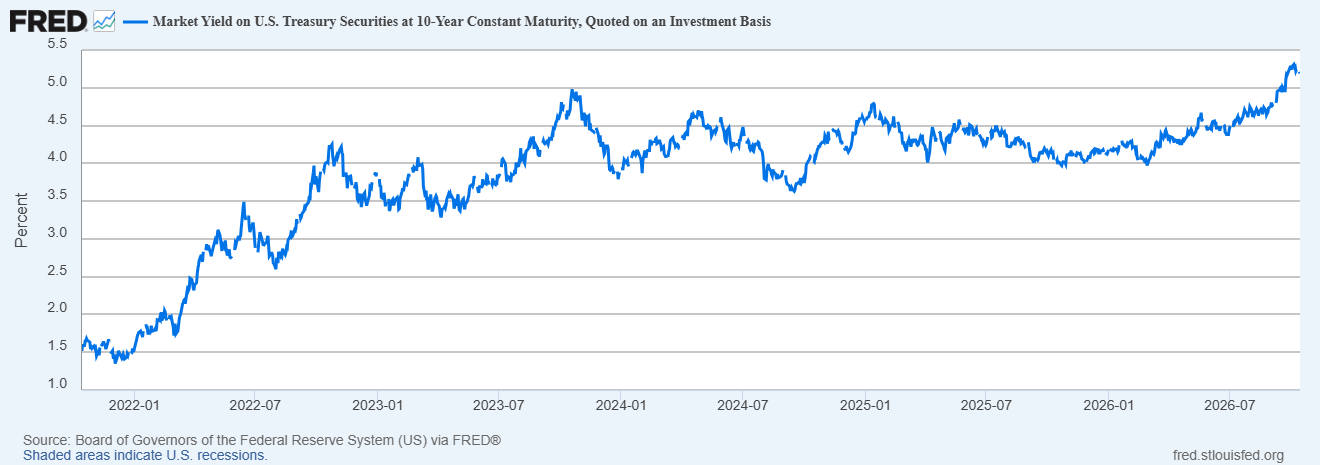
Daily 10-year nominal Treasury yields illustrating benchmark borrowing costs and the expansion of term premiums as U.S. sovereign debt expands past US$40 trillion.
Source: Board of Governors of the Federal Reserve System (US) via FRED®The 10-year Treasury yield, inflation expectations, future debt issuance and the Fed's 27 to 28 October decision.
2. Nasdaq 100
The assumption:"A divided Congress means less regulation, so technology shares rally."
Gridlock can limit major policy changes, but it doesn't remove the financial pressures facing technology companies.
The Nasdaq 100 is particularly sensitive to changes in growth expectations, interest rates and the earnings outlook for its largest companies.
Higher Treasury yields can reduce the present value investors place on future earnings. That's especially relevant when major technology companies are spending heavily on artificial intelligence (AI) infrastructure.
Political uncertainty may fade after the election, but that alone doesn't guarantee a rally. If yields remain elevated or earnings disappoint, technology shares could struggle even if the congressional outcome is viewed as favourable.

Trajectory of the tech-heavy benchmark heading into the election, highlighting how extended baseline valuations leave growth equities sensitive to discount rates above 5.0% and mega-cap AI infrastructure expenditures.
Source: Nasdaq Global Indexes, FactSetTreasury yields, mega-cap earnings, AI capital expenditure (CapEx), regulatory developments and whether the election result differs from market expectations.
3. US dollar
The assumption:"A sweep means more spending, higher yields and a stronger US dollar."
The dollar responds to relative interest rates, economic growth and global capital flows.
Higher US yields can attract demand for dollar-denominated assets, potentially supporting the currency. But rising deficit concerns, weaker growth expectations or changes in overseas monetary policy can pull in the opposite direction.
And a divided Congress doesn't necessarily mean a weaker dollar. If global uncertainty rises, the dollar could attract safe-haven demand regardless of which party controls Congress.
The key is how US economic expectations change relative to the rest of the world.
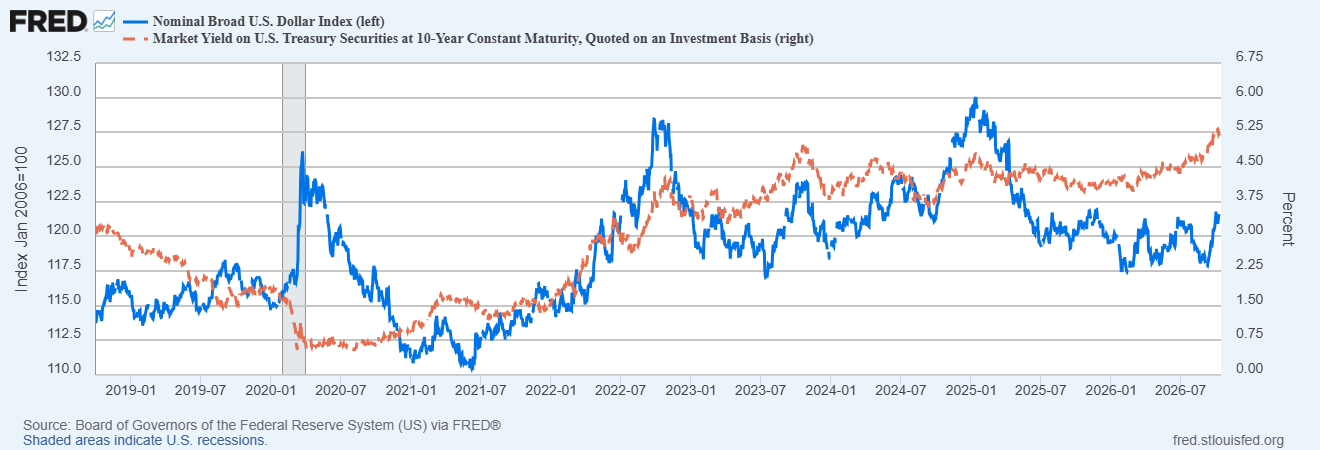
Tracking the Federal Reserve's trade-weighted U.S. dollar against benchmark 10-year yields, demonstrating how interest rate differentials and cross-border capital flows drive currency trends across election cycles.
Source: Board of Governors of the Federal Reserve System (US) via FRED®DXY movements, US Treasury yields, Fed guidance and the dollar's performance against major currencies, particularly the euro and Japanese yen.
4. Gold
The assumption:"Political uncertainty increases safe-haven demand, so gold rises."
Gold faces competing forces that can produce very different outcomes.
While a close or contested election result could increase demand for perceived safe-haven assets, higher real yields, which account for inflation, raise the opportunity cost of holding gold because it pays no interest.
A stronger US dollar can also weigh on gold prices.
That leaves a potentially uncomfortable scenario: political uncertainty rises, yet gold falls because Treasury yields and the dollar are moving higher.
The reverse is also possible. If yields decline and investors seek safety, gold could find support.
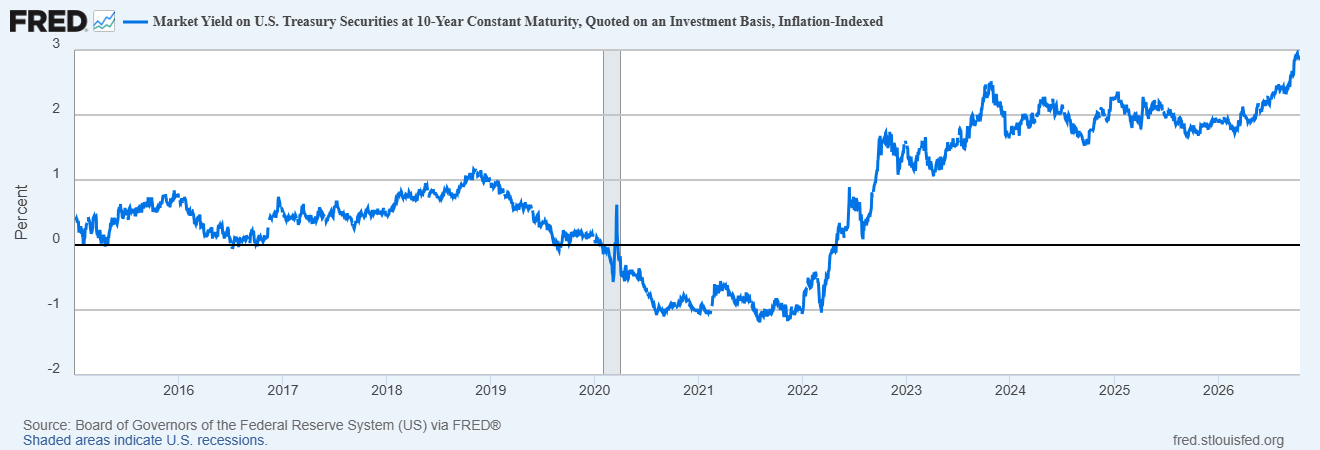
Daily 10-year TIPS real yields reaching multi-year highs of 2.84%, reflecting the elevated risk-free opportunity cost that can constrain safe-haven gold demand despite political uncertainty.
Source: Board of Governors of the Federal Reserve System (US) via FREDReal Treasury yields, the DXY, safe-haven demand and whether election uncertainty persists after the vote.
Election night
The first US polls are scheduled to close at 6 pm Eastern Standard Time on Tuesday 3 November, equivalent to 23:00 UTC. That means early election headlines arrive after the regular US equity session has closed, during the Asian morning and ahead of the next European trading day.
But poll closures aren't final results. Close races can take hours or days to resolve, leaving room for changing expectations, price gaps and wider spreads during periods of reduced liquidity.
Bottom line
The biggest midterm risk isn't necessarily backing the wrong political outcome. It's assuming the election result tells the whole market story.
A divided Congress could limit major policy changes. A Republican hold could preserve the current legislative balance. Neither guarantees a particular market reaction.
For traders, the more useful question is how the result changes expectations for borrowing, interest rates, corporate earnings and global capital flows.
The election tells us who controls Congress. The bond, equity, currency and gold markets may tell us what that actually means for prices.
Follow the data, not just the election map.

The information provided is of general nature only and does not take into account your personal objectives, financial situations or needs. Before acting on any information provided, you should consider whether the information is suitable for you and your personal circumstances and if necessary, seek appropriate professional advice. All opinions, conclusions, forecasts or recommendations are reasonably held at the time of compilation but are subject to change without notice. Past performance is not an indication of future performance. Go Markets Pty Ltd, ABN 85 081 864 039, AFSL 254963 is a CFD issuer, and trading carries significant risks and is not suitable for everyone. You do not own or have any interest in the rights to the underlying assets. You should consider the appropriateness by reviewing our TMD, FSG, PDS and other CFD legal documents to ensure you understand the risks before you invest in CFDs. These documents are available here.
Any references to Australian or international shares, sectors, indices, ETFs, crypto-related stocks or other instruments are provided for market commentary and watchlist purposes only and do not constitute a recommendation, offer or solicitation to buy, sell or hold any financial product or adopt any investment strategy. International markets may involve additional risks, including currency fluctuations, regulatory differences, market structure differences, reduced liquidity and higher volatility. Company-specific, sector-specific and macroeconomic risks may also affect performance.
Commentary on geopolitical developments, economic data, central bank decisions, earnings, policy changes and other global or financial market events is based on information available at the time of publication and may change without notice. Such events can lead to sudden market moves, price gaps, reduced liquidity, wider spreads and increased volatility, particularly in leveraged products such as CFDs. Forward-looking statements, expectations and scenario analysis are inherently uncertain and should not be relied on as guarantees of future market behaviour or outcomes.