Many traders early on in their trading journey may jump into trading without knowing if their system or edge can be profitable. The most important metric that a trader should measure their system on is by using expected value. This essentially wors out the average return that the system will return for every trade that it makes, considering both winning trades and losing trades.
The formular for the expected value is written below. Expected Value = (Probability of winning trade X Average Winning Trade Value) – (Probability of a Losing trade X Average Loss) For example, Trader A - Wins 40% of their trades - Loses 60% of their trades - Average win = $20 - Average Loss = $10 Therefore, Expected Value = (0.4x20) – (0.6x10) = $2 This means over the long run the system will return $2.00 per trade made. This relationship describes any trading strategy or edge’s average performance per trade.
Therefore, by determining the expected value a trader can see how effective their edge will be excluding slippage and transaction costs in the long term. Risk and Return The relationship also shows that a strategy does not need to necessarily win every single trade to be profitable. The rule of risk and reward is that they are inversely correlated.
This means that the more a trader is willing to risk, whether it be size or distance to a stop loss the higher potential reward. Alternatively, the less risk a trader takes the lower potential reward. It doesn’t matter which type of trader you are often different personality types will gravitate to either more frequent winning and smaller winnings or larger winnings, but a smaller number of wins.
In fact, a trader may only need to be profitable on 20% of their trades if they can ensure that their average winning trades are more profitable by a factor of 5:1. A strategy that wins more frequently may only need a smaller average win vs its average loss. When testing a system, it is important that there is sufficient data to ensure the inputs for the above formula is accurate.
This means using data from various time periods and potentially across a range of markets to measure the Expected Value of the system. See below for the required a=Average Winning trade/Average Loss trade per Average win rate for a breakeven trading system. Ultimately it is vital that when assessing the performance of a trading strategy or edge to be able to measure the profitability of the system.
The best way to do this is by using expected value. Profitable trading strategies can be made with either a high win rate and low average W/L ratio or a low winning strategy with a high W/L ratio.
By
GO Markets
Disclaimer: Articles are from GO Markets analysts and contributors and are based on their independent analysis or personal experiences. Views, opinions or trading styles expressed are their own, and should not be taken as either representative of or shared by GO Markets. Advice, if any, is of a ‘general’ nature and not based on your personal objectives, financial situation or needs. Consider how appropriate the advice, if any, is to your objectives, financial situation and needs, before acting on the advice.
One day the ASX is drifting quietly... and the next, margin requirements rise, stops do not fill where expected, and portfolios open with uncomfortable overnight gaps.
If you have been searching for answers, you are not alone. Some of the most searched questions about volatility among Australian traders relate to margin calls, slippage, overnight gaps, leveraged exchange traded funds (ETFs), and tools such as average true range (ATR).
Here is what is happening.
Why this matters now
Global markets have become more sensitive to interest rates, inflation data, geopolitics and technology-driven flows. When liquidity thins and uncertainty rises, price swings widen. That is volatility.
And volatility doesn’t just affect price direction, it changes how trades are executed, how much capital is required, and how risk behaves beneath the surface.
Translation: Volatility is not just about bigger moves, rather, it’s about faster moves and thinner liquidity - that’s when the mechanics of trading matter most.
One of the most searched questions about volatility is why margin requirements increase without warning.
When markets become unstable, brokers may increase margin requirements on contracts for difference (CFDs) and other leveraged products. Larger price swings can increase the risk of accounts moving into negative equity thus raising margin requirements reduces available leverage and can help manage exposure during extreme conditions.
What this can mean in practice
-A margin call may occur even if price has not moved significantly. -Effective leverage can drop quickly. -Positions may need to be reduced at short notice.
Margin adjustments are typically a response to changing market risk, not a random decision. In highly volatile markets, it is prudent to assume margin settings can change quickly, therefore many traders choose to review position sizes and available buffers in light of that risk.
What is slippage and why didn’t my stop fill at my price?
Another frequently searched topic is slippage.
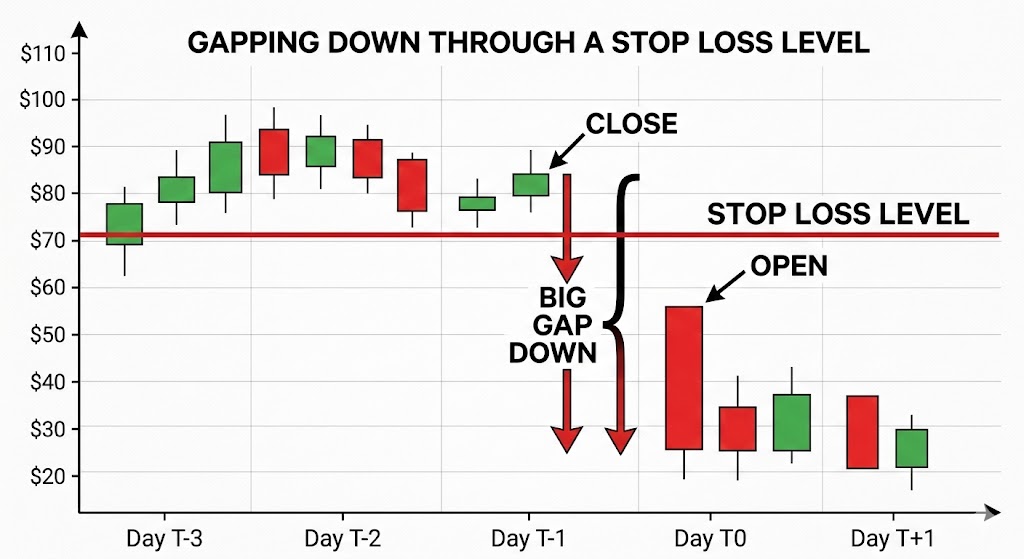
Slippage can occur when a stop order triggers and is executed at the next available price, the outcome can depend on the order type, market liquidity and gaps. In calm markets, the difference may be small whereas in fast markets, prices can gap beyond the stop level.
Illustration of price gap through stop-loss level | GO Markets
Stop-loss orders generally prioritise execution rather than price certainty and during periods of high volatility, this distinction becomes important. Adjusting position size and placing stops with reference to typical price movement may be more effective than simply tightening stops in unstable conditions.
How do I manage overnight gapping on the ASX?
Australia trades while the United States sleeps, and vice versa. This time zone difference is, sadly, one reason overnight gap risk is frequently searched by Australian traders. If US markets fall sharply, the ASX may open lower the following morning, with no opportunity to exit between the close and the open.
Examples of risk-management approaches market traders may use include
-Index hedging using ASX 200 futures or CFDs*. -Partial hedging during high risk events. -Reducing exposure ahead of major macro announcements.
Hedging can offset part of a move, but it introduces basis risk as individual stocks may not move in line with the broader index.
There is no perfect protection, only trade-offs between cost, complexity and risk reduction.
*CFDs are complex instruments and come with a high risk of losing money due to leverage.
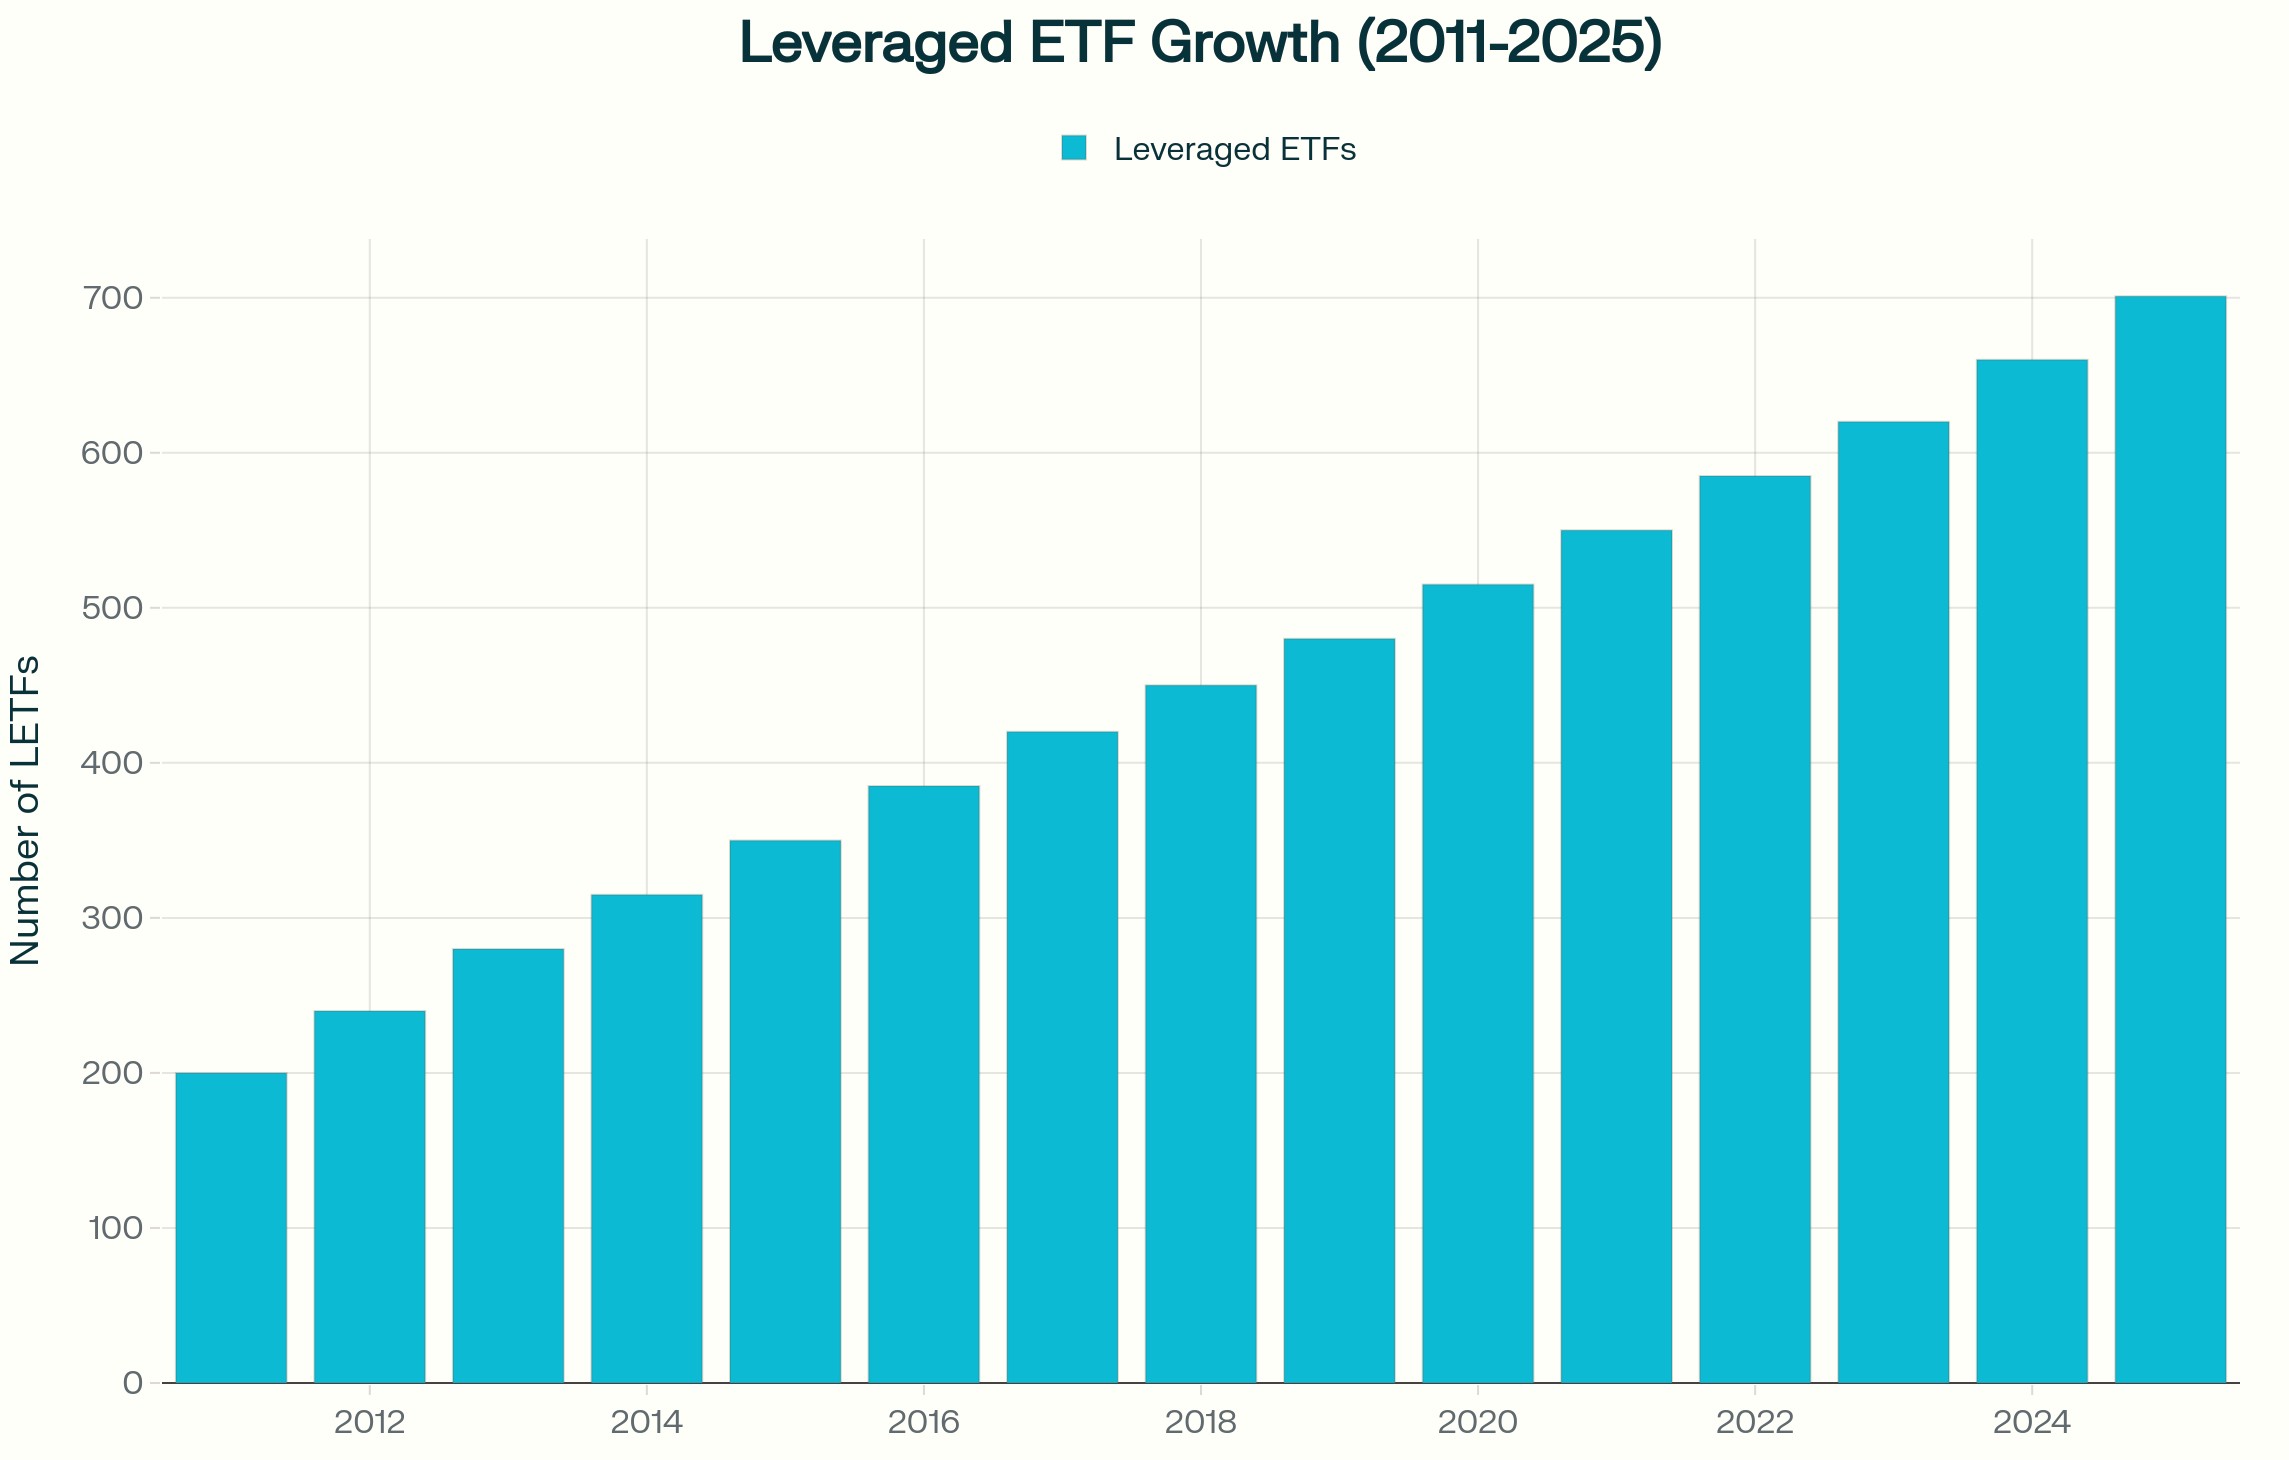
What are the key risks of leveraged or inverse ETFs in volatile markets?
Leveraged and inverse ETFs are often searched during periods of heightened volatility.
While these products typically reset daily, they aim to deliver a multiple of the index’s daily return, not its long-term return. In a volatile, sideways market, daily compounding can erode value even if the index finishes near its starting level.
This occurs because gains and losses compound asymmetrically. A fall of 10 percent requires a gain of more than 10 percent to recover. When that effect is multiplied daily, outcomes can diverge materially from the underlying index over time.
Such instruments may be used tactically by some market participants. They are generally not designed as long-term hedging tools and understanding their structure is essential before using them in a strategy.
How can ATR be used to inform stop placement?
Average true range (ATR) is a commonly used indicator for measuring volatility.
ATR estimates how much an asset typically moves over a given period, including gaps. Rather than setting a stop at an arbitrary percentage, some traders reference ATR and place stops at a multiple, such as two or three times ATR, to reflect prevailing conditions.
When volatility rises, ATR expands and that can imply wider stops or smaller position sizes if overall risk is to remain constant. The shift is from asking, “How far am I willing to lose?” to asking, “What is a normal move in current conditions?"
Practical considerations in volatile markets
During periods of elevated volatility, traders may consider
Allowing for the possibility of margin changes
Sizing positions conservatively if volatility increases
Recognising that stop-loss orders do not guarantee a specific exit price
Reviewing exposure ahead of major economic events
Understanding the daily reset mechanics of leveraged ETFs
Using volatility measures such as ATR to inform stop placement
Maintaining adequate cash buffers
Volatility does not reward prediction alone. Preparation and risk awareness may assist traders in understanding potential risks, but outcomes remain unpredictable.
Australian markets face specific structural considerations cpmapred to Asian and US Markets. Overnight gap risk is influenced by US trading hours and resource heavy indices such as the ASX can respond quickly to commodity price movements and data from China. Currency exposure, including AUD and US dollar (USD) moves, can add another layer of variability.
Volatility is not uniform across regions. It behaves differently depending on market structure and liquidity depth.
Frequently asked questions about volatility
What causes sudden spikes in market volatility? Interest rate decisions, inflation data, geopolitical developments, earnings surprises and liquidity constraints are common triggers.
Why do brokers increase margin during volatile markets? To reduce leverage exposure and manage risk when price swings widen.
Can stop-loss orders fail during volatility? They can experience slippage if markets gap beyond the stop level, meaning execution may occur at a worse price than expected. In fast or illiquid markets, this difference can be significant.
Are leveraged ETFs suitable for long term hedging? They are generally structured for short-term exposure due to daily resets. Whether they are appropriate depends on your objectives, financial situation and risk tolerance.
How can volatility be measured before placing a trade? Tools such as ATR, implied volatility indicators and historical range analysis can help quantify prevailing conditions.
Risk warning: Periods of heightened volatility can lead to rapid price movements, margin changes and execution at prices different from those expected. Risk-management tools such as stop-loss orders and volatility indicators may assist in assessing market conditions but cannot eliminate the risk of loss, particularly when using leveraged products.
Every trader has had that moment where a seemingly perfect trade goes astray.
You see a clean chart on the screen, showing a textbook candle pattern; it seems as though the market planets have aligned, and so you enthusiastically jump into your trade.
But before you even have time to indulge in a little self-praise at a job well done, the market does the opposite of what you expected, and your stop loss is triggered.
This common scenario, which we have all unfortunately experienced, raises the question: What separates these “almost” trades from the truly higher-probability setups?
The State of Alignment
A high-probability setup isn’t necessarily a single signal or chart pattern. It is the coming together of several factors in a way that can potentially increase the likelihood of a successful trade.
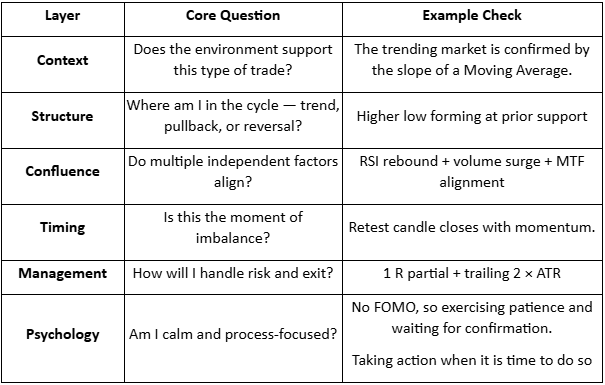
When combined, six interconnected layers can come together to form the full “anatomy” of a higher-probability trading setup:
Context
Structure
Confluence
Timing
Management
Psychology
When more of these factors are in place, the greater the (potential) probability your trade will behave as expected.
Market Context
When we explore market context, we are looking at the underlying background conditions that may help some trading ideas thrive, and contribute to others failing.
Regime Awareness
Every trading strategy you choose to create has a natural set of market circumstances that could be an optimum trading environment for that particular trading approach.
For example:
Trending regimes may favour momentum or breakout setups.
Ranging regimes may suit mean-reversion or bounce systems.
High-volatility regimes create opportunity but demand wider stops and quicker management.
Investing time considering the underlying market regime may help avoid the temptation to force a trending system into a sideways market.
Simply looking at the slope of a 50-period moving average or the width of a Bollinger Band can suggest what type of market is currently in play.
Sentiment Alignment
If risk sentiment shifts towards a specific (or a group) of related assets, the technical picture is more likely to change to match that.
For example, if the USD index is broadly strengthening as an underlying move, then looking for long trades in EURUSD setups may end up fighting headwinds.
Setting yourself some simple rules can help, as trading against a potential tidal wave of opposite price change in a related asset is not usually a strong foundation on which to base a trading decision.
Key Reference Zones
Context also means the location of the current price relative to levels or previous landmarks.
Some examples include:
Weekly highs/lows
Prior session ranges, e.g. the Asian high and low as we move into the European session
Major “round” psychological numbers (e.g., 1.10, 1000)
A long trading setup into these areas of market importance may result in an overhead resistance, or a short trade into a potential area of support may reduce the probability of a continuation of that price move before the trade even starts.
Market Structure
Structure is the visual rhythm of price that you may see on the chart. It involves the sequences of trader impulses and corrections that end up defining the overall direction and the likelihood of continuation:
Uptrend: Higher highs (HH) and higher lows (HL)
Downtrend: Lower highs (LH) and lower lows (LL)
Transition: Break in structure often followed by a retest of previous levels.
A pullback in an uptrend followed by renewed buying pressure over a previous price swing high point may well constitute a higher-probability buy than a random candle pattern in the middle of nowhere.
Compression and Expansion
Markets move through cycles of energy build-up and release. It is a reflection of the repositioning of asset holdings, subtle institutional accumulation, or a response to new information, and may all result in different, albeit temporary, broad price scenarios.
Compression: Evidenced by a tightening range, declining ATR, smaller candles, and so suggesting a period of indecision or exhaustion of a previous price move,
Expansion: Evidenced by a sudden breakout, larger candle bodies, and a volume spike, is suggestive of a move that is now underway.
A breakout that clears a liquidity zone often runs further, as ‘trapped’ traders may further fuel the move as they scramble to reposition.
A setup aligned with such liquidity flows may carry a higher probability than one trading directly into it.
Confluence
Confluence is the art of layering independent evidence to create a whole story. Think of it as a type of “market forensics” — each piece of confirmation evidence may offer a “better hand’ or further positive alignment for your idea.
There are three noteworthy types of confluence:
Technical Confluence – Multiple technical tools agree with your trading idea:
Moving average alignment (e.g., 20 EMA above 50 EMA) for a long trade
A Fibonacci retracement level is lining up with a previously identified support level.
Momentum is increasing on indicators such as the MACD.
Multi-Timeframe Confluence – Where a lower timeframe setup is consistent with a higher timeframe trend. If you have alignment of breakout evidence across multiple timeframes, any move will often be strengthened by different traders trading on different timeframes, all jumping into new trades together.
3. Volume Confluence – Any directional move, if supported by increasing volume, suggests higher levels of market participation. Whereas falling volume may be indicative of a lesser market enthusiasm for a particular price move.
Confluence is not about clutter on your chart. Adding indicators, e.g., three oscillators showing the same thing, may make your chart look like a work of art, but it offers little to your trading decision-making and may dilute action clarity.
Think of it this way: Confluence comes from having different dimensions of evidence and seeing them align. Price, time, momentum, and participation (which is evidenced by volume) can all contribute.
Timing & Execution
An alignment in context and structure can still fail to produce a desired outcome if your timing is not as it should be. Execution is where higher probability traders may separate themselves from hopeful ones.
Entry Timing
Confirmation: Wait for the candle to close beyond the structure or level. Avoid the temptation to try to jump in early on a premature breakout wick before the candle is mature.
Retests: If the price has retested and respected a breakout level, it may filter out some false breaks that we will often see.
Then act: Be patient for the setup to complete. Talking yourself out of a trade for the sake of just one more candle” confirmation may, over time, erode potential as you are repeatedly late into trades.
Session & Liquidity Windows
Markets breathe differently throughout the day as one session rolls into another. Each session's characteristics may suit different strategies.
For example:
London Open: Often has a volatility surge; Range breaks may work well.
New York Overlap: Often, we will see some continuation or reversal of morning trends.
Asian Session: A quieter session where mean-reversion or range trading approaches may do well
Trade Management
Managing the position well after entry can turn probability into realised profit, or if mismanaged, can result in losses compounding or giving back unrealised profit to the market.
Pre-defined Invalidation
Asking yourself before entry: “What would the market have to do to prove me wrong?” could be an approach worth trying.
This facilitates stops to be placed logically rather than emotionally. If a trade idea moves against your original thinking, based on a change to a state of unalignment, then considering exit would seem logical.
Scaling & Partial Exits
High-probability trade entries will still benefit from dynamic exit approaches that may involve partial position closes and adaptive trailing of your initial stop.
Trader Psychology
One of the most important and overlooked components of a higher-probability setup is you.
It is you who makes the choices to adopt these practices, and you who must battle the common trading “demons” of fear, impatience, and distorted expectation.
Let's be real, higher-probability trades are less common than many may lead you to believe.
Many traders destroy their potential to develop any trading edge by taking frequent low-probability setups out of a desire to be “in the market.”
It can take strength to be inactive for periods of time and exercise that patience for every box to be ticked in your plan before acting.
Measure “You” performance
Each trade you take becomes data and can provide invaluable feedback. You can only make a judgment of a planned strategy if you have followed it to the letter.
Discipline in execution can be your greatest ally or enemy in determining whether you ultimately achieve positive trading outcomes.
Bringing It All Together – The Setup Blueprint
Final Thoughts
Higher-probability setups are not found but are constructed methodically.
A trader who understands the “higher-probability anatomy” is less likely to chase trades or feel the need to always be in the market. They will see merit in ticking all the right boxes and then taking decisive action when it is time to do so.
It is now up to you to review what you have in place now, identify gaps that may exist, and commit to taking action!
One of the most impactful books I’ve ever read is “The 7 Habits of Highly Effective People: Powerful Lessons in Personal Change” by Stephen Covey.
When it was first published in 1989, it quickly became one of the most influential works in business and personal development literature, and retained its place on bestseller lists for the next couple of decades.
The compelling, comprehensive, and structured framework for personal growth presented in the book has undoubtedly inspired many to rethink how they organise their lives and priorities, both professionally and personally.
Although its lessons were originally designed for self-improvement and positive structured growth, the underlying principles are universal, making them easily transferable to many areas of life, including trading.
In this article, you will explore how each of Covey’s seven original habits can be reframed within a trading context, in an attempt to offer a structure that may help guide you to becoming the best trader you can be.
1. Be Proactive
Being proactive means recognising that we have the power to choose our responses and to shape outcomes through appropriate preparation with subsequent planned reactions.
In a Trading Context:
For traders, this means anticipating potential problems before they arise and putting measures in place to better mitigate risk.
Rather than waiting for issues to unfold, the proactive trader identifies potential areas of concern and ensures that they have access to the right tools, resources, and people to prepare effectively, whatever the market may throw at them.
What This Means for You:
Being proactive may involve seeking out quality education and services, maintaining access to accurate and timely market information, continually assessing risk and opportunity, and having systems to manage those risks within defined limits.
Consequences of Non-Action:
Inadequate preparation and a lack of defined systems often lead to poor trading decisions and less-than-desired outcomes.
Failing to assess risk properly can result in significant and often avoidable losses.
By contrast, a proactive approach builds resilience and confidence, ensuring that when challenges arise, your response is measured and less emotionally driven by what is happening on the screen in front of you.
2. Begin with the End in Mind
Covey's second habit is about defining purpose. It suggests that effective people are more likely to achieve what is possible if they start with a clear understanding of their destination, so every action aligns with that ultimate vision.
In a Trading Context:
Ask yourself: What is my true purpose for trading?
Many traders may instinctively answer “to make money,” but money is surely only a vehicle to achieve something else in your world for you and those you care about, not a purpose per se.
You need to clarify what trading success really means for you.
Is it a greater degree of financial independence through increased income or capital growth, the freedom of having more time, achieving a personal challenge of becoming an effective trader, or a combination of any of these?
What This Means to You:
Try framing your purpose as, “I must become a better trader so that I can…” and complete a list with your genuine reasons for tackling the market and its challenges.
This helps you establish meaningful short-term development goals that keep you moving toward your vision. Keep that purpose visible, as a note near your trading screen that reminds you why you are doing this.
Consequences of Non-Action:
Traders with a clearly defined purpose are more likely to stay disciplined and consistent.
Those without one often drift, chasing short-term gains without direction. There is ample evidence that formalising your development in whatever context through goal setting can significantly increase the likelihood of success. Why would trading be any different?
Surely the bottom-line question to ask yourself is, “Am I willing to risk my potential by trading without purpose?”
3. Put First Things First
This habit is about time management and prioritisation. This involves focusing your efforts and energy on what truly matters. As part of the exploration of this concept, Covey emphasised distinguishing between what is important and what is merely urgent.
In a Trading Context:
Trading demands commitment, learning, and reflection.
It is not just about screen time but about using that time effectively.
Managing activities to ensure your effort is spent wisely on planning, measuring, journaling and performance evaluation, and refining systems, accordingly, are all critical to sustaining both improvements in results and balance.
What This Means to You:
Traders often believe they need to spend more time trading when what they really need is to focus on better time allocation.
It is logical to suggest that prioritising activities that can often contribute directly to improvement, such as system testing, reviewing performance, analysing results, and refining your strategy, is worthwhile.
These high-value tasks can help traders focus their time more deliberately and systematically.
Consequences of Non-Action:
If you fail to control your trading time effectively, you will be more likely to spend much of it on low-impact activities that produce little progress.
Over time, this not only hurts your results but also reduces the real “hourly value” of your trading effort.
In business terms, and of course, you should be treating your trading as you would any business activity; poor prioritisation can inflate your costs and diminish your potential trading outcomes.
4. Think Win: Win
Covey's fourth habit encouraged an attitude of mutual benefit, where seeking solutions that facilitate positive outcomes for all parties.
In a Trading Context:
In trading, this concept must be adapted to suggest that developing a mindset that recognises every well-executed plan as a win, even when an individual trade results in a loss.
Some trading ideas will simply not work out, and so some losses are inevitable, but if they remain within defined limits, they should not be viewed as failures but rather as a successful adherence to a trading plan. In the aim of developing consistency in action, and the widely held belief that this is one of the cornerstones of effective trading, then it surely is a win to fulfil this.
So, in simple terms, the real “win” lies in a combination of maintaining discipline, following your system, and controlling risk beyond just looking at the P/L of a single trade.
What This Means to You:
Building and trading clear, unambiguous systems that you follow consistently has got to be the goal.
This process produces reliable data that you can later analyse and subsequently use to refine specific strategies and personal performance.
When you do this, every outcome, whether profit or loss, can serve as valuable feedback.
For example, a controlled loss that fits your plan is proof that your system works and that you are protecting your capital.
Alternatively, a trailing stop strategy, which means you exit trades in a timely way and give less profit back to the market, provides positive feedback that your system has merit in achieving outcomes.
Consequences of Non-Action:
Without this mindset shift, traders can become emotionally reactive, interpreting normal drawdowns as personal defeats.
This fosters loss aversion and other biases that can erode decision-making quality if left unchecked. Through the process of redefining “winning,” you are potentially safeguarding both your capital and, importantly, your trading confidence (a key component of trading discipline).
5. Seek First to Understand and Then Take Action
Covey's fifth habit emphasises empathy, the act of listening and aiming to fully understand before responding. In trading, this principle translates to understanding the market environment before taking any action.
In a Trading Context:
Many traders act impulsively, driven by excitement or fear, which often results in entering trades without taking into account the full context of what is happening in the market, and/or the potential short-term influences on sentiment that may increase risk.
This “minimalisation bias,” defined as acting on limited information, will rarely produce consistent results. Instead, adopt a process that begins with observation and comprehension.
What This Means to You:
Establishing a daily pre-trading routine is critical. This may include a review of key markets, sentiment indicators, and potential catalysts for change, such as imminent key data releases. Understanding what the market is telling you before you decide what to do is the aim of having this sort of daily agenda.
This approach may not only improve trade selection but also enable you to get into a state of psychological readiness that can facilitate decision-making quality throughout the session.
Consequences of Non-Action:
Failing to prepare for the trading day ahead can mean not only exposing yourself to unnecessary risk but also arguably being more likely to miss potential opportunities.
A trader who acts without understanding is vulnerable both psychologically and financially. Conversely, being forewarned is being forearmed. When you aim to understand markets first before any type of trading activity, your actions are more likely to be deliberate, grounded, and more effective.
6. Synergise
Synergy in Covey's model means valuing differences and combining the strengths of those around you to create outcomes greater than the sum of their parts.
In a Trading Context:
In trading, synergy refers to the integration of multiple systems and disciplines that work together. This includes your plan, your record keeping and performance management processes, your time management, and your emotional balance.
No single system is enough; success comes from the synergy of elements that support and inform one another.
What This Means to You:
Integrating learning and measurement is an integral part of your trading development process. Journaling, for example, allows you to assess not only your technical performance but also your behavioural consistency.
This self-awareness allows you to refine your plan and so helps you operate with greater confidence.
The synergy between rational analysis and emotional composure is what is more likely to lead to consistently sound trading decisions.
Consequences of Non-Action:
When logic and emotion are out of balance, decision-making will inevitably suffer.
If your systems are incomplete, ambiguous, or poorly connected to the reality of your current level of understanding, competence and confidence, your results are likely to be inconsistent. Building synergy across all areas of your trading practice, including that of evaluation and development in critical trading areas, will help create cohesion, efficiency, and better performance.
7. Sharpen the Saw
Covey's final habit focuses on continuous learning and refinement, including maintaining and improving the tools at your disposal and skills and knowledge that allow you to perform effectively.
In a Trading Context:
In trading, this translates to creating a plan to achieve ongoing, purposeful learning.
Even small insights can make a large difference in results. Effective traders continually refine their knowledge, ask new questions, and apply lessons from experience.
What This Means to You:
Trading learning can, of course, take many forms. Discovering new indicators that may offer some confluence to price action, testing different strategies, exploring new markets, or simply understanding more about yourself as a trader.
There is little doubt that active participation in learning keeps you engaged, adaptable and sharp. Even making sure you ask at least one question at a seminar or webinar or making a simple list at the end of each session of the "3 things I learned", can be invaluable in developing momentum for your growth as a trader.
Your record-keeping and performance metrics should generate fresh questions that can guide future development.
Consequences of Non-Action:
Without direction in your learning, your progress is likely to slow.
I often reference that when someone talks about trading experience in several years, this is only meaningful if there has been continuous growth, rather than staying in the same place every year (i.e. only one year of meaningful experience)
Passive trading learning, for example, reading an article without applying, watching a webinar without engagement, or measuring without closing the circle through putting an action plan together for your development, can all lead to stagnation.
It is fair to suggest that taking shortcuts in trading learning is likely to translate directly into shortcuts in result success.
Active, focused development is essential for sustained improvement.
Are You Ready for Action?
Stephen Covey’s The 7 Habits of Highly Effective People presented a timeless model for self-development and purposeful living.
When applied to trading, these same habits form a powerful framework for consistency, focus, and growth.
Trading is a pursuit that demands both technical skill and emotional strength. Success is rarely about finding the perfect system, but about developing the right habits that support consistent, rational decision-making over time.
By integrating the principles of Covey’s seven habits into your trading practice, you create a foundation not only for profitability but for continual personal growth.
ASX defence stocks are back on more watchlists and according to the Stockholm International Peace Research Institute (SIPRI), global military spending reached approximately US$2.718 trillion in 2024, up 9.4% in real terms.
Australia’s current defence settings are set out in the 2024 National Defence Strategy and related investment planning documents, which outline long-term capability funding priorities. Furthermore, Canberra has pointed to A$330 billion of capability investment through 2034, including added funding for surface combatants, preparedness, long-range strike and autonomous systems.
Here is the part most people miss: not all ASX defence stocks are the same trade. Some sit close to naval shipbuilding. Some are counter-drone names and some are smaller, higher-risk operators where one contract may matter much more than the market assumes.
These five names are not a buy list, rather they are a practical watchlist for investors trying to understand where procurement momentum may actually show up on the ASX.
1) Austal (ASX: ASB)
Austal is one of the ASX-listed companies most directly exposed to Australia’s naval shipbuilding pipeline, although contract execution, margins and delivery timing remain important variables.
They aren't just winning random contracts; they have signed a massive legal agreement (the Strategic Shipbuilding Agreement) that makes them the official partner for building Australia's next generation of mid-sized military ships in Western Australia.
In February 2026, the government gave Austal the green light on a $4 billion project. This isn't for just one ship, it’s for 8 "Landing Craft Heavy" vessels. These are huge transport ships (about 100 metres long) designed to carry heavy tanks and equipment directly onto a beach. But here is the part most people miss, shipbuilding is a marathon, not a sprint.
As you can see in the delivery timeline, while construction starts in 2026, the final ship won't be delivered until 2038. For an investor, this means Austal has a "guaranteed" stream of income for the next 12 years, but they have to be very good at managing their costs over that long period to actually make a profit.
2) DroneShield (ASX: DRO)
If you have seen footage of small drones disrupting modern battlefields, DroneShield is building part of the "off switch". Its focus is counter-drone technology, including systems that detect, disrupt or defeat drones using electronic warfare, sensors and software-led tools, rather than relying only on traditional munitions.
By early 2026, DroneShield had moved beyond the label of a promising start-up and into a much larger commercial phase. It reported FY2025 revenue of A$216.5 million, up 276% from FY2024, and said it started FY2026 with A$103.5 million in committed revenue.
One point the market may overlook is the software layer in the model. DroneShield reported A$11.6 million in Software as a Service (SaaS) revenue in FY2025 and said it is working towards SaaS making up 30% of revenue within five years. Its subscription model includes software updates for deployed systems, which adds a growing stream of recurring revenue alongside hardware sales.
Among ASX defence stocks, DroneShield is one of the most direct ways to follow the counter-UAS theme. It is also one of the names where sentiment can swing quickly, because growth stories can rerate both up and down when order timing changes.
EOS builds both the "brain" and the "muscle" for military platforms. It is best known for remote weapon systems, which allow operators to control armed turrets from inside protected vehicles, and for high-energy laser systems aimed at counter-drone defence. EOS has said its unconditional backlog reached about A$459.1 million in early 2026, following a series of contract wins through 2025. That points to a much larger base of secured work, although delivery timing and revenue conversion still matter.
EOS signed a €71.4 million, about A$125 million, contract with a European customer for a 100-kilowatt high-energy laser weapon system. EOS says the system is designed for a low cost per shot and can engage up to 20 drones a minute. The Australian Government has set aside A$1.3 billion over 10 years for counter-drone capability acquisition, and EOS has disclosed that it was part of a successful LAND 156 bid team. That does not guarantee future revenue, but it does support medium-term visibility in a market the company is already targeting.
EOS reads as a rebound story, but one that still depends on execution. The company has reoriented around remote weapon systems, counter-drone systems and lasers, all areas tied to stronger defence spending. The key question is whether it can keep converting backlog and pipeline into delivered revenue while maintaining balance-sheet discipline.
4) Codan (ASX: CDA)
Codan is sometimes left out of casual defence stock lists because it is more diversified. That may be an oversight. In its H1 FY26 results, Codan said its Communications business designs mission-critical communications for global military and public safety markets. Communications revenue rose 19% to A$221.8 million. The company also said DTC delivered strong growth from defence and unmanned systems demand, with unmanned systems revenue up 68% to A$73 million. Codan said about half of that unmanned revenue was linked to operational defence applications in conflict zones.
This is where the story becomes more nuanced. In a basket of ASX defence stocks, Codan may offer a different profile, with less pure headline sensitivity, broader operating diversification and meaningful exposure to military communications and unmanned systems without being a single-theme name. That diversification may also mean the stock does not always trade like a pure-play defence name.
HighCom sits at the speculative end of this list, and it should be labelled that way. The company says its two continuing businesses are HighCom Armor, which supplies ballistic protection, and HighCom Technology, which supplies and maintains small and medium uncrewed aerial systems, counter-uncrewed aerial systems, and related engineering, integration, maintenance and logistics support for the ADF and other aligned regional militaries.
In H1 FY26, revenue from continuing operations fell 59% to A$10.9 million, while EBITDA moved to a A$5.4 million loss from a A$1.9 million profit a year earlier. HighCom also disclosed A$5.1 million in HighCom Technology revenue, including A$3.5 million from small uncrewed aerial systems (SUAS) spare parts and A$1.6 million from sustainment services provided to the Australian Department of Defence.
So yes, HighCom is one of the more financially sensitive ASX defence stocks on the board. But it is also the kind of smaller name that can show how procurement filters down into support, sustainment and specialist protection gear.
Key market observations
Track program milestones, not just political headlines. Contract awards, manufacturing starts, delivery schedules and sustainment work often matter more than a single announcement day.
Separate pure-play exposure from diversified exposure. DroneShield and EOS are closer to concentrated defence technology themes, while Codan brings communications exposure within a broader business mix.
Watch sovereign capability themes in Australia. Austal and EOS are tied to local manufacturing, integration and Australian supply chains, which supports the broader sovereign capability theme in this group.
Pay attention to balance sheets and cash conversion. Procurement momentum can be real even when timing gets messy. HighCom's latest half is a reminder of that.
Defence headlines can look immediate. Earnings usually are not. Austal's major naval work stretches into the next decade. EOS contracts are delivered over multiple years. DroneShield's order flow appears strong, but the company still separates committed revenue from broader pipeline opportunity. HighCom shows the other side of the coin. Exposure to procurement does not automatically translate into smooth financial execution.
References to ASX-listed defence stocks are general information only, not a recommendation to buy, sell or hold any security or CFD. These stocks can be highly volatile and are sensitive to contract timing, government policy, geopolitics, execution risk and market conditions. Backlog, pipeline and revenue expectations are not guarantees of future performance.
Three central banks are deciding rates simultaneously, Brent crude is swinging wildly around US$100 a barrel, and a war in the Middle East is rewriting the inflation outlook in real time. Whatever happens this week could set the tone for markets for the rest of 2026.
Quick facts
The Reserve Bank of Australia (RBA) announces its next cash rate decision on Tuesday, with markets now pricing a 66% chance of a second hike to 4.1%.
Some analysts have warned the Iran war could push US inflation to 3.5% by year-end and delay Fed rate cuts until September, making this week's FOMC dot plot the most closely watched in years.
Brent crude is flirting with US$100 a barrel after Iran launched what state media described as its "most intense operation since the beginning of the war."
RBA: Will Australia hike again?
The RBA raised the cash rate for the first time in two years to 3.85% at its February meeting after inflation picked up materially in the second half of 2025.
The question now is whether it moves again before even seeing the next quarterly CPI print, which isn't due until 29 April.
Deputy Governor Andrew Hauser acknowledged ahead of the meeting that policymakers face a genuinely divided decision, shaped by conflicting economic signals at home and growing instability abroad.
Financial markets currently assign around a 66% probability to another hike, with a May increase considered virtually certain regardless of what happens Monday.
The FOMC meets on March 17–18, with the policy statement scheduled for 2:00 pm ET on March 18 and Chair Jerome Powell's press conference at 2:30 pm. CME FedWatch shows a 99% probability that the Fed holds rates at 3.50% to 3.75%.
The real action is in the Summary of Economic Projections (SEP) and dot plot. The current median dot shows one 25-basis-point cut for 2026. If it shifts to two cuts, that is dovish and bullish for risk assets. If it shifts to zero cuts or adds a rate hike into the projection, markets could react in the other direction.
Further complicating matters, Powell's term as Federal Reserve Chair expires on May 23, 2026. Kevin Warsh is the leading candidate to replace him, viewed as more hawkish on monetary policy. Any comment from Powell on this transition could move markets independently of the rate decision itself.
Bank of Japan: Further tightening could be brought forward
The BOJ meets on March 18–19, with the decision expected Thursday morning Tokyo time. The current policy rate sits at 0.75% (a 30-year high), and the January 2026 meeting produced a hold in an 8-1 vote.
Governor Ueda has categorised the March meeting as "live," noting the timeline for further tightening could be "brought forward" if Shunto spring wage negotiations yield stronger-than-expected results.
Those results are due to begin flowing in during the week, making them the critical input for the BOJ's decision. Nomura expects 2026 Shunto wage hikes to come in around 5.0%, including seniority, with base pay growth of approximately 3.4%. If results confirm that trajectory, the case for a March hike strengthens considerably.
The complication is the global backdrop. Japan imports roughly 90% of its energy needs, and oil around US$100 per barrel is pushing up import costs and threatening to add inflationary pressure. A BOJ hike into a global oil shock would be an unusually bold move.
Most market participants still lean toward a hold at this meeting, with April or July seen as the more likely timing for the next move.
Brent crude briefly touched US$119.50 per barrel earlier in the week before dropping 17% to below US$80, then rebounding toward US$95 on mixed signals from Washington about the Strait of Hormuz.
As of Thursday, Brent was back over US$100 as Iran launched fresh attacks on commercial shipping and the IEA reserve release failed to bring meaningful relief.
In the scenario where a longer conflict inflicts damage to energy infrastructure, analysts estimate CPI could rise to 3.5% by the end of 2026, with gasoline prices approaching US$5 per gallon in the second quarter.
For this week, oil acts as a macro meta-variable. Every geopolitical headline, ceasefire signal, tanker attack, reserve release, and Trump comment could move equities, bonds and currencies in real time.
US-Israeli strikes on Iran launched on 28 February sent Brent crude surging past US$119 a barrel, gold above US$5,200, and defence stocks to all-time highs.
Against that backdrop, investors are focusing on a small group of commodity-linked names that may remain sensitive to further moves in oil, LNG and gold. The key question is whether the shock proves sustained, or whether a ceasefire, shipping normalisation, or policy action removes part of the geopolitical risk premium.
1. ExxonMobil (NYSE: XOM)
ExxonMobil has been one of the clearest beneficiaries of the price surge. Shares hit a record high of US$159.60 in early March and are up approximately 28% year-to-date.
The company produces 4.7 million barrels of oil equivalent per day, has a Permian Basin breakeven of around US$35/barrel, and is committed to US$20 billion in buybacks for 2026.
Wells Fargo raised its price target to US$183 from US$156 following the escalation, while broader analyst consensus sits around US$140–$144. However, XOM is already trading above many consensus targets, and disruption to its LNG partner QatarEnergy poses a near-term operational headwind.
Chevron touched a new 52-week high of US$196.76 in early March and has risen approximately 24% year-to-date.
The company's Brent breakeven for dividends and capital expenditure sits around US$50/barrel. This means that at current Oil prices above US$90, it is generating significant free cash flow.
However, Chevron has temporarily halted operations at a gas field off Israel's coast following missile activity in the region, and the stock has since pulled back more than 1% as the conflict directly affects its operations.
What to watch
Direct operational updates from Chevron's Middle East and Israeli assets.
Any further halts that could weigh on near-term production.
With Qatar having halted output after Iranian drone strikes, buyers across Asia and Europe are scrambling for alternative supply. Woodside, as one of Australia's largest LNG producers and exporters, sits outside the conflict zone and is well-positioned to benefit from rerouted demand.
Analysts caution that actual substitution takes time due to shipping and contract constraints, meaning the price uplift may be more durable than a simple spot trade. European TTF benchmark gas prices surged over 50% in a week, amplifying the margin environment for non-Middle Eastern LNG producers.
What to watch
The pace and timeline of any Qatar LNG production restart.
If QatarEnergy remains offline for weeks, Woodside could begin re-contracting European buyers at elevated spot prices.
An Australian dollar move higher could be a headwind worth tracking for USD-denominated earnings.
4. Cheniere Energy (NYSE: LNG)
Alongside Woodside, Cheniere is the most direct US beneficiary of the Qatar LNG disruption. As the largest LNG exporter in the United States, it saw intraday strength at the start of the conflict week.
US domestic energy production has buffered American consumers from the worst of the shock, but the export premium has widened as European and Asian buyers pay up for non-Gulf supply.
The trade is "geopolitically sensitive," and any resolution could reverse upside quickly. But for as long as Hormuz and Gulf gas infrastructure remain compromised, Cheniere is positioned to benefit structurally.
What to watch
Any diplomatic breakthrough that reopens Gulf shipping lanes.
Announcements of new long-term offtake contracts signed at current elevated prices.
Gold surged 5.2% in a single session on 1 March, touching US$5,246/oz, as markets sought safe-haven assets. Newmont, the world's largest gold producer, has seen its reserves effectively revalued at these prices.
It is up alongside gold's 24% year-to-date gain, and its all-in sustaining costs remain largely fixed.
However, Gold miners sold off sharply on 4 March, and Newmont fell nearly 8% in a single session as broader risk-off deleveraging hit precious metals equities.
The stock has recovered since, but volatility remains high. For longer-duration investors, analysts note that "safe" mining jurisdictions such as Canada, Australia, and Nevada are commanding fresh premiums as Middle East instability raises the value of geopolitically secure supply.
What to watch
Whether gold can hold above US$5,000/oz.
A prolonged conflict could accelerate an M&A cycle in junior gold miners.
A ceasefire or broad equity deleveraging event as the primary risk to monitor.
Lockheed Martin reached a new all-time high of US$676.70 on 3 March, up over 4% for the day. Its F-35 fighters, precision-guided munitions, THAAD systems, and HIMARS rocket artillery are central to the ongoing air campaign.
The US Department of Defence is moving to replenish munitions stockpiles, and Trump's stated ambition to raise the US defence budget to US$1.5 trillion by 2027 adds a longer-term structural tailwind beyond the immediate conflict.
Defence stocks are rising amid classic geopolitical risk pricing, but investors should note that actual contract flow takes time to translate into earnings, and valuations already reflect considerable optimism.
What to watch
The pace of US Department of Defence munitions replenishment orders.
How quickly contract wins translate into backlog growth.
Barrick is tracking gold's historic run alongside Newmont, with the stock up sharply year-to-date. It sits at a roughly US$78 billion market capitalisation and is reporting record free cash flow projections as its all-in sustaining costs remain well below current spot prices.
Like Newmont, it experienced a sharp single-session selloff of more than 8% during the broader 4 March deleveraging event, before partially recovering.
Royalty and streaming companies such as Wheaton Precious Metals (WPM) are being favoured by some investors as a more inflation-protected way to access gold upside, given their lower operational cost exposure. But Barrick remains one of the world’s largest listed gold miners, with earnings that are highly sensitive to changes in the gold price
What to watch
Gold's ability to hold above US$5,000/oz.
Any Barrick moves toward junior miner acquisitions.
Energy cost inflation, as rising fuel prices could begin to squeeze miner operating margins.


.jpg)
.jpg)


