- Accounts
- About
- Trading
- Platforms
- Tools
- News & education
- News & education
- News & analysis
- Education hub
- Economic calendar

News & Analysis
The Week Ahead – Charts to watch , AUDUSD, Dow, Gold
20 November 2023Last week price action hammered home the narrative that markets are still dancing to the tune of the Fed, with a broad rally in equities and a fall in yields and the USD being kickstarted by a cooler than expected US CPI figure and accelerating on further weak US economic data.
We are looking for a quieter week ahead after the recent big swings, it’s a holiday shortened week thanks to thanksgiving on Friday and the data due you would think is less market moving than the previous few weeks, though there are still some important data points to watch out for and some interesting charts to keep an eye on.
AUDUSD
The Aussie had a big week last week as falling US yields dragged down the USD and saw risk sentiment improve giving AUDUSD a double boost. At the start of the week it looked like AUDUSD was boing to test the lower band of its 3-month range and the major support at 0.63, only to dramatically turn around to test the upper band and major resistance at around 0.65 after the miss on US CPI. This 0.65 level will be key for range traders and breakout traders alike. For range traders a resistance hold and AUDUSD could drift lower to the recent range mean of 0.64 , for breakout traders a break and hold of the 0.65 level could see the Aussie retake the 0.65 – 0.69 range it traded in between March – August.
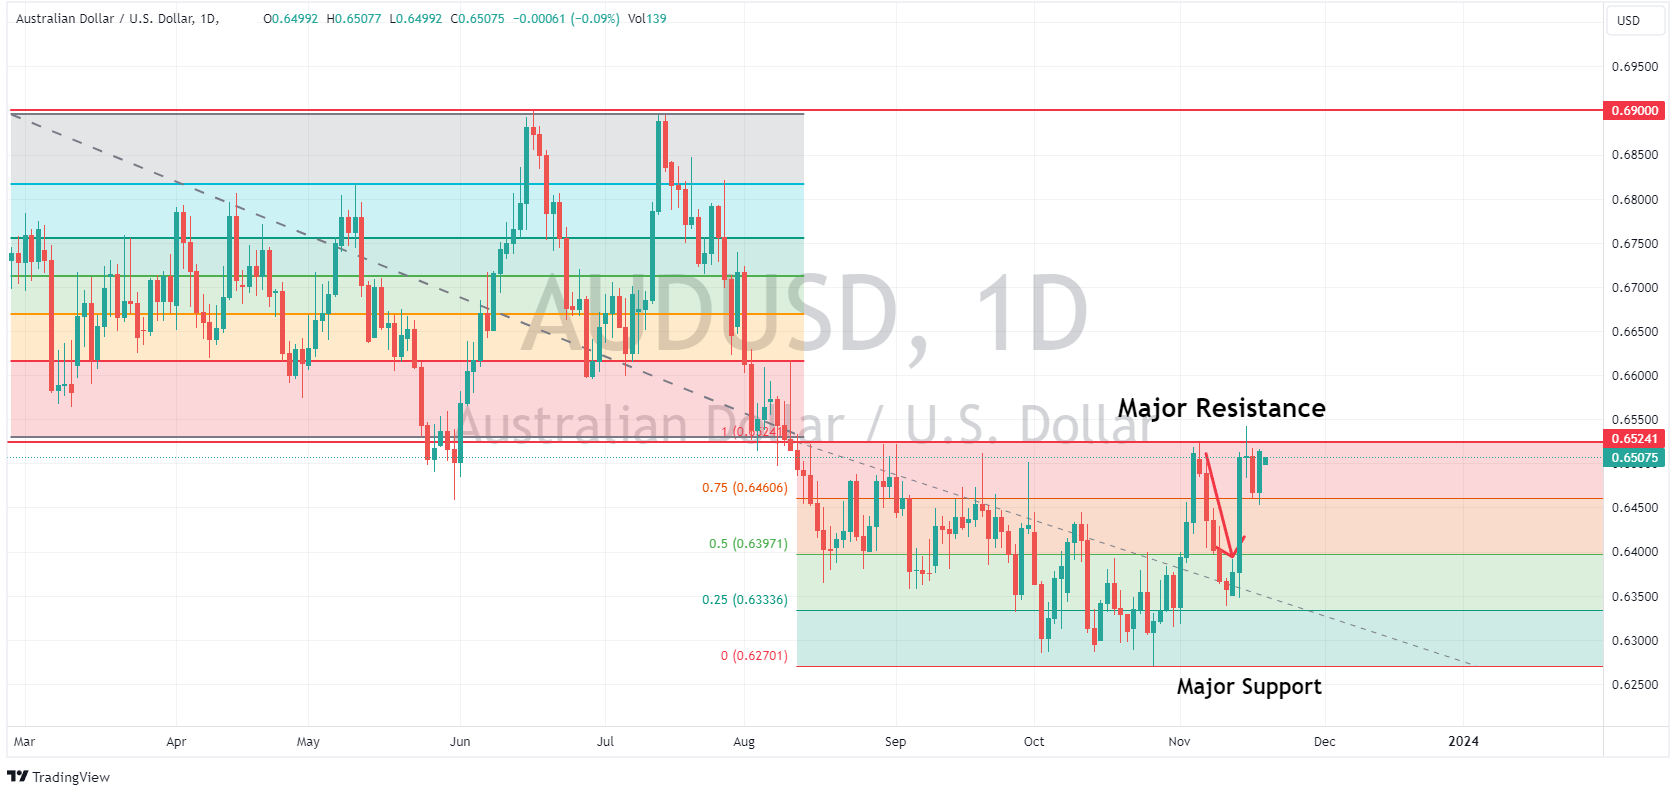
Data points to watch for AUD traders are RBA governor Bullock speaking on Tuesday and Wednesday and RBA minutes released also on Tuesday.
XAUUSD
Gold also had a big up week, bolstered by falling yields (making non-yielding gold being more attractive as a haven hedge against bonds) and a weaker USD and also benefitting it seems from residual haven flows with geopolitical events in Ukraine and Middle East still ongoing.
XAUUSD found strong support at its 200-day SMA which also lined up with the 38.2% Fib level (measured from Oct lows to highs) and pushed higher all week. Key levels to watch will be the November high at 2004 as resistance to the upside, and the 23.6 Fib level at 1962 where we saw some chop to the downside.
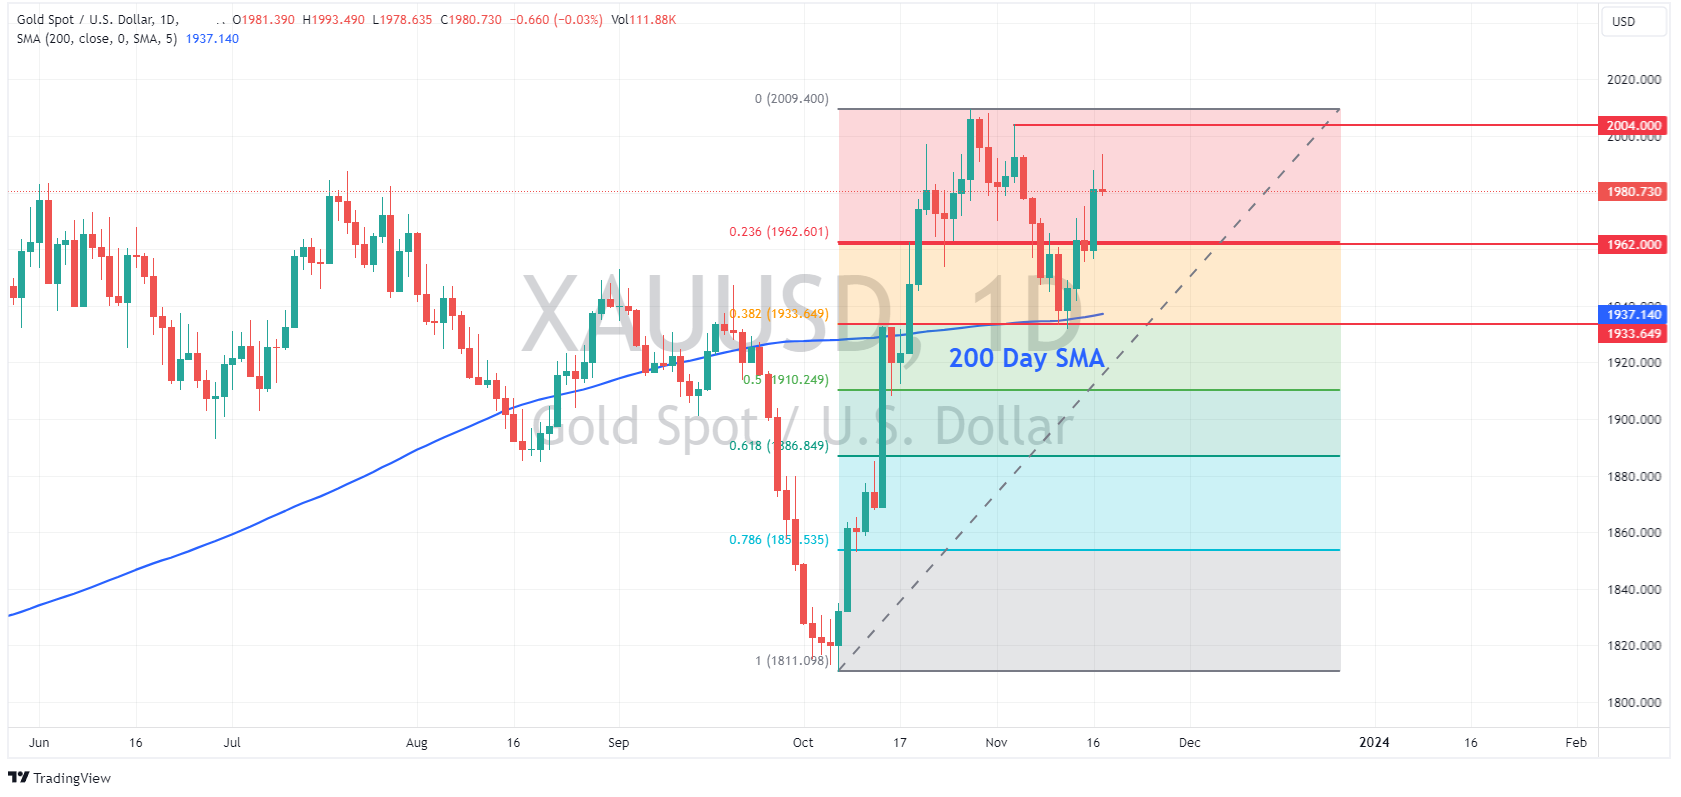
Data points to watch will be the FOMC minutes released on Wednesday and US unemployment claims on Thursday.
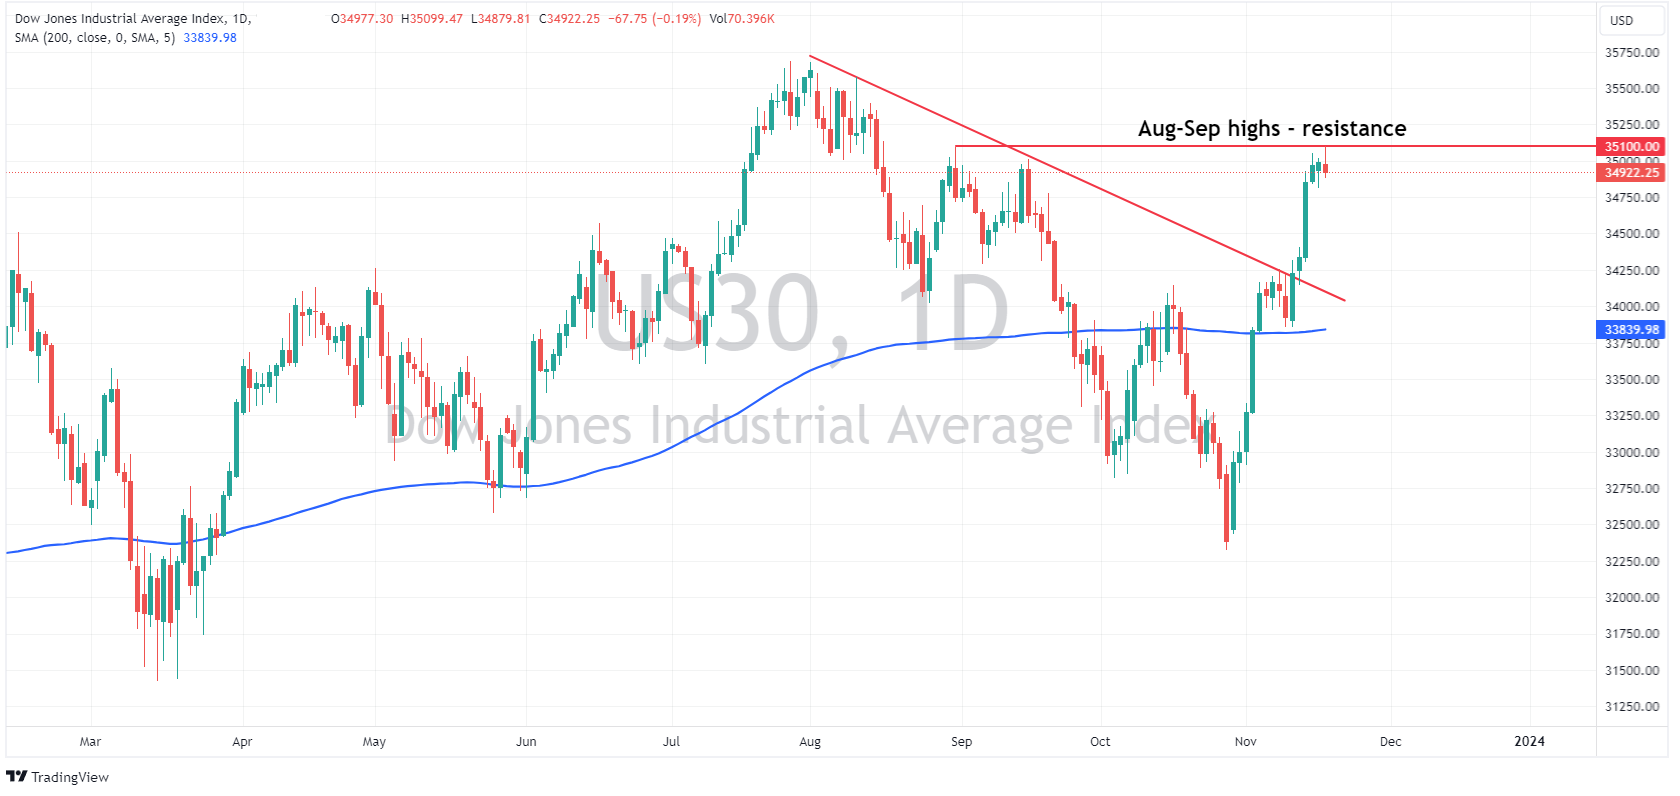
WS30
The Dow index broke out last week driven by market participants pricing in a Federal Reserve at the end of their rate hiking cycle and also some decent earnings out of US companies during the week.
WS30, like gold, also found support at the 200-day SMA early in the week and rallied strongly, breaking its upper downward sloping trendline and pushing to the September highs before finding resistance.
This level at 35100 will be a key level to test the strength of the upward momentum in equities, if resistance holds a retracement of the recent surge higher could be on the cards with support to the downside likely at 34261.
More dovish data and no surprises from the FOMC minutes and we could see WS30 looking to test the August high at 35678.
Full calendar of the major releases at link below:
Disclaimer: Articles are from GO Markets analysts and contributors and are based on their independent analysis or personal experiences. Views, opinions or trading styles expressed are their own, and should not be taken as either representative of or shared by GO Markets. Advice, if any, is of a ‘general’ nature and not based on your personal objectives, financial situation or needs. Consider how appropriate the advice, if any, is to your objectives, financial situation and needs, before acting on the advice. If the advice relates to acquiring a particular financial product, you should obtain and consider the Product Disclosure Statement (PDS) and Financial Services Guide (FSG) for that product before making any decisions.
Next Article
Tech leads US equity rally, USD and yields fall again, AUDUSD breaks out, USDJPY breaks down
US equities enjoyed a broad rally, with tech leading after news that recently ousted OpenAI CEO Sam Altman had been snapped up by Microsoft, the news helped MSFT and AI Chip maker NVDA stock rally over 2% each and pushing the Nasdaq to be the top performing US index. More weak data out of the US as well with leading indicators missing expect...
November 21, 2023
Read More >
Previous Article
FX Analysis – Falling Yields Pressure USD, the Key Levels to Watch.
Recent US figures have seen a rout in treasury yields with the flagship 10-year now yielding 4.435% after starting November at 16-year highs north of ...
November 17, 2023
Read More >