- Trading
- Trading
- Markets
- Markets
- Accounts
- Accounts
- Platforms & tools
- Platforms & tools
- Platforms
- Platforms
- Premium trading tools
- Premium trading tools
- Education
- Education
- Resources
- Resources
- Help & support
- Help & support
- About
- About
- Client support
- Trading
- Trading
- Markets
- Markets
- Accounts
- Accounts
- Platforms & tools
- Platforms & tools
- Platforms
- Platforms
- Premium trading tools
- Premium trading tools
- Education
- Education
- Resources
- Resources
- Help & support
- Help & support
- About
- About
- Client support
 News & Analysis
Natural Gas – Technical Analysis
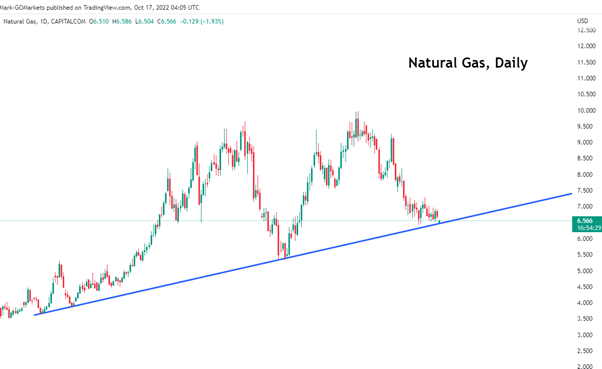
8 September 2022Natural gas has fallen roughly 30% since the start of September, and has now landed on a daily trend line. Taking a look at the last couple of weeks of price action, natural gas has been consolidating between $6.5 to $7.3 for the last 3 weeks as it decides on the next move.
Analysing the area that natural gas is currently sitting on, there is a major daily support/resistance area between $6.4 to $6.6 as seen below, highlighted in yellow:
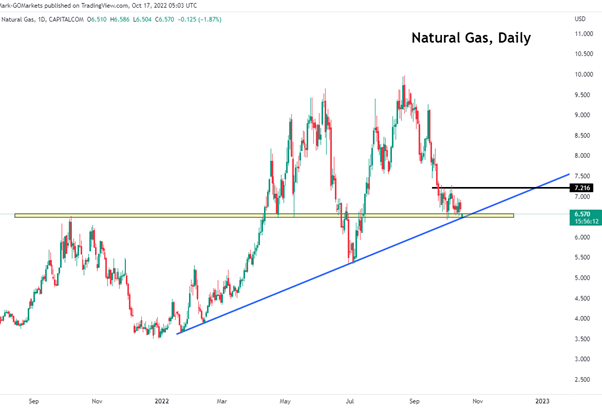
As natural gas bounces between the daily consolidation range, a break above the range (marked with a black horizontal line) could indicate a move to the upside, where the next resistance level is around $7.55, however if natural gas breaks below the trend line, the next support sits around $6.
Ready to start trading?
Disclaimer: Articles are from GO Markets analysts and contributors and are based on their independent analysis or personal experiences. Views, opinions or trading styles expressed are their own, and should not be taken as either representative of or shared by GO Markets. Advice, if any, is of a ‘general’ nature and not based on your personal objectives, financial situation or needs. Consider how appropriate the advice, if any, is to your objectives, financial situation and needs, before acting on the advice. If the advice relates to acquiring a particular financial product, you should obtain and consider the Product Disclosure Statement (PDS) and Financial Services Guide (FSG) for that product before making any decisions.
Next Article
Kroger tops estimates for Q2 – the stock is up
The Kroger Company (KR) released its latest financial results for Q2 on Friday. The American grocery supermarket chain reported revenue of $34.638 billion for the quarter vs. $34.461 billion estimate. Earnings per share also beat analyst estimates at $0.90 per share vs. $0.82 per share expected. "Kroger delivered strong second quarter resu...
September 12, 2022Read More >Previous Article
NIO Q2 results have arrived
NIO Q2 results have arrived NIO Inc. (NIO) reported its unaudited second quarter financial results on Wednesday. The Chinese electric vehicle ma...
September 8, 2022Read More >
- Trading
- Trading
- Trading
- Markets
- Markets
- Accounts
- Accounts
- Platforms & tools
- Platforms & tools
- Platforms
- Platforms
- Premium trading tools
- Premium trading tools
- Education
- Education
- Resources
- Resources
- Help & support
- Help & support
- About
- About
- Client support