- Accounts
- About
- Trading
- Platforms
- Tools
- News & education
- News & education
- News & analysis
- Education hub
- Economic calendar

News & Analysis
Share CFDs: Know the costs.
13 June 2019
Many traders have the prudent approach that treats trading as you would a business. A critical component of this is to have a thorough knowledge of your expenditure related to your trading activity.
With Share CFDs these are potentially fourfold namely:
a. Your cost of trading (e.g. brokerage)
b. Your cost of holding a position
c. The cost to enter a trade (your margin requirement)
d. Potential cost of the data feed (for non-traders)
Brokerage
Traditionally, uses a broker to trade shares incurs a fee for services of the placement and exit of a trade termed brokerage. This is usually organised as a minimum flat fee or a percentage of the trade entered, whichever is the higher figure.
The majority of Forex traders are used to not “officially” paying a brokerage. However, the bid/ask spread could be logically viewed as the cost of entry, as if you were to close a position immediately then you would be paying the difference between bid and ask prices. Hence, although with shares you are essentially in a loss situation at the start because of brokerage, with Forex you are also in a loss position at the start of a trade because of the spread.
With Share CFDs the brokerage applied to entry and exit is 0.08% of the overall position exposure or a fixed minimum charge of $10 whichever is the larger.
For example. if you had entered a position with exposure of $10000 then the brokerage cost of this trade would be 10,000 x 0.08% = $8 hence this would attract the minimum $10 brokerage.
Alternatively, if the position was exposure of $20,000 then the brokerage would be $16.
This will be considered in your profit/loss column on your platform.
Holding costs
As with Forex trading if you choose to trade longer timeframes involving holding a position overnight there is a debit or credit applied to your account for this. This charge is dependent on the direction of the trade (i.e. long or short) and the ‘swap rate’ applied to the position direction.
The value is calculated using a base rate of 2.5% and then:
a. If it is a long trade the interbank rate is added to this
b. If it is a short trade the short interbank rate is subtracted from this
Rather than having to find the interest rate and doing the calculation yourself, to make it easy for you, the swap rate can be found by right clicking on the CFD in the “market watch” box of your trading platform and subsequently clicking on “specifications”. Scrolling down the pop-up box will reveal the swap rates.
For example, on the day of writing this article the swap rates for BHP are as below:
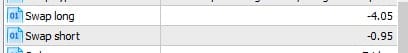
So, a long trade with $20,000 of exposure to BHP with a swap of -4.05 is charged as (20,000 x 4.2%)/360 = $2.25 per day.
Again, this daily holding charge (applied at 4.59pm US EST) will be visible on your trade box on your platform in the swap column and taken into account in your profit/loss column.
The cost to enter a trade (your margin requirement)
As with Forex, with CFDs you have the opportunity (as well as being aware of the risks) of using leverage to enter positions.
Unlike Forex there is not a set margin, so as with index CFDs, each equity CFD has its own set margin level. Again, these may be found in the ‘specifications’ box
For example, ANZ has a margin applied of 0.05 or 0.5%, whereas with BHP the margin applied is 0.075 or 7.5% (See below).
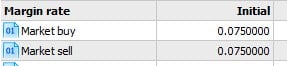
So as an example, If we take BHP at this margin rate and we open CFDs to the value of 10,000 the margin requirement on this position will be $750.
Potential cost of the data feed
Most global exchanges including the ASX charge for a data-feed of live prices and other trading information e.g. volume.
Often these are passed onto individual clients, however as part of the service we offer you will get this live feed at no subscription charge whilst you are actively trading.
Obviously some of the information described above may be new to you, so if you need clarity get in touch with us please and we will always be happy to help.
Disclaimer: Articles are from GO Markets analysts and contributors and are based on their independent analysis or personal experiences. Views, opinions or trading styles expressed are their own, and should not be taken as either representative of or shared by GO Markets. Advice, if any, is of a ‘general’ nature and not based on your personal objectives, financial situation or needs. Consider how appropriate the advice, if any, is to your objectives, financial situation and needs, before acting on the advice. If the advice relates to acquiring a particular financial product, you should obtain and consider the Product Disclosure Statement (PDS) and Financial Services Guide (FSG) for that product before making any decisions.
Next Article
Hong- Kong Protests Add to Market Angst
It is reported that nearly two million people joined the mass protest against the controversial extradition bill on Sunday despite the government announcing a pause in the legislation on Saturday. It is because the demonstrators do not only want the bill suspended but eliminated altogether as they fear that such law brings the territory closer ...
June 17, 2019
Read More >
Previous Article
Preview: The Bank of Canada Rate Decision
One of the must-watch economic events this week will be the Bank of Canada interest rate decision. The decision is scheduled to be announced on Wedn...
May 28, 2019
Read More >