- Trading
- Trading
- Markets
- Markets
- Accounts
- Accounts
- Platforms & tools
- Platforms & tools
- Platforms
- Platforms
- Premium trading tools
- Premium trading tools
- Education
- Education
- Resources
- Resources
- Help & support
- Help & support
- About
- About
- Client support
- Trading
- Trading
- Markets
- Markets
- Accounts
- Accounts
- Platforms & tools
- Platforms & tools
- Platforms
- Platforms
- Premium trading tools
- Premium trading tools
- Education
- Education
- Resources
- Resources
- Help & support
- Help & support
- About
- About
- Client support
- An upper band
- A lower band
- A 20-period simple moving average (SMA) in the middle.
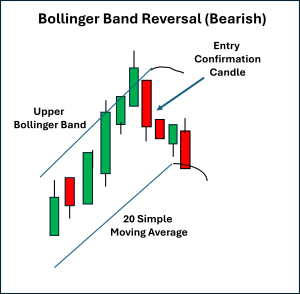
- A: Prior advance (bull candles) → strong upward momentum pushing price above the upper Bollinger Band.
- B: Over-extension → a candle closes outside the band, showing unsustainable momentum.
- C: Re-entry with confirmation → a subsequent bearish candle closes back inside the band, confirming the reversal.
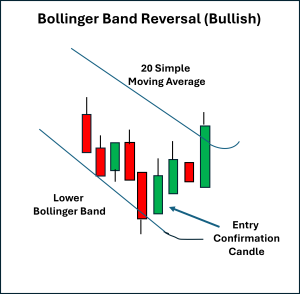
- A: Prior decline (bear candles) → strong downward momentum pushing price below the lower Bollinger Band.
- B: Over-extension → a candle closes outside the band, showing unsustainable downside pressure.
- C: Re-entry with confirmation → a subsequent bullish candle closes back inside the band, validating the reversal.
- In bearish setups: the stop goes above the high of the candle that closed outside the upper band.
- In bullish setups: the stop goes below the low of the candle that closed outside the lower band.
- Using the 20-period SMA (the “mean” in the mean reversion) as a potential profit target or signal to trail the initial stop level.
- Using a set risk-to-reward ratio, such as 2:1.
 News & Analysis
Bollinger Band Reversal – Trading Setups
12 September 2025What Is a Bollinger Band Reversal?
The Bollinger Band reversal is a mean-reversion strategy that looks for the price to temporarily overextend beyond its typical range before snapping back inside.
It consists of three lines:
The Upper band and Lower band are set at a default level two standard deviations from the SMA.
When the price closes outside one of the bands, it often signals significant price momentum.
This level of momentum is often followed by “move exhaustion” and subsequently pulls back to a more usual state.
If the next move returns price inside the bands, this may offer a possible reversal opportunity. This setup can happen on any timeframe on any asset.
As always with any chart pattern, the pattern can only be thought of as complete when there is a confirmation candle.
Confluence factors such as where the candle sits in relation to the range (e.g., in the top half for a bullish trade) and increased volume are often considered part of a complete trading plan in the Bollinger Band reversal setup.
Bearish Bollinger Band Reversal
A bearish reversal occurs when the price moves sharply above the upper band, showing extreme buying pressure, but then closes back inside the band.
This can suggest the price may have become overextended, and sellers are attempting to regain control.
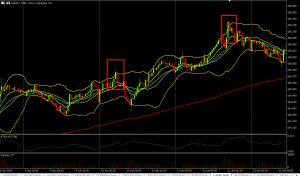
The EURJPY 30-minute chart below shows two examples of this setup in action:
Bullish Bollinger Band Reversal
A bullish reversal can be seen on a chart when the price falls below the lower band, showing extreme selling pressure, but then closes back inside the lower band.
This suggests that the downward trend in price is becoming exhausted, and buyers are stepping in.
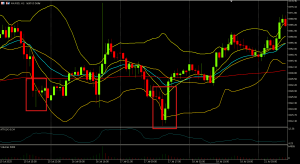
The Gold Futures CFD 1-hourly chart below shows two examples of this setup in action:
Stop Placement and Exits
Initial risk management stops are generally placed just beyond the candle that closed outside the band:
Exit strategies often include:
Final Thoughts
The Bollinger Band reversal is a popular mean reversion strategy that takes advantage of price extremes.
Traders who are developing a formal trading plan with this setup wait for a close outside the bands, a re-entry of price inside the bands (in the opposite direction), and a confirmation candle.
In essence, traders are attempting to capitalise on the pullback.
It is important to note that price can “walk the bands” for an extended time, so risk management with stop placements should be part of any plan using this setup.
Practicing across different market conditions, asset classes, and timeframes will help identify where Bollinger Band reversals are most effective and how best to integrate them into your trading toolbox.
Ready to start trading?
Disclaimer: Articles are from GO Markets analysts and contributors and are based on their independent analysis or personal experiences. Views, opinions or trading styles expressed are their own, and should not be taken as either representative of or shared by GO Markets. Advice, if any, is of a ‘general’ nature and not based on your personal objectives, financial situation or needs. Consider how appropriate the advice, if any, is to your objectives, financial situation and needs, before acting on the advice. If the advice relates to acquiring a particular financial product, you should obtain and consider the Product Disclosure Statement (PDS) and Financial Services Guide (FSG) for that product before making any decisions.
Next Article
Next Big Stock Splits: Top 5 Stocks Set to Split in 2025-2026
Last year was the year of the split. Tech titans like Nvidia, Broadcom, and MicroStrategy all executed 10-for-1 stock splits that sent retail investors (rightly or wrongly) into a buying frenzy. But despite multiple major stocks climbing to record-high levels this year — Netflix $1,200, Meta $760, and AutoZone $4,200 — we have yet to see a...
September 17, 2025Read More >Previous Article
The Outside Bar – Trading Setups
The outside bar is a powerful price action pattern that often signals a potential reversal. Unlike single-wick setups such as a pinbar strategy, ...
September 11, 2025Read More >
- Trading
- Trading
- Trading
- Markets
- Markets
- Accounts
- Accounts
- Platforms & tools
- Platforms & tools
- Platforms
- Platforms
- Premium trading tools
- Premium trading tools
- Education
- Education
- Resources
- Resources
- Help & support
- Help & support
- About
- About
- Client support