- Trading
- Trading
- Markets
- Markets
- Accounts
- Accounts
- Platforms & tools
- Platforms & tools
- Platforms
- Platforms
- Premium trading tools
- Premium trading tools
- Education
- Education
- Resources
- Resources
- Help & support
- Help & support
- About
- About
- Client support
- Trading
- Trading
- Markets
- Markets
- Accounts
- Accounts
- Platforms & tools
- Platforms & tools
- Platforms
- Platforms
- Premium trading tools
- Premium trading tools
- Education
- Education
- Resources
- Resources
- Help & support
- Help & support
- About
- About
- Client support
- Markets often create the illusion of a breakout at key support or resistance levels.
- A significant number of these breakouts lack conviction, trapping breakout traders before reversing sharply back into the prior range.
- A: Break → price pushes above resistance, suggesting strong buyer control.
- B: Retest → price pulls back to the breakout level, holding temporarily as support.
- C: Fail / Fake-out → the retest is rejected and a bearish candle close occurs beneath the original breakout level or breakout candle low, signalling buyers have lost conviction and sellers are regaining control.
- A: Break → price falls through support, suggesting strong seller conviction.
- B: Retest → price rallies back to the breakout level, holding temporarily as resistance.
- C: Fail / Fake-out → the retest is rejected and a bullish candle close occurs above the original breakout level or the breakout candle high, signalling sellers have lost conviction in the breakout, and buyers are regaining control.
- For bearish setups, stops are commonly placed just above the retest wick or above the breakout candle high.
- For bullish setups, stops are typically set just below the retest wick or the breakout candle low.
- Using fixed risk-to-reward targets, often 2:1 or better.
- Profit targets can be set near the opposite side of the range or the next key support/resistance level.
- Employing trailing stops (e.g., ATR levels) to capture extended reversals after strong fake-outs.
 News & Analysis
The Fake-out Reversal – Trading Setups
2 October 2025What Is a Fake-out Reversal?
The “Fake-out Reversal” is a common price action setup that is based on two important price action principles:
Some traders consider entry on the initial retest after the breakout, but (arguably) the higher probability setup is with confirmation that the breakout has failed.
Typically, this is confirmed when price closes back through the breakout level and invalidates the initial breakout candle.
Psychologically, this reflects the point where breakout traders are trapped, forced to exit, while contrarian traders seize the opportunity.The failed breakout acts as a battleground of conviction — and once the breakout direction is rejected, momentum often flips strongly in the opposite direction.
Bearish Fake-out Reversal
A bearish Fake-out Reversal setup occurs when resistance appears to have broken to the upside, only for the price to fail and reverse lower back into the range.
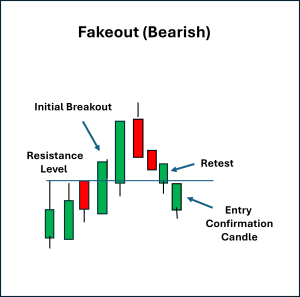
This sequence reflects the inability of buyers to sustain price above resistance, while sellers use the failure to drive price lower.
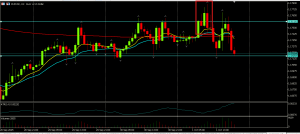
You can see a real chart example of this on the 1-hour EURUSD, where resistance was briefly breached, retested, and then price reversed sharply back below the level.
Bullish Fake-out Reversal
A bullish setup occurs when support appears to have broken to the downside, only for price to fail and reverse higher back into the range.
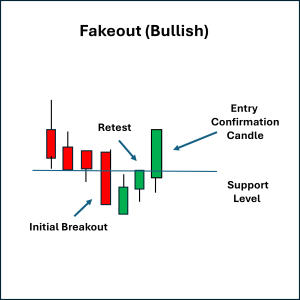
This sequence reflects sellers’ inability to keep price beneath support, and buyers use the breakout failure to force a reversal higher.
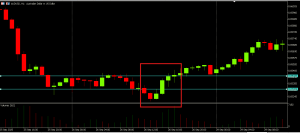
You can see a real chart example of this on the hourly AUDUSD chart, where a false breakdown beneath support was reversed by strong bullish candles reclaiming the level.
Stop Placement and Exits
Risk management for the Fake-out Reversal often focuses on the failed breakout zone itself:
Profit-taking exit approaches can include:
Final Thoughts
The Fake-out Reversal combines the illusion of a breakout with the confirmation of failure, allowing traders to capture momentum when trapped participants may choose to exit.
Structured stop placement at the failed breakout zone and clear profit targets at opposing levels are logical exits to consider.
The psychology is rooted in market participants’ vulnerability — breakout traders caught on the wrong side are forced to close, enabling an increase in momentum in the reversal direction.
As always, confluence factors such as volume spikes, higher timeframe trend alignment, and time-of-day/session context can add confidence in the likelihood of a reversal.
Review your own charts across multiple timeframes and assets for examples of false breaks. Marking these and watching how often they lead to strong reversals could provide clues as to what to include as trading plan criteria.
Ready to start trading?
Disclaimer: Articles are from GO Markets analysts and contributors and are based on their independent analysis or personal experiences. Views, opinions or trading styles expressed are their own, and should not be taken as either representative of or shared by GO Markets. Advice, if any, is of a ‘general’ nature and not based on your personal objectives, financial situation or needs. Consider how appropriate the advice, if any, is to your objectives, financial situation and needs, before acting on the advice. If the advice relates to acquiring a particular financial product, you should obtain and consider the Product Disclosure Statement (PDS) and Financial Services Guide (FSG) for that product before making any decisions.
Previous Article
Harnessing the Global Market Pulse in Your Trading
Forex, index and commodity CFD markets are technically open 24 hours a day, but in terms of market action, not all hours are the same. We can see...
September 29, 2025Read More >
- Trading
- Trading
- Trading
- Markets
- Markets
- Accounts
- Accounts
- Platforms & tools
- Platforms & tools
- Platforms
- Platforms
- Premium trading tools
- Premium trading tools
- Education
- Education
- Resources
- Resources
- Help & support
- Help & support
- About
- About
- Client support