- Trading
- Trading
- Markets
- Markets
- Accounts
- Accounts
- Platforms & tools
- Platforms & tools
- Platforms
- Platforms
- Premium trading tools
- Premium trading tools
- Education
- Education
- Resources
- Resources
- Help & support
- Help & support
- About
- About
- Client support
- Trading
- Trading
- Markets
- Markets
- Accounts
- Accounts
- Platforms & tools
- Platforms & tools
- Platforms
- Platforms
- Premium trading tools
- Premium trading tools
- Education
- Education
- Resources
- Resources
- Help & support
- Help & support
- About
- About
- Client support
 News & Analysis
Adding the RSI to your entry or exit decision-making
27 April 2020The Relative Strength Index (RSI) is an oscillator type of indicator, designed to illustrate the momentum related to a price movement of a currency pair or CFD.
In this brief article we aim to outline what this indictor may tell you about market sentiment, and along with other indicators assist in your decision-making.
As with most oscillator type of indicator, the RSI can move between two key points (0-100).
The major aim of the RSI is to gauge whether a particular asset, in our context a forex pair or CFD, is overbought or oversold, and the associated key levels are below 30 (when it is classed as “Oversold”) and above 70 (where it is classed as “overbought”).To bring up an RSI chart on your MT4/5 platform it is simply a case of finding the RSI in your list of indicators in the Navigation box and clicking and dragging it into your chart area.
The diagram below illustrates this on a 30-minute chart.
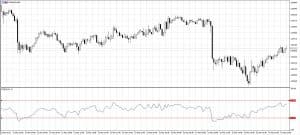
It is generally thought that if the RSI moves into either of these two zones then a change may be imminent.
Most commonly the RSI may be used as part of entry decision making. Traders may use this as an additional tick (when other indicators suggest entry) to make sure they do not enter a long trade on an overbought currency pair, or short trade on an oversold currency pair.
Therefore, when articulating this in your trading plan it may read something like the following:
a. I will refrain from entry into a long trade if the RSI has moved above 70 on the last trading bar.
b. I will refrain from entry into a short trade if the RSI has moved below 30 on the last trading bar.Less frequently but logically, if one accepts this premise that a move into either of the previous described zones then a trend change may be imminent. It could also be used as a “warning” to potentially exit from an open trade. Traders who wish to explore this in their own trading could:
a. Tighten a trail stop to within a specified number of pips from current price e.g., 10 Pips. or
b. Exit the trade entirely.Of course, in either case and with any indicators we discuss, back-testing it with previous trades to ascertain any change in outcomes can be performed to justify a prospective test. Finally, after gathering a critical mass of trade examples exploring if this would make a difference, this could provide the evidence to suggest whether you should (or should not if there is no difference) formally add to your trading plan.
For a live look at how indictors may be used in the reality of trading decision making, why not join our “Inner Circle” group with regular weekly webinars on a range of topic including that of indicators. It would be great to have you as part of the group. CLICK HERE to enroll for the next inner circle session.
This article is written by an external Analyst and is based on his independent analysis. He remains fully responsible for the views expressed as well as any remaining error or omissions. Trading Forex and Derivatives carries a high level of risk.
Ready to start trading?
Disclaimer: Articles are from GO Markets analysts and contributors and are based on their independent analysis or personal experiences. Views, opinions or trading styles expressed are their own, and should not be taken as either representative of or shared by GO Markets. Advice, if any, is of a ‘general’ nature and not based on your personal objectives, financial situation or needs. Consider how appropriate the advice, if any, is to your objectives, financial situation and needs, before acting on the advice. If the advice relates to acquiring a particular financial product, you should obtain and consider the Product Disclosure Statement (PDS) and Financial Services Guide (FSG) for that product before making any decisions.
Next Article
Apple Inc. and Amazon.com, Inc
Apple Inc. and Amazon.com, Inc The last two of the five most prominent technology companies, Apple Inc. (AAPL) and Amazon (AMZN), which form part of the FAANG group, have reported interesting quarterly earnings and highlighted their actions during this unprecedented uncertainty. Apple Inc. The company missed on earnings estimates but reported b...
May 1, 2020Read More >Previous Article
FX Trading choices: Open positions and economic data release
Market sentiment towards a currency pair, and hence price, changes when new information comes into the market. The most common situation that creat...
April 24, 2020Read More >
- Trading
- Trading
- Trading
- Markets
- Markets
- Accounts
- Accounts
- Platforms & tools
- Platforms & tools
- Platforms
- Platforms
- Premium trading tools
- Premium trading tools
- Education
- Education
- Resources
- Resources
- Help & support
- Help & support
- About
- About
- Client support