- Trading
- Trading
- Markets
- Markets
- Accounts
- Accounts
- Platforms & tools
- Platforms & tools
- Platforms
- Platforms
- Premium trading tools
- Premium trading tools
- Education
- Education
- Resources
- Resources
- Help & support
- Help & support
- About
- About
- Client support
- Trading
- Trading
- Markets
- Markets
- Accounts
- Accounts
- Platforms & tools
- Platforms & tools
- Platforms
- Platforms
- Premium trading tools
- Premium trading tools
- Education
- Education
- Resources
- Resources
- Help & support
- Help & support
- About
- About
- Client support
- Which MA Type?: We’ve already discussed the major differences between Simple and Exponential Moving Averages. Many traders, particularly those trading shorter timeframes, tend to prefer the EMA due to its greater responsiveness to trend changes. However, just because a particular approach is right for many doesn’t mean it can’t be different for you.
- Which Period MA?: This is probably the most debated consideration. A longer EMA, e.g., 20 instead of 10, will require a more significant price drop to trigger, meaning you may give more back to the market if the drop continues. However, this must be balanced against the possibility that any uptrend may pause and even retrace for a period before resuming its climb.
- MA Touch or Close?: Another key debate is whether a trail stop using a moving average should be triggered by any touch of that moving average at any time, or whether to wait for a close price through the MA. Both approaches have pros and cons, which need to be weighed carefully.
- Simple Moving Average (SMA) Strategy: Utilizing a 50-day SMA as a trail stop could be effective for longer-term trades. If the price drops below the 50-day SMA, you could trigger a sell order.
- Exponential Moving Average (EMA) Strategy: For more sensitive, shorter-term trading, a 20-day EMA could be used as a trail stop. The EMA gives more weight to recent prices and thus responds more quickly to price changes.
- Price Percentage and MA Combination: You could set a rule where the trail stop triggers if the price drops a certain percentage below the moving average. For example, if the 50-day
 News & Analysis
Setting Smart Stops: An In-Depth Look at Moving Averages as Trail Stops
2 October 2021Definition of Moving Average
In trading, moving averages are often used to smooth out price data to generate trend-following indicators. The most commonly used types are the Simple Moving Average (SMA) and the Exponential Moving Average (EMA).
A Simple Moving Average is calculated by defining a period, e.g., 10—or, in other words, the last 10 candles—adding these last 10 close prices, and then dividing by 10. This is recalculated every time a candle closes and may be plotted as a single line on a price chart.
An Exponential Moving Average is often preferred by many traders because it gives more weight to recent prices and appears to be more responsive to price changes than the Simple Moving Average.
Ways to Use Moving Averages in Trading Decisions – An Overview
Although, like most indicators on a trading platform, a moving average is ‘lagging’ in terms of the information it provides, its ability to indicate trend direction and changes makes it popular. For entry points, traders often use two different moving averages, such as a 10 and 20 EMA on a chart. When these crossover so that the 10 is higher than the 20, for example, it may be indicative of a new uptrend (and vice versa for a potential downtrend).
Larger moving averages, like the 200 and 50, are commonly observed, particularly when these cross. For instance, the 50 crossing below the 200 is termed the “death cross” and could indicate a long-term uptrend changing to a downtrend.
For exit strategies, rather than waiting for a moving average cross, a more timely exit signal might be a cross between price and a moving average. This is the major focus of this article, and we will discuss this approach along with a few considerations.
Using Price and Moving Average as a Trail Stop
So let us first clarify what we mean by a trail stop or trailing stop.
Traditionally, a trail stop is a type of stop-loss order that moves with the market price as a trade progresses in your desired direction. For example, if you buy a stock at $100 with an initial stop of $90 and the price moves up to $110, you may “trail” your initial stop from $90 up to $102. This means that if the trade turns around and moves back down to $102, triggering your trail stop, you would still make a minimum profit of $2 per share, even if the price continues to drop back to $90. If the price doesn’t drop but continues to rise, you can move your trail stop higher, for example, to $115, then $120, and so on, until the price eventually falls and triggers an exit.
In simple terms, a trail stop locks in profit and manages the risk of giving all potential profit back to the market as the price moves in your desired direction.
Many approaches systematize the use of a trail stop as part of a trading plan, rather than simply using an arbitrary price. One of these approaches is to use a moving average as a trail stop, which we will now discuss in more detail.
Moving Average as a Trail Stop
Using a moving average as a trail stop means that instead of setting your stop-loss at a fixed dollar amount below the market price, you set it at the level of a particular moving average. As the moving average changes, your trail stop will move with it.
For example, consider the chart below where we have entered a short gold trade on an hourly timeframe at point “A,” anticipating a potential trend reversal. The yellow line on the chart is a 10EMA. The price moves in our desired direction and closes above our yellow line (or the 10 EMA) at point “B,” locking in a good profit for this trade.
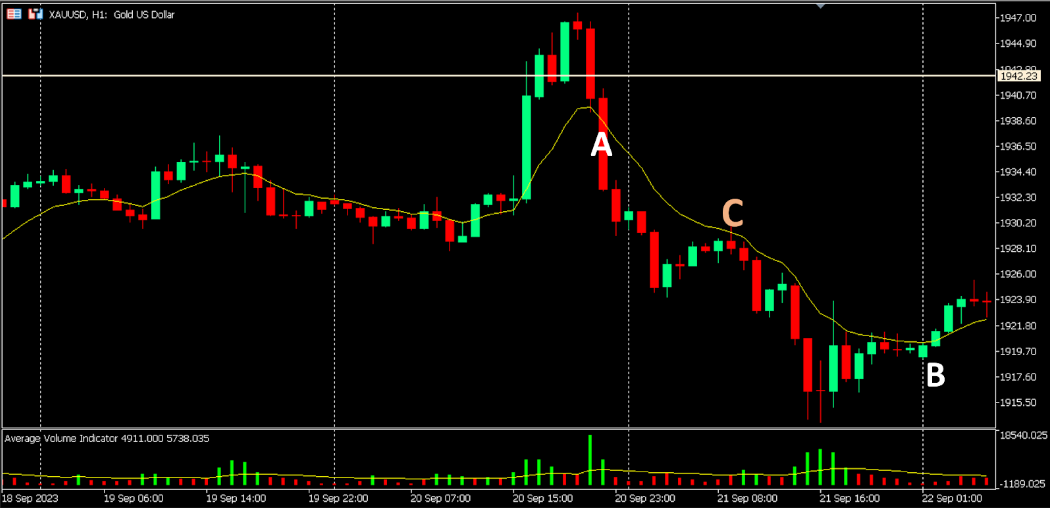
As you can also see, a candle’s price crossed temporarily over the 10EMA at point “C” but closed below it. This is an important consideration that we will touch upon later.
Considerations for Traders
There are several factors to consider when deciding which approach suits your individual trading style, and these should be tested to find the optimal strategy for you.
In Summary
There’s no doubt that the concept of using a trail stop merits exploration for any trader. Price/MA cross is a relatively easy concept to understand and implement and can improve trading outcomes irrespective of the “fine-tuning” considerations discussed. Your challenge is clear: thorough, ongoing testing is essential to refine your choice and find the optimal method for you.
Strategies
Ready to start trading?
Disclaimer: Articles are from GO Markets analysts and contributors and are based on their independent analysis or personal experiences. Views, opinions or trading styles expressed are their own, and should not be taken as either representative of or shared by GO Markets. Advice, if any, is of a ‘general’ nature and not based on your personal objectives, financial situation or needs. Consider how appropriate the advice, if any, is to your objectives, financial situation and needs, before acting on the advice. If the advice relates to acquiring a particular financial product, you should obtain and consider the Product Disclosure Statement (PDS) and Financial Services Guide (FSG) for that product before making any decisions.
Next Article
NIO and Shell announce an agreement
Last week, NIO announced that they have entered into a strategic agreement with Shell, the largest gasoline retailer in the world. The latest move is a boost for NIO to further establish themselves in the electric vehicle industry. The agreement includes plans to construct and operate battery charging and swapping facilities in China and Europe....
December 1, 2021Read More >Previous Article
The VIX Explained: What Every Trader Needs to Know
Introduction The VIX Index, or Volatility Index, often referred to as the "fear gauge," measures expected future volatility in the U.S. stock market....
October 2, 2021Read More >
- Trading
- Trading
- Trading
- Markets
- Markets
- Products overview
- Forex
- Commodities
- Metals
- Indices
- Shares
- Cryptocurrencies
- Treasuries
- ETFs
- Accounts
- Accounts
- Compare our accounts
- Our spreads
- Funding & withdrawals
- Volume rebates
- Open account
- Try free demo
- Platforms & tools
- Platforms & tools
- Platforms
- Platforms
- Platforms overview
- TradingView
- MetaTrader 4
- MetaTrader 5
- MetaTrader Copy Trading
- cTrader
- cTrader copy trading
- Mobile trading platforms
- GO WebTrader
- PAMM
- Premium trading tools
- Premium trading tools
- Tools overview
- VPS
- Genesis
- Education
- Education
- Resources
- Resources
- News & analysis
- Education hub
- Economic calendar
- Earnings announcements
- Help & support
- Help & support
- About
- About
- About GO Markets
- Our awards
- Sponsorships
- Client support