Market Character is the big sister of Market Structure. While Market Structure can show the framework of price highs and lows, Market Character reveals the behaviour of price moves in greater detail.Market character takes into account the speed of price movement, changing volatility, and the level of conviction behind the move.The combination of Break of Market Structure (BOS) and Change in Market Character (CIMC) can form a powerful duo for reading price action with greater clarity and understanding.
What is Market Character?
If market structure is about the price map over a period of time — indicating the formation of highs, lows, and swings — then market character is about the personality of price movement during the life of such a trend.Two markets can look similar in structure but may have behaved very differently over the same time period.One may have trended relatively smoothly with measured impulses to the upside and shallow retracements in price before trend continuation, whereas the other may be choppier in nature, hesitating regularly, with more frequent false breaks. This 'how it moves' is what we mean by character.Key aspects of market character include:
Momentum: Are moves strong and one-sided, or hesitant?
Volatility: Are price ranges expanding or compressing?
Reaction to levels: Do support and resistance break cleanly or have frequent and prolonged pauses?
Consistency: Are breakouts following through or reversing and forming a series of false breakouts?
Session tone: Are there relationships associated with different times of the trading day consistent with new session times? e.g., start of European or US sessions.
BOS and CIMC in Tandem
Break of Market Structure (BOS) occurs when the old pattern of swings is violated. For example, when an uptrend shows its first lower low. Change in Market Character (CIMC) is the confirmation that the way the market moves has shifted. For example, momentum may slow, volatility may show changes, or support/resistance breaches may be more/ less compelling in nature. A BOS without a change in character is often a false alarm. Whereas a BOS followed by a CIMC is a much stronger sign of a genuine shift.
Momentum Shifts
In a strong uptrend, price rallies are invariably strong, and pullbacks or price retracements are shallow. If rallies start weakening while retracements deepen or show a weaker recovery, momentum may be fading.Why it matters: Weakening momentum makes trend continuation less reliable.How to confirm: A flattening moving average slope or MACD histograms decreasing in size or signal line crosses over the histogram level (when in a long trade and vice versa for short), suggests that momentum is running out.
Volatility Regime Change
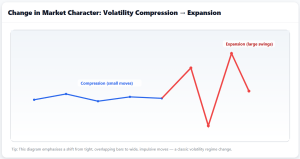
Markets alternate between calm, controlled moves and fast, wide swings. A sudden shift is a character change.Why it matters: Stop placement and expectations must adapt to the current market normal; otherwise, trades may be prematurely closed due to increased market noise.How to confirm: ATR rising shows volatility expansion; ATR falling shows compression. Using an ATR multiple for stop placement accounts for this volatility change. Bollinger Bands placed on your chart may offer another visual cue as the bands show narrowing or widening as volatility changes.
Reaction to Key Levels
Markets that have previously rewarded breakout trades may start to reject new breakouts and snap back into a previous price range. They will then limp through the level (often with reduced volume), suggesting buying or selling pressure may not have the required levels to produce a sustained move. How to confirm: The number one sign of rejection is if a candle closes back in range (even if earlier in the candle showed potential promise). Volume is also a strong indicator. If volume is lacking or price fails to follow through on a single slightly higher volume bar, then character may have shifted.
Liquidity and Session Tone
Markets behave differently at different times of day. A shift aligned with session opening times is often a change in character as new information comes around these times, and a different set of traders enter the market.Why it matters: The 'best time to trade' may change depending on the instruments and timeframe(s) you are trading, How to confirm: Session indicators or volume profiles can highlight which hours show the strongest moves. Measuring relative volume may be worth exploring, i.e., comparing the current volume with the standard profile for that day and time.
Final Thoughts
A Break of Market Structure (BOS) is your early warning that the pricing story may be changing. A Change in Market Character (CIMC) is confirmation that the behaviour has shifted, and a new set of opportunities could be developing.Using both together can give clear clues as to whether those potential opportunities add weight to your thinking or are worth trading.
By
Mike Smith
Mike Smith (MSc, PGdipEd)
Client Education and Training
The information provided is of general nature only and does not take into account your personal objectives, financial situations or needs. Before acting on any information provided, you should consider whether the information is suitable for you and your personal circumstances and if necessary, seek appropriate professional advice. All opinions, conclusions, forecasts or recommendations are reasonably held at the time of compilation but are subject to change without notice. Past performance is not an indication of future performance. Go Markets Pty Ltd, ABN 85 081 864 039, AFSL 254963 is a CFD issuer, and trading carries significant risks and is not suitable for everyone. You do not own or have any interest in the rights to the underlying assets. You should consider the appropriateness by reviewing our TMD, FSG, PDS and other CFD legal documents to ensure you understand the risks before you invest in CFDs. These documents are available here. Any references to Australian or international shares, sectors, indices, ETFs, crypto-related stocks or other instruments are provided for market commentary and watchlist purposes only and do not constitute a recommendation, offer or solicitation to buy, sell or hold any financial product or adopt any investment strategy. International markets may involve additional risks, including currency fluctuations, regulatory differences, market structure differences, reduced liquidity and higher volatility. Company-specific, sector-specific and macroeconomic risks may also affect performance.
Commentary on geopolitical developments, economic data, central bank decisions, earnings, policy changes and other global or financial market events is based on information available at the time of publication and may change without notice. Such events can lead to sudden market moves, price gaps, reduced liquidity, wider spreads and increased volatility, particularly in leveraged products such as CFDs. Forward-looking statements, expectations and scenario analysis are inherently uncertain and should not be relied on as guarantees of future market behaviour or outcomes.

Every time markets get jumpy, a three-letter acronym starts showing up in headlines and trading rooms. The VIX. You will see it called the fear gauge, the fear index, or just "vol." For newer traders, it can feel like an insider's number that everyone seems to track but few stop to explain.
For US retailers and consumer brands, the first hit is usually margin. Import costs rise before pricing power does. Companies can try to pass those costs on, but customers may resist higher prices, especially if household budgets are already stretched. Existing inventory can also soften the first blow, which means the initial earnings result may look manageable while the next one carries the real pressure.
Tariffs, earnings and the Asia versus US split | GO Markets
Same tariff. Different earnings hit.
That is the key split for traders watching this earnings season. The US side is mainly about margin timing. The Asia side is about demand sensitivity. Not every export sector carries the same level of US demand risk.
TL;DR
US companies may face margin pressure as tariffed inventory moves through earnings.
Asian exporters may face volume pressure if US buyers reduce orders.
The timing is different: US retailers may feel the impact later, while Asian exporters may see it earlier through weaker order books.
Textiles, apparel and basic consumer goods are likely more sensitive to US demand.
Semiconductors and AI hardware may be less directly exposed to US consumers, but still carry policy, capex and valuation risk.
The big picture
Tariffs are paid at the US border by importers. From there, the cost can move through the system in several ways: higher prices, weaker margins, lower supplier prices, lower demand or a mix of all four.
Research cited by the Kiel Institute and New York Fed suggests US buyers and businesses may be absorbing a significant share of the tariff burden. That matters because it changes where the earnings pressure shows up first.
For a US retailer, the problem is straightforward but uncomfortable. If the company raises prices, demand may weaken. If it absorbs the tariff cost, margins may compress. If it still has older inventory, the hit may not show up immediately.
For an Asian exporter, the pressure can arrive through a different channel. If US buyers become cautious, they may order less. The exporter may keep prices relatively stable, but factory utilisation falls, fixed costs are spread across fewer units and earnings pressure builds.
That is why this is not just a tariff story. It is an earnings timing story.
US companies: the margin problem
The US side of the tariff story is about cost absorption.
Retailers, apparel brands, consumer electronics sellers and appliance companies often rely on imported goods, components or packaging. When tariff costs rise, they may try to protect margins through price increases, supplier negotiations, sourcing changes or inventory management.
The challenge is that none of these are clean solutions.
Price increases can test consumer demand. Supplier negotiations may take time. Sourcing changes can be expensive or slow. Inventory timing can make the first result look better than the underlying cost trend.
This is why earnings calls matter. Management commentary around pricing actions, tariff mitigation, sourcing, vendor negotiations and inventory timing may reveal more than headline sales growth.
What to watch on the US side
These signals may provide useful context in upcoming earnings reports:
If margins hold while sales remain stable, companies may be managing the pressure. If sales rise but margins fall, tariff costs may not be passing through cleanly. If guidance becomes more cautious, the market may start pricing a delayed earnings impact.
Asian exporters: the volume problem
The Asia side is not always about exporters cutting prices.
In many categories, Asian suppliers operate in competitive global markets with limited pricing power. If US buyers reduce orders, exporters may feel the impact through lower volumes rather than lower unit prices.
That distinction matters.
A company can report stable prices and still face earnings pressure if factories are running below normal utilisation. Lower volumes can reduce operating leverage, delay capital expenditure and weaken guidance.
The highest-risk sectors are usually those most closely tied to US retail demand, seasonal buying cycles and low-margin production.
Which Asian sectors are most exposed?
1. Textiles and apparel +
Highest Sensitivity
Textiles and apparel are among the clearest examples of US demand exposure.
These exporters are often tied directly to US retail orders, private-label contracts and seasonal buying cycles. If US retailers turn cautious, orders can be delayed, reduced or cancelled relatively quickly.
Risk is higher because margins are often thin, production is labour-intensive and buyers may have more power in negotiations.
Relevant export markets: Vietnam, Bangladesh, India, Indonesia and parts of China.
2. Basic consumer goods +
High Sensitivity
This includes toys, household goods, furniture, simple appliances and other discretionary or semi-discretionary exports.
These categories are exposed when US retailers reduce inventory or when consumers pull back from non-essential spending. Tariffs can add pressure if buyers try to push costs back onto suppliers.
Relevant export markets: China, Vietnam, Thailand, Malaysia and Indonesia.
3. Electronics assembly +
Medium to High Sensitivity
Electronics assembly is more mixed.
Lower-end consumer electronics can be sensitive to US household demand. Higher-value components or enterprise-linked electronics may be more resilient, depending on end-market exposure.
This sector can also be harder to read because supply chains are complex. A company may look like a technology exporter, but its actual earnings sensitivity may still depend on US consumer replacement cycles.
Relevant export markets: China, Vietnam, Malaysia, Thailand, Taiwan and the Philippines.
4. Machinery and industrial goods +
Medium Sensitivity
Machinery is less directly tied to US consumer demand than apparel or household goods. The risk is more about business investment.
If US companies delay capital expenditure because tariff uncertainty rises, machinery orders may weaken. However, order books can provide some buffer, and specialised products may have more pricing power.
Relevant export markets: Japan, South Korea, China, Taiwan and Singapore.
5. Semiconductors +
Lower Direct Sensitivity
Semiconductors are less directly exposed to US retail demand than textiles or consumer goods. Demand is often tied to broader technology cycles, autos, industrials, cloud infrastructure and AI investment.
That does not make the sector risk-free. Tariffs, export controls, geopolitics and a weaker global capex cycle can still affect earnings expectations.
Relevant export markets: Taiwan, South Korea, Malaysia, Singapore and parts of China.
6. AI hardware and data-centre supply chains +
Lowest Direct Sensitivity
AI hardware is more tied to cloud capital expenditure and data-centre buildouts than day-to-day consumer spending.
The risk is different. It is less about US shoppers buying fewer goods and more about whether AI capex expectations remain realistic, whether policy restrictions expand and whether valuations already price in strong growth.
Relevant export markets: Taiwan, South Korea, Malaysia and advanced electronics supply-chain hubs.
A simple sector risk map
Sensitivity Analysis
Indicative Asian exporter sensitivity to US consumer demand
Note: This is a general framework only. Sensitivity may vary by company, customer mix, contract structure and end market exposure.
Why timing matters
The US and Asia timelines may not line up.
A US retailer may still be selling older inventory, so the tariff impact can be delayed. Margins may hold in one quarter, then weaken as new tariffed inventory becomes a larger share of the sales mix.
An Asian exporter may see the pressure earlier if US buyers reduce orders before the cost hit appears in US consumer prices.
That creates a split earnings map:
US side: delayed margin pressure.
Asia side: earlier volume pressure.
Policy side: tariff exemptions, pauses or escalations can change the setup quickly.
The mistake is assuming a clean and immediate tariff impact. A strong US retailer result does not automatically mean tariff pressure is gone. It may only mean older inventory is still flowing through. A stable Asian exporter margin does not automatically mean demand is healthy. Volumes may be weakening beneath the surface.
The trap in the earnings season
What to watch next
On the US side, gross margins, inventory commentary, same-store sales and second-half guidance may provide useful context.
On the Asia side, export volumes, factory utilisation, order backlogs, working capital and capital expenditure guidance may be more relevant.
Across both regions, tariff policy remains the swing factor. Exemptions, pauses or new restrictions could quickly change market expectations.
Sector charts may provide additional context on whether market pricing is aligning with the earnings narrative, but they should be read alongside company commentary and macro data from the economic calendar.
FAQ
Frequently asked questions
How do tariffs affect US companies and Asian exporters differently? +
Tariffs may affect US companies through margin pressure and Asian exporters through volume pressure. US companies may face higher import costs, while Asian exporters may face fewer orders from US buyers.
Which Asian export sectors are most exposed to US demand? +
Textiles, apparel and basic consumer goods are generally more exposed to US demand because they are closely tied to retail orders and consumer spending. Electronics assembly and machinery are moderately exposed, while semiconductors and AI hardware may be less directly exposed.
Why can tariff impacts show up later in retailer earnings? +
Retailers may still be selling older inventory purchased before tariffs applied. The impact may become more visible later as new tariffed inventory moves through sales and margins.
What should investors watch in tariff-related earnings reports? +
General signals include gross margins, inventory commentary, same-store sales, export volumes, factory utilisation, order backlogs and management commentary on pricing or sourcing.
Are semiconductors and AI hardware exposed to tariffs? +
They may be less directly exposed to US consumer demand, but they can still be affected by policy restrictions, export controls, global capex cycles and valuation expectations.
Bottom Line
The tariff story is no longer only about who pays. It is about where the earnings pressure shows up first.