- CFD Trading
- CFD Trading
- CFD Markets
- CFD Markets
- Accounts
- Accounts
- Platforms & tools
- Platforms & tools
- Platforms
- Platforms
- Premium trading tools
- Premium trading tools
- Education
- Education
- Resources
- Resources
- Help & support
- Help & support
- About
- About
- Client support
- CFD Trading
- CFD Trading
- CFD Markets
- CFD Markets
- Accounts
- Accounts
- Platforms & tools
- Platforms & tools
- Platforms
- Platforms
- Premium trading tools
- Premium trading tools
- Education
- Education
- Resources
- Resources
- Help & support
- Help & support
- About
- About
- Client support
 News & analysis
Is the current Ethereum momentum real?
24 January 2023Ethereum and its big brother Bitcoin, have seen one of their most momentous moves since their peaks in November 2021. Various sector wide catalysts worked to move the price down including the collapse of Celsius and FTX which caused shockwaves to the cryptocurrency community. Inflationary pressures also left growth assets reeling in losses, leaving Ethereum beaten down over the last 12 months. However, there are some signs that it might be starting to turn. From a broader economic perspective there is hope that the Federal Reserve will pivot from its aggressive rate hiking policy to avoid a potential recession which has led to a recent revival of growth assets including cryptocurrency.
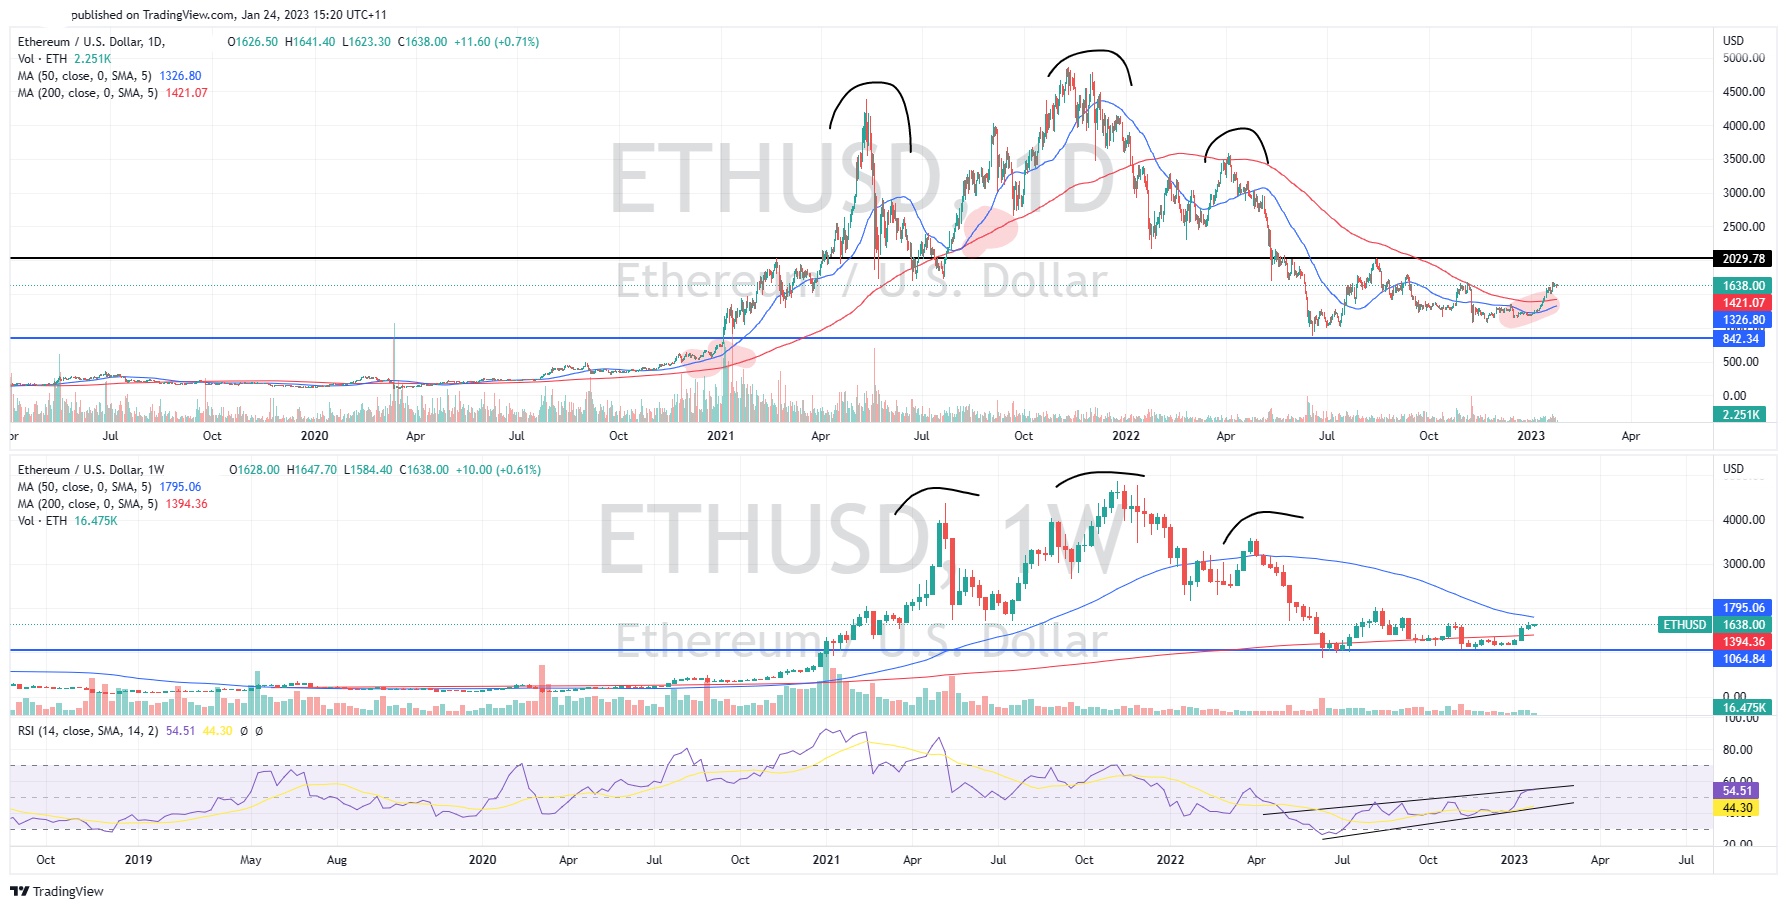
From a technical perspective the weekly price chart shows a clear head and shoulders pattern that has played out. The question is whether sell down has finished or if there is further misery to come. The price has seen its range become tighter as it has struggled to break below the key support at $1050. This area also acts as the 200-week moving average adding to its supply. The volume and volatility have also been reducing as the price has approached this level. The RSI is showing an interesting signal. The RSI has begun trending up which is diverging with the actual price action. This may indicate that the price is ready to move to the upside in the short term. The 50-week moving average is plateauing indicating that the price is facing some strong support.
On the daily chart, the price looks to be coiling with both the 50 day and 200 day moving averages trending up for the first time since before the price peaked in 2021. Furthermore, it is possible that the 50-day moving average will cross through the 200-day moving average which is very bullish move. The price has also broken above both daily moving averages and may be looking to test the next resistance at $2030. This is also roughly the same price of the neckline of the underlying head and shoulders pattern. Therefore, a target of $2030 is a reasonable for a short-term long trade/
Ultimately, the price of Ethereum looks like it may be ready to reverse however, it is still at the mercy of the broader Cryptocurrency sector news and macroeconomic catalysts.
Ready to start trading?
The information provided is of general nature only and does not take into account your personal objectives, financial situations or needs. Before acting on any information provided, you should consider whether the information is suitable for you and your personal circumstances and if necessary, seek appropriate professional advice. All opinions, conclusions, forecasts or recommendations are reasonably held at the time of compilation but are subject to change without notice. Past performance is not an indication of future performance. Go Markets Pty Ltd, ABN 85 081 864 039, AFSL 254963 is a CFD issuer, and trading carries significant risks and is not suitable for everyone. You do not own or have any interest in the rights to the underlying assets. You should consider the appropriateness by reviewing our TMD, FSG, PDS and other CFD legal documents to ensure you understand the risks before you invest in CFDs. These documents are available here.
Next Article
Microsoft results announced – the stock jumps in the after-hours
Microsoft Corporation (NASDAQ: MSFT) reported the latest financial results on Wall Street after the market close on Tuesday. Let’s take a closer look at the results. The US technology giant reported revenue of $52.747 billion for quarter ending on December 31, 2022 (up by 2% year-over-year), narrowly falling short of $52.987 billion revenue ex...
January 25, 2023Read More >Previous Article
How to optimise your dividends and maximise your returns?
What is a dividend? A dividend is a payment made by a company to its shareholders to give back some of its profits or return. Dividends a...
January 20, 2023Read More >
- CFD Trading
- CFD Trading
- CFD Trading
- CFD Markets
- CFD Markets
- Accounts
- Accounts
- Platforms & tools
- Platforms & tools
- Platforms
- Platforms
- Premium trading tools
- Premium trading tools
- Education
- Education
- Resources
- Resources
- Help & support
- Help & support
- About
- About
- Client support