- CFD Trading
- CFD Trading
- CFD Markets
- CFD Markets
- Accounts
- Accounts
- Platforms & tools
- Platforms & tools
- Platforms
- Platforms
- Premium trading tools
- Premium trading tools
- Education
- Education
- Resources
- Resources
- Help & support
- Help & support
- About
- About
- Client support
- CFD Trading
- CFD Trading
- CFD Markets
- CFD Markets
- Accounts
- Accounts
- Platforms & tools
- Platforms & tools
- Platforms
- Platforms
- Premium trading tools
- Premium trading tools
- Education
- Education
- Resources
- Resources
- Help & support
- Help & support
- About
- About
- Client support
- Target the next logical support or resistance zone,
- Use a fixed risk-to-reward ratio (e.g., 2:1 or 3:1),
- Or trail stops behind subsequent swing highs/lows to capture larger moves.
 News & analysis
The Pinbar Reversal Setup
28 August 2025The pinbar reversal is one of the most-used price action signals in trading.
It reflects a battle between buyers and sellers where one side attempts to push the market further in their favour, but is met with an observable and often strong rejection.
The resulting full pinbar candle leaves a long “wick” showing where price was rejected, and usually has a small body showing where it finally closed.
It suggests that momentum has shifted — traders tried to push through support or resistance but were overwhelmed by opposing pressure. This makes the pinbar a valuable signal when it forms at key levels.
Bearish Pinbar Reversal
A bearish pinbar forms after price has been moving upwards to a resistance level, but despite a test during the life of a candle, ultimately fails to hold.
The long upper wick shows rejection of higher prices, suggesting sellers could be taking control:
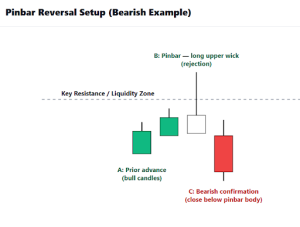 A: Prior advance (bull candles) → strong push into a resistance zone.
B: Pinbar (long upper wick) → rejection of higher prices as sellers absorb demand.
C: Confirmation candle (bearish close) → follow-through selling that validates the reversal and closes BELOW the pinbar candle body.
You can see a real-world example of this on the BTCUSD – 1 hourly chart:
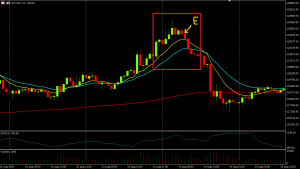
Entry point at ”E” as confirmation candle close below pinbar body is needed. Bullish Pinbar Reversal
A bullish pinbar forms after the price has been moving downwards into support, but fails to hold below that level.
The long lower wick shows rejection of lower prices, suggesting an absence of further selling pressure, with buyers expecting a bounce of the rejected support level.
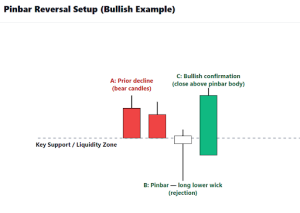 A: Prior decline (bear candles) → strong push down into a support zone.
B: Pinbar (long lower wick) → rejection of lower prices as buyers absorb selling.
C: Confirmation candle (bullish close) → follow-through buying that confirms the reversal and closes ABOVE the pinbar candle body.
You can see a real-world example of this on the USDJPY – 30-minute chart:
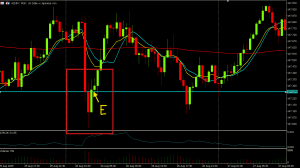
Strong pinbar reversal with confirmation candle immediate after pinbar. Entry at E at candle close. Stop Placement and Exits for Pinbar Set-ups
Risk management is critical when trading pinbar setups. A common approach is to place the stop-loss beyond the pinbar wick (above the upper wick in a bearish pinbar, or below the lower wick in a bullish pinbar).
This ensures if the market pushes past the level of rejection, the original trading idea is no longer valid, and an exit would likely be wise.
For other general exits, traders will often:
As with all trading strategies, the key is consistency in action. Exits should be planned before entering the trade, not improvised on emotional whims during the life of the trade.
Final Thoughts
The pinbar reversal setup captures shifts in market sentiment in a clear, visual way. Its popularity amongst traders is a reflection of its successes and its relative simplicity, even for less experienced traders.
By combining context (support/resistance zones), structure (A/B/C sequence), and disciplined risk management, traders can use pinbars as part of a robust price action strategy.
However, it is worth noting that not every pinbar is significant. The most reliable signals occur at meaningful levels, with confirmation from the next candle.
Invest some of your time practicing, seeing how many you can spot on various historical charts (and of course, make notes on what happened next) to build confidence in recognition before trading them live.
Ready to start trading?
The information provided is of general nature only and does not take into account your personal objectives, financial situations or needs. Before acting on any information provided, you should consider whether the information is suitable for you and your personal circumstances and if necessary, seek appropriate professional advice. All opinions, conclusions, forecasts or recommendations are reasonably held at the time of compilation but are subject to change without notice. Past performance is not an indication of future performance. Go Markets Pty Ltd, ABN 85 081 864 039, AFSL 254963 is a CFD issuer, and trading carries significant risks and is not suitable for everyone. You do not own or have any interest in the rights to the underlying assets. You should consider the appropriateness by reviewing our TMD, FSG, PDS and other CFD legal documents to ensure you understand the risks before you invest in CFDs. These documents are available here.
Previous Article
Understanding Change in Market Character (CIMC)
Market Character is the big sister of Market Structure. While Market Structure can show the framework of price highs and lows, Market Character reveal...
August 27, 2025Read More >
- CFD Trading
- CFD Trading
- CFD Trading
- CFD Markets
- CFD Markets
- CFD products overview
- Forex CFDs
- Commodity CFDs
- Metal CFDs
- Index CFDs
- Share CFDs
- Cryptocurrency CFDs
- Treasury CFDs
- ETF CFDs
- Accounts
- Accounts
- Compare our accounts
- Our spreads
- Funding & withdrawals
- Open CFD account
- Try free demo
- Platforms & tools
- Platforms & tools
- Platforms
- Platforms
- Platforms overview
- TradingView
- GO TradeX™
- MetaTrader 4
- MetaTrader 5
- cTrader
- cTrader copy trading
- Mobile trading platforms
- GO WebTrader
- Premium trading tools
- Premium trading tools
- Tools overview
- VPS
- Genesis
- Signal Centre
- Education
- Education
- Resources
- Resources
- News & analysis
- Education hub
- Economic calendar
- Earnings announcements
- Help & support
- Help & support
- About
- About
- About GO Markets
- Our awards
- Sponsorships
- Client support