- CFD Trading
- CFD Trading
- CFD Markets
- CFD Markets
- Accounts
- Accounts
- Platforms & tools
- Platforms & tools
- Platforms
- Platforms
- Premium trading tools
- Premium trading tools
- Education
- Education
- Resources
- Resources
- Help & support
- Help & support
- About
- About
- Client support
- CFD Trading
- CFD Trading
- CFD Markets
- CFD Markets
- Accounts
- Accounts
- Platforms & tools
- Platforms & tools
- Platforms
- Platforms
- Premium trading tools
- Premium trading tools
- Education
- Education
- Resources
- Resources
- Help & support
- Help & support
- About
- About
- Client support
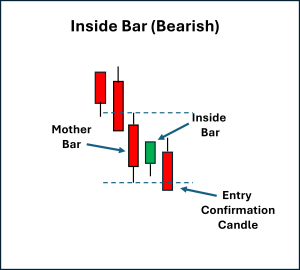
- A: Mother bar → a candle within a trend that sets the boundaries of the setup based on the high and low of its range
- B: Inside bar → a smaller candle that is contained entirely within the mother bar, showing indecision or temporary balance between buyers and sellers.
- C: Breakout and confirmation → price breaks below the low of the mother bar, confirmed by a bearish candle close, showing sellers taking control.
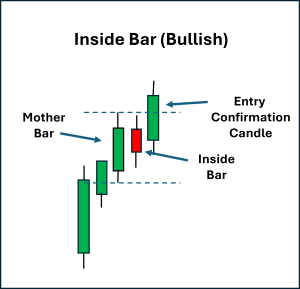
- A: Mother bar → an initial large candle showing a defined range.
- B: Inside bar → a small consolidation candle within the mother bar, often reflecting hesitation or equilibrium.
- C: Breakout and confirmation → a bullish candle closes above the high of the mother bar, showing buyers are ready to push higher.
- For bearish setups, stops are often placed above the high of the mother bar.
- For bullish setups, stops are typically placed below the low of the mother bar.
- Setting a fixed risk-to-reward level (e.g., 2:1).
- Using trailing stops as price moves continue to move in your desired direction, locking in profits during the life of the trade.
- From a profit target perspective, approaches that target logical chart levels, such as recent swing highs/lows or nearby support/resistance zones, can be considered.
 News & analysis
The Inside Bar Breakout – Trading Setups
19 September 2025The Inside Bar breakout is a price action setup that indicates a short-term consolidation within the broader context of an existing trend — and a potential confirmation that the trend may be continuing.
It is a candle that forms entirely within the outer points of wicks that formed from the previous candle. This previous candle, often referred to as the mother bar, is critical in the formation of this price pattern.
This setup indicates a pause in market momentum (the market “catching its breath”) during the course of a trend before choosing whether to continue its move in that direction.
When price compresses into an inside bar, buyers and sellers are in temporary balance. The eventual breakout from this pause is where the potential opportunity lies for traders, when aligned with the prevailing trend.As with all chart patterns, the setup is not complete until a breakout and confirmation candle are seen in the chosen direction.
Bearish Inside Bar Breakout
A bearish breakout occurs when the price breaks below the low of the mother bar following the formation of an inside bar. This shows that sellers have regained or confirmed control after a period of consolidation.
On occasion, you may see a double inside bar where two bars trade within the range of the mother bar before finally breaking out.
Although some people may see this as not a pure inside bar, the market psychology behind the move has not changed.
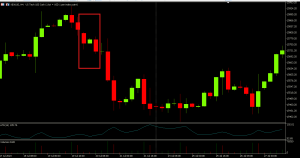
You can see a real chart example of this on the 4-hourly Nasdaq futures (NDX100) CFD chart, where there was a one-candle pause before continuation of the prevailing downtrend following a reversal to the downside.
Bullish Inside Bar Breakout
A bullish breakout occurs when the price breaks above the high of the mother bar following an inside bar. This demonstrates that buyers have reasserted control after the pause.
This reflects the market psychology where selling pressure was absorbed during the consolidation for one candle before renewed buying momentum.
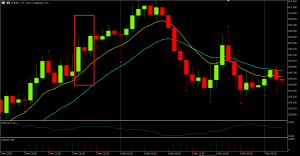
You can see a real chart example of this on the 30-minute EURJPY, where a strong move to the upside on the mother bar was temporarily halted, followed by the confirmation bar resulting in a 50 pip move upwards.
Stop Placement and Exits
Risk management is central to the inside bar strategy:
Profit management exit strategies vary depending on the risk profile of the trader and should be articulated in a trading plan. These can include:
Final Thoughts
The Inside Bar breakout is a flexible strategy that can be seen across different markets and timeframes.
Its strength lies in recognising that markets often pause and compress before a potential move in the same direction as the prevailing trend.
Its popularity is based on the fact that it can provide both an opportunity for entry when an initial trend move has been missed or an indication that accumulation into an existing position could be worth looking at.
By identifying the presence and the range of mother bar, the inside bar, and exercising patience for a decisive breakout, traders aim to capitalise on this temporary contraction and expansion in volatility.
As always, practising this setup and making notes on what happens next is crucial to determining your specific approach and developing testable, unambiguous criteria for action.
Ready to start trading?
The information provided is of general nature only and does not take into account your personal objectives, financial situations or needs. Before acting on any information provided, you should consider whether the information is suitable for you and your personal circumstances and if necessary, seek appropriate professional advice. All opinions, conclusions, forecasts or recommendations are reasonably held at the time of compilation but are subject to change without notice. Past performance is not an indication of future performance. Go Markets Pty Ltd, ABN 85 081 864 039, AFSL 254963 is a CFD issuer, and trading carries significant risks and is not suitable for everyone. You do not own or have any interest in the rights to the underlying assets. You should consider the appropriateness by reviewing our TMD, FSG, PDS and other CFD legal documents to ensure you understand the risks before you invest in CFDs. These documents are available here.
Next Article
The Break and Retest – Trading Setups
What Is the Break and Retest? The “Break and Retest” is a common price action setup based on two important principles: The tendency for prior resistance to become support, and prior support to become resistance. Several key-level breakout price moves will offer a challenge to the strength of a move by retesting the key level just breac...
September 24, 2025Read More >Previous Article
Next Big Stock Splits: Top 5 Stocks Set to Split in 2025-2026
Last year was the year of the split. Tech titans like Nvidia, Broadcom, and MicroStrategy all executed 10-for-1 stock splits that sent retail investor...
September 17, 2025Read More >
- CFD Trading
- CFD Trading
- CFD Trading
- CFD Markets
- CFD Markets
- CFD products overview
- Forex CFDs
- Commodity CFDs
- Metal CFDs
- Index CFDs
- Share CFDs
- Cryptocurrency CFDs
- Treasury CFDs
- ETF CFDs
- Accounts
- Accounts
- Compare our accounts
- Our spreads
- Funding & withdrawals
- Dynamic margin
- Open CFD account
- Try free demo
- Platforms & tools
- Platforms & tools
- Platforms
- Platforms
- Platforms overview
- TradingView
- GO TradeX™
- MetaTrader 4
- MetaTrader 5
- cTrader
- cTrader copy trading
- Mobile trading platforms
- GO WebTrader
- Premium trading tools
- Premium trading tools
- Tools overview
- VPS
- Genesis
- Signal Centre
- Education
- Education
- Resources
- Resources
- News & analysis
- Education hub
- Economic calendar
- Earnings announcements
- Help & support
- Help & support
- About
- About
- About GO Markets
- Our awards
- Sponsorships
- Client support