- Accounts
- About
- Trading
- Platforms
- Tools
- News & education
- News & education
- News & analysis
- Education hub
- Economic calendar

News & Analysis
How to identify key resistance levels
8 February 2022A resistance level is a key tool in technical analysis, indicating when an asset has reached a price level that market participants are unwilling to surpass. Resistance levels are often used in conjunction with support levels, or the point at which traders are unwilling to let an asset’s price drop much lower.
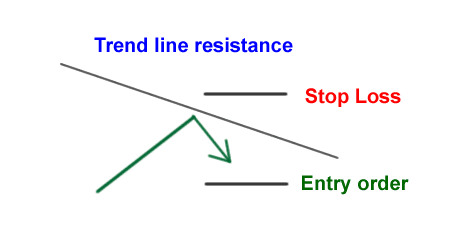
To understand this fully, it’s important to understand how support and resistance works in general. A support line is when a price hits a low point (on the selling side) and resistance is when the price hits a high (on the buying side). If the prices rebound back to this price or continue to hit this price without surpassing it, it then starts to become a key resistance or support level.
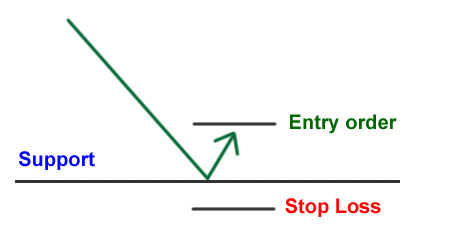
As a rule of thumb when using technical analysis, these tools become very important for some traders. This is due to those points offering various outcomes. Whether they are a Bounce or a Break, essentially meaning, does the price hit the support/resistance and comes back (Bounce) or does it go through the support/resistance lines (Breaks).
It is important to also use other indicators to accompany your technical analysis, as these movements could also easily become reversals or break outs, meaning, instead of them following your prognosis the price does the opposite.
When a price has been rejected various times, it builds an even stronger key resistance. Trading volume and sentiment can help to propel a price past this point and some of the biggest movements come after a price breaks a key resistance.
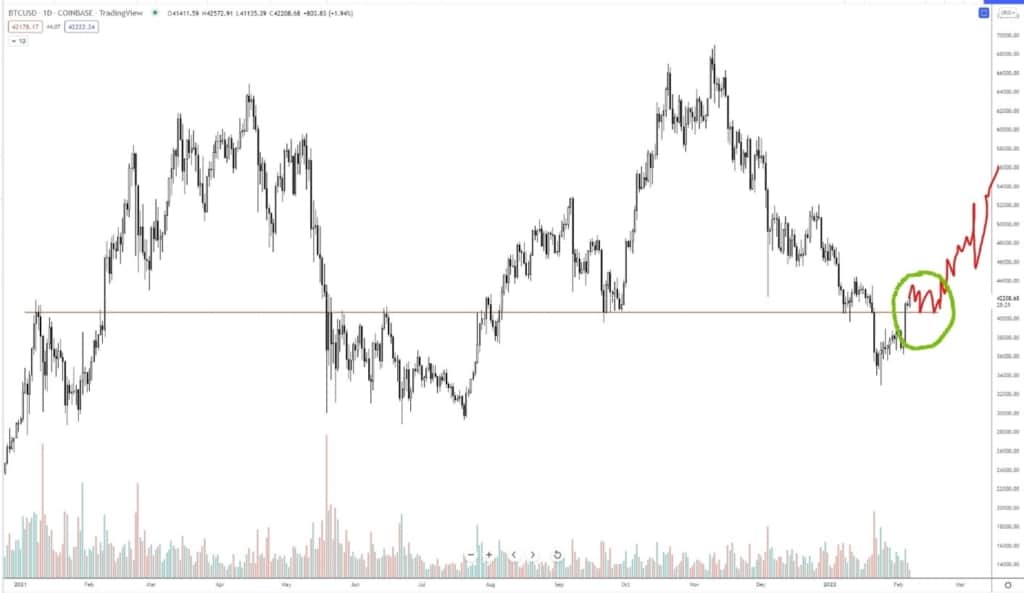
Using a current trend (Fig 1) and a hypothetical trend (Fig 2), let’s take the daily timeframe for BTCUSD as an example (below). The daily candle has broken through a key resistance of $41,000 as shown on figure 1. If a trader identifies this, they can do one of two things; trade it aggressively and place a trade as it breaks through or trade it conservatively and wait for the former resistance line to become the new support line before placing a trade (so wait for the price to bounce off as outlined on the drawn projection and circled on figure 2).
Figure 1.
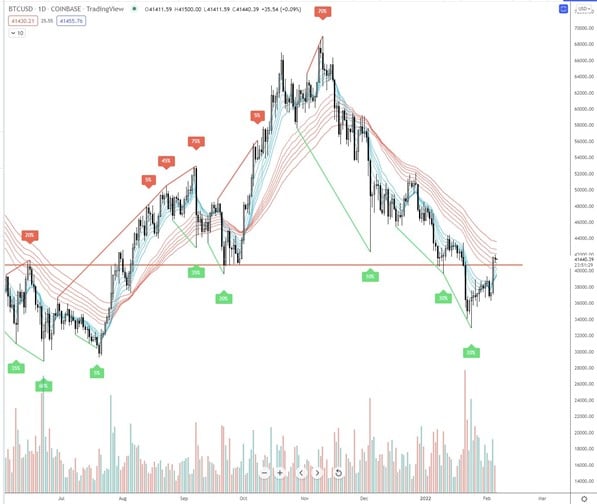
Figure 2.
This technical analysis can be used for any asset you wish to trade: it’s transferrable and key in identifying entry or exit points of trades. By learning to spot the patterns and combining this with knowledge of trading volume and sentiment, you can start to understand the markets better.
Sources: Babypips, Investopedia, @sell9000 Twitter.
Disclaimer: Articles are from GO Markets analysts and contributors and are based on their independent analysis or personal experiences. Views, opinions or trading styles expressed are their own, and should not be taken as either representative of or shared by GO Markets. Advice, if any, is of a ‘general’ nature and not based on your personal objectives, financial situation or needs. Consider how appropriate the advice, if any, is to your objectives, financial situation and needs, before acting on the advice. If the advice relates to acquiring a particular financial product, you should obtain and consider the Product Disclosure Statement (PDS) and Financial Services Guide (FSG) for that product before making any decisions.
Next Article
Identifying opportunities and managing risk with Autochartist
Autochartist's advanced chart pattern recognition can help you with identifying real-time trading opportunities and making more informed trading decisions. Founded in 2004, Autochartist is a financial market analytics company that leverages big data and proprietary technology to provide their services. They provide analytics for currencies, com...
February 8, 2022
Read More >
Previous Article
Share buybacks and Dividends. How do they compare?
As a shareholder of any company, you can be rewarded by that company in the form of share buybacks and dividend pay-outs. These actions would ofte...
February 7, 2022
Read More >