NVIDIA Inflates AI Bubble, Bitcoin on Knife's Edge, and Fed Members Divided
GO Markets
20/11/2025
•
0 min read
Share this post
Copy URL
NVIDIA delivered a resounding answer to AI bubble concerns this morning, reporting third-quarter earnings that surpassed Wall Street expectations and signalling sustained momentum in AI infrastructure spending.
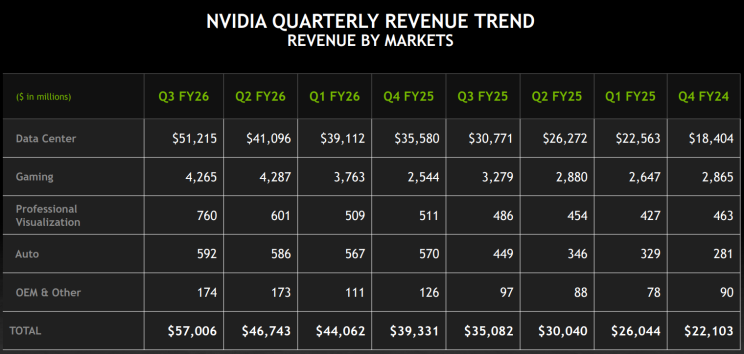
The chip giant posted adjusted earnings of $1.30 per share on revenue of $57.01 billion, beating analyst estimates of $1.26 EPS on $54.92 billion.
Revenue surged 62% year-over-year, with the critical data centre segment delivering $51.2 billion against expectations of $49 billion.
More importantly, NVIDIA projected fourth-quarter revenue of approximately $65 billion, significantly above the $61.66 billion consensus, indicating demand for AI accelerators shows no signs of cooling.
The company's next-generation Blackwell architecture is seeing unprecedented demand from cloud providers building out massive AI infrastructure. CEO Jensen Huang simply stated: "Blackwell sales are off the charts, and cloud GPUs are sold out."
NVIDIA shares had declined nearly 8% in November as prominent investors raised concerns about AI valuations. Peter Thiel's Thiel Macro completely exited its approximately $100 million position, while SoftBank divested $5.8 billion in holdings.
However, the continued capital expenditure by Big Tech customers — Microsoft alone spent nearly $35 billion in its most recent quarter, with roughly half allocated to chips — suggests the buildout phase is far from complete.
Beyond data centres, NVIDIA’s gaming revenue reached $4.3 billion (up 30% year-over-year), professional visualisation generated $760 million (up 56%), and automotive/robotics sales hit $592 million (up 32%).
The near-term trajectory remains strong, with the company continuing to capture the lion's share of AI chip demand in a market showing no signs of saturation.
Experts Split on Bitcoin's Trajectory
Bitcoin is at a vital inflection point, trading around $92,300 after briefly dipping below $90,000 for the first time in seven months.
The pressure stems from retail selling, leveraged trading liquidations, and institutional positioning, creating an environment where experts are split as to whether this is the end of the cycle or just a healthy pullback.
Crypto Fear & Greed Index hit its lowest reading since April
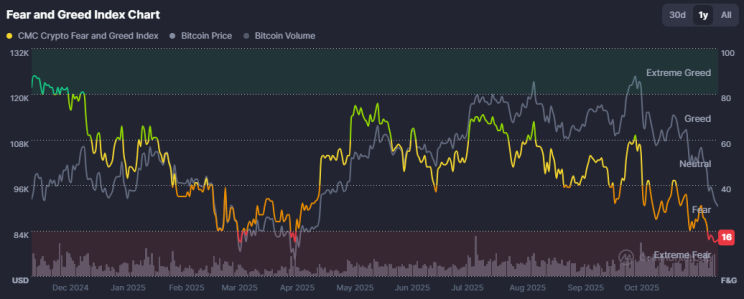
Glassnode data show approximately 65,200 BTC—valued at roughly $6.08 billion—was sold at a loss within 24 hours, indicating capitulation among short-term holders who bought near recent highs.
Yet, while retail investors panic-sell, wallets holding at least 1,000 BTC have increased to 1,384, a four-month high. Over 102,000 whale transactions exceeding $100,000 and 29,000 transactions over $1 million have been made this week, potentially making this the most active whale week of 2025.
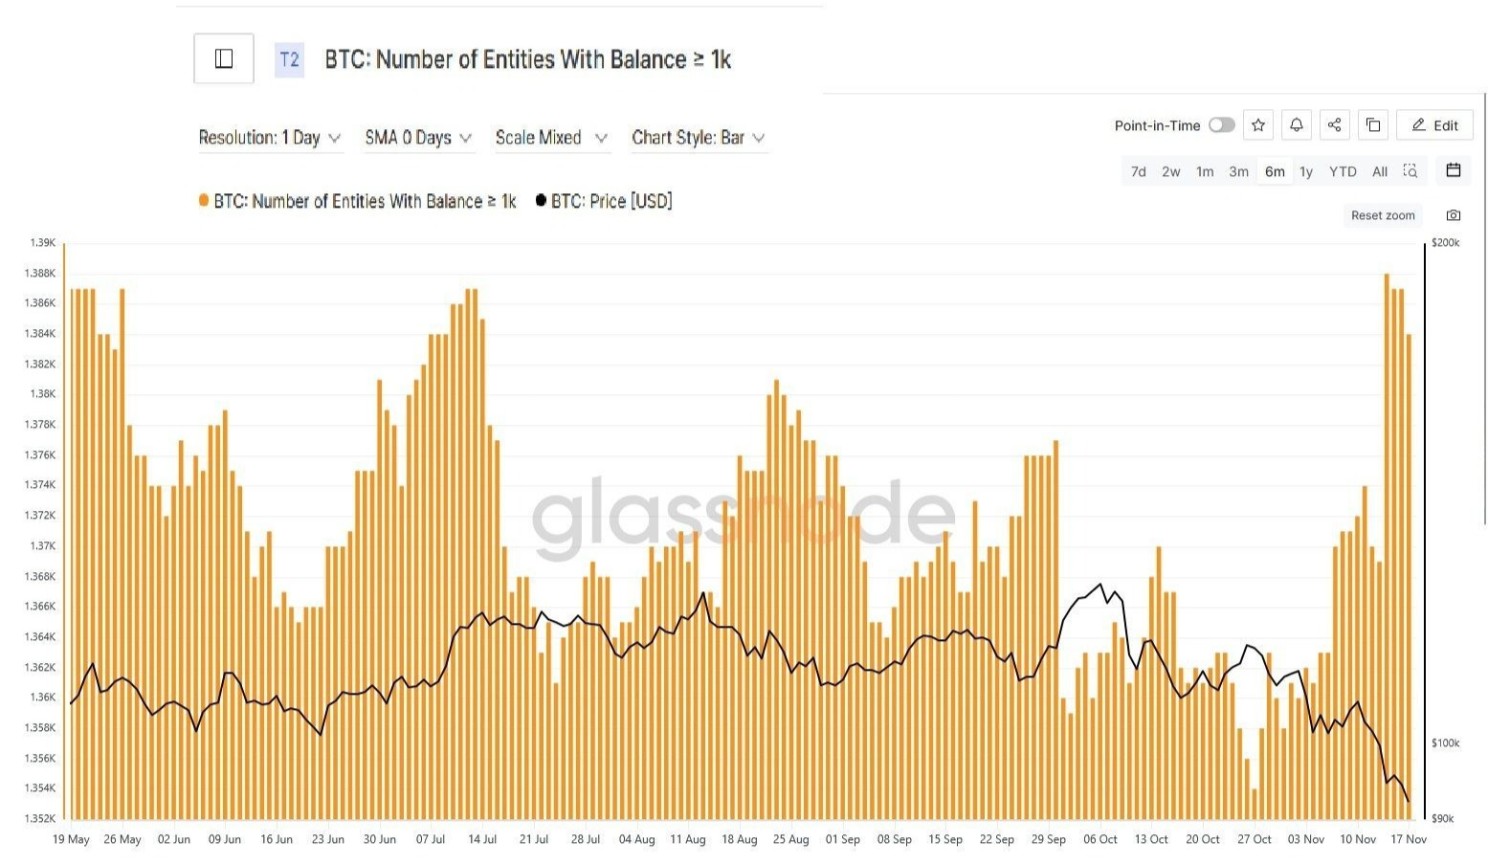
This accumulation pattern during fear-driven selloffs has historically preceded medium-term recoveries (though past performance offers no guarantees).
For now, the market remains on a knife's edge, with high volatility seemingly the only certainty.
Fed Still Faces Divide as Data Starts Flowing
The Federal Reserve stands at a crossroads heading into its December 9-10 meeting, with internal divisions threatening to derail what was considered a near-certain third consecutive rate cut.
The released minutes of the October FOMC exposed strongly differing views within the Fed about the December policy decision, with many suggesting no more cuts are needed through the end of 2025.
Odds of a rate cut have flipped over the past week
Complicating things further is the data pause from the recent 44-day government shutdown. The Labor Department announced that October and November employment data won't be released until December 16 — six days after the FOMC meeting concludes — depriving the Fed of crucial labor market information.
Fed Chair Jerome Powell stated that a December rate cut is "far from a foregone conclusion," and there is "a growing chorus" among officials to "at least wait a cycle" before cutting again.
This represents the highest level of internal discord during Powell's tenure, with predictions of potentially four or five dissents at the December meeting — the most since 1992.
The December meeting will reveal whether the Fed can maintain the credibility needed to navigate a U.S. economy caught between stubborn inflation and (seemingly) weak labour market.
Every data release and Fed official comment between now and then will move markets as investors search for clues about the Fed’s next move.
By
GO Markets
The information provided is of general nature only and does not take into account your personal objectives, financial situations or needs. Before acting on any information provided, you should consider whether the information is suitable for you and your personal circumstances and if necessary, seek appropriate professional advice. All opinions, conclusions, forecasts or recommendations are reasonably held at the time of compilation but are subject to change without notice. Past performance is not an indication of future performance. Go Markets Pty Ltd, ABN 85 081 864 039, AFSL 254963 is a CFD issuer, and trading carries significant risks and is not suitable for everyone. You do not own or have any interest in the rights to the underlying assets. You should consider the appropriateness by reviewing our TMD, FSG, PDS and other CFD legal documents to ensure you understand the risks before you invest in CFDs. These documents are available here.
Last week was as consequential as advertised. The RBA hiked, the Fed held, and markets barely had time to process any of it before reports emerged that Israel had struck Iran's South Pars gas field.
The week ahead brings fewer central bank decisions, but it may be just as important for markets. Flash PMIs will offer the first broad read on whether the war is already showing up in business confidence. Australia's February CPI is the domestic data point that matters most for the RBA's next move. And the oil market remains the dominant macro variable.
Quick facts
Brent crude spiked above $110 per barrel after Israel struck Iran's South Pars gas field for the first time.
Flash PMIs for Australia, Japan, the eurozone, UK, and the US all land Tuesday.
Australia's February CPI lands Wednesday, the first inflation read since the back-to-back RBA hikes.
Oil: From crisis to emergency
The oil situation deteriorated significantly last week. Brent crude has now surged roughly 80% since the war began on 28 February.
The 18 March strike on Iran's South Pars gas field was the first time upstream oil and gas infrastructure has been targeted.
Iran responded to the strike by threatening to target facilities across Saudi Arabia, the UAE and Qatar. If any of these threats are executed, the global oil shock would escalate from a supply disruption to a direct attack on the region's production capacity.
Analysts are now saying $150 Brent is achievable and $200 is not outside the realm of possibility. The 1970s Arab oil embargo resulted in a quadrupling of prices, and the current shock is already being described in those terms by senior energy executives.
For markets this week, oil is the dominant variable. Any signal of ceasefire, diplomatic progress or resumed Hormuz shipping could likely trigger a correction in oil prices. Any Iranian strike on Gulf infrastructure could send them higher.
Monitor
Daily vessel transit numbers through the Strait of Hormuz.
Iranian retaliation against Gulf infrastructure, a strike on Saudi or UAE facilities would be a major escalation.
When and how American and European IEA reserves reach the market.
Qatar's South Pars disruption is affecting the European LNG market.
Trump statements that could cause intraday oil price movement.
Global Flash PMIs: The first read on an economy at war
Tuesday delivers the S&P Global flash PMI estimates for March across every major economy simultaneously.
This will be the first data set to capture how manufacturers and services firms are responding to $100+ oil, the Strait of Hormuz blockade, and the broader uncertainty created by the war in the Middle East.
The key question for each economy is whether the oil price surge and war uncertainty have dented business confidence, suppressed new orders or pushed input price indices to new multi-year highs.
Given that oil crossed $100 before the survey window closed for most economies, input cost readings could be significantly elevated.
Key dates
S&P Global Flash Australia PMI: Tuesday 24 March, 9:00 am AEDT
S&P Global Flash Japan PMI: Tuesday 24 March, 11:30 am AEDT
HSBC Flash India PMI: Tuesday 24 March, 4:00 pm AEDT
HCOB Flash France PMI: Tuesday 24 March, 7:15 pm AEDT
The RBA hiked for the second meeting in a row on 17 March, lifting the cash rate to 4.10% in a narrow 5-4 vote.
Governor Bullock described it as a "very active discussion" where the direction of policy was not in question, only the timing.
This week will see the release of February's CPI as the first read to capture any of the oil shock. The trimmed mean, which strips out volatile items including fuel, will be the number the RBA watches most closely. A reading above 3.5% could cement the case for a May hike. A softer result could revive the argument for a pause.
ANZ and NAB have both stated expectations of a third hike in May, taking the cash rate to 4.35%.
Key dates
ABS Consumer Price Index (CPI): Wednesday 25 March, 11:30 am AEDT
Monitor
Trimmed mean inflation as the RBA's preferred measure.
Fuel and energy components that could separate the oil shock from domestic price pressure.
Housing and services inflation as sticky components driving the RBA's long-run concern.
Asia dominates the global semiconductor supply. Five companies, spanning Taiwan, South Korea, and Japan, sit at the critical juncture of the AI buildout, controlling everything from fabrication to the equipment that makes chips possible.
Quick facts
TSMC delivered $90 billion in revenue in 2024, with a 59% gross margin and shares up 55% in 2025.
Advantest shares doubled (+102%) in 2025 as AI-driven chip testing demand surged.
SK Hynix is Nvidia's primary HBM supplier, positioning it at the centre of the AI accelerator boom.
1. Taiwan Semiconductor Manufacturing Co. (TSM)
TSMC is the world's largest contract chip manufacturer, producing advanced semiconductors for Apple, Nvidia, AMD, and Qualcomm. As a pure-play foundry, it leads in 5-nanometer (5nm) and 3- nanometer (3nm) chip production, with smaller nodes in development.
The company posted $90 billion in revenue for 2024 with a 59% gross margin and 36% return on equity.
Shares delivered a total return of 55% in 2025, with analysts forecasting a further ~30% revenue increase in 2026, underpinned by its $100 billion US expansion programme.
The key risk for the company is its geopolitical exposure, with Taiwan Strait tensions remaining the sector's most-watched tail risk.
What to watch
US expansion progress: Any delays, cost blowouts, or political friction concerning TSMC's $100 billion Arizona investment could weigh on sentiment.
Customer order visibility: Watch for any guidance updates from Apple, Nvidia, or AMD on chip orders, as TSMC's revenue is highly concentrated among a handful of clients.
Geopolitical developments: Any escalation of Taiwan Strait tensions could trigger sharp moves regardless of fundamentals.
Next-node ramp: Progress on 2nm production and yield rates will be a key signal for TSMC's ability to maintain its technology lead.
2. Samsung Electronics (KR:005930)
Samsung is one of the few companies globally that both designs and fabricates chips at scale. It competes across DRAM, NAND flash, and logic chip segments, and remains a core supplier to global tech giants.
Samsung's wide scope is a strength, but also a complexity. Its memory division faces margin pressure from inventory cycles, while its foundry business continues to lag TSMC in leading-edge yields.
The AI-driven memory boom may provide a tailwind, though execution in HBM production has been slower than local rival SK Hynix.
What to watch
HBM qualification progress: Samsung has been working to qualify its HBM3E chips with Nvidia. Any confirmation of a major supply win could be a meaningful catalyst.
Memory pricing trends: DRAM and NAND spot prices could be an indicator of Samsung's margin trajectory.
Foundry yield improvements: Samsung's logic foundry business has struggled with yields at advanced nodes; any credible progress here could re-rate the division.
Management guidance: Following a period of earnings volatility, clarity on capex plans and divisional targets at upcoming results will be closely watched.
Tokyo-based Advantest makes testing equipment used to verify chips meet performance and quality standards.
It supplies to Samsung, Intel, Nvidia, Qualcomm, and Texas Instruments, allowing it to benefit from chip industry growth broadly, regardless of which foundry wins market share.
Advantest shares doubled in 2025 (+102%), and it raised its sales forecast by 21.8% and earnings forecast by 70.6% for the year ending March 2026.
What to watch
Order backlog updates: Any contraction in Advantest's backlog could be an early warning sign after the strong 2025 run.
AI chip testing demand: As chips grow more complex, testing time per chip increases. Monitor whether AI accelerator volumes from TSMC and Samsung start to drive outsized testing demand.
FY2026 guidance: The next forecast update will be critical in confirming whether 2025's upgrade cycle has further to run.
Tokyo Electron is among the world's largest suppliers of semiconductor production equipment, specialising in deposition, etching, and cleaning tools.
Every major chipmaker, including TSMC, Samsung, and SK Hynix, depends on TEL's systems to scale production.
As chipmakers invest billions to expand capacity, TEL's order book grows. The risk lies in potential US export restrictions on advanced equipment sales to China, which remains one of the primary revenue segments for the company.
What to watch
US export control policy: China accounts for a significant portion of TEL's revenue. Any tightening of equipment export rules is the most immediate risk to watch.
Chipmaker capex announcements: TSMC, Samsung, and SK Hynix's capital expenditure plans for 2026 directly translate into equipment orders. Any cuts could flow through to TEL's order book.
New tool adoption cycles: Monitor whether TEL's next-generation deposition and etch tools are being adopted at leading-edge fabs.
5. SK Hynix (KR:000660)
SK Hynix is the world's second-largest memory chip maker and has emerged as arguably the clearest AI-era beneficiary in the memory space.
It is Nvidia's primary supplier of High Bandwidth Memory (HBM) chips, the specialised memory used in AI accelerators like the H100 and B200.
HBM demand has driven a dramatic re-rating of SK Hynix's revenue profile and market standing. With AI infrastructure spending showing little sign of slowing heading into 2026, the company's HBM franchise could remain a key differentiator.
However, capacity constraints and the risk of Samsung and Micron closing the HBM gap are the primary concerns to watch.
What to watch
Nvidia supply relationship: Any shift in Nvidia's supplier mix toward Samsung or Micron could be a key risk event.
HBM4 development: The race to next-generation HBM is already underway. Watch for updates on SK Hynix's HBM4 readiness and whether it can maintain its lead.
Conventional memory pricing: SK Hynix still derives meaningful revenue from standard DRAM and NAND. Spot price trends could be a gauge of the broader memory cycle.
Bottom line
TSMC, SK Hynix, Samsung, Advantest, and Tokyo Electron collectively control the chokepoints of the AI buildout.
The expected increase in AI infrastructure may support demand, but investors should weigh the risks carefully.
Geopolitical exposure, US export restrictions, and the pace of HBM competition could all move the needle.
If you've spent any time looking at a trading terminal, you've seen it. A news headline breaks, a chart line snaps, and suddenly everyone is rushing for the same exit or the same entrance. It looks like chaos. In practice, it is often a chain of mechanical responses.
This matters for a couple of reasons. Many readers assume the story is the trade. It is not. The story, whether it is an interest rate decision, a supply shock or an earnings miss, is the fuel and the playbook is the engine.
Below are seven core strategies often used in contracts for difference (CFDs) trading. With CFDs, you are not buying the underlying asset. You are speculating on the change in value. That means a trader can take a long position if the price rises, or a short position if it falls.
Seven strategies to understand first
1. Trend following (the establishment play)
Trend following works on the idea that a market already in motion can remain in motion until it meets a clear structural obstacle. Some market participants view it as a chart-based approach because it focuses on the prevailing direction rather than trying to call an exact turning point.
The rationale: The aim is to identify a clear directional bias, such as higher highs and higher lows, and follow that momentum rather than position against it.
What traders look for: Exponential moving averages (EMAs), such as the 50-day or 200-day EMA, are commonly used to interpret trend strength, though indicators can produce false signals and are not reliable on their own.
Source: GO Markets | Educational example only.
How it works: The 50-period EMA can act as a dynamic support level that rises as price rises. In an uptrend, some traders watch for the market to make a new higher high (HH), then pull back towards the EMA before moving higher again. Each higher low (HL) may suggest buyers are still in control.
When price touches or comes close to the 50-period EMA during that pullback, some traders treat that area as a potential decision zone rather than assuming the trend will resume automatically.
What to watch: The sequence of HHs and HLs is part of the structural evidence of a trend. If that sequence breaks, for example if price falls below the previous HL, the trend may be weakening and the setup may no longer hold.
2. Range trading (the ping-pong play)
Markets can spend long stretches moving sideways. That creates a range, where buyers and sellers are in temporary balance. Range trading is built around this behaviour, focusing on moves near the bottom and top of an established range.
The rationale: Price moves between a floor, known as support, and a ceiling, known as resistance. Moves near those boundaries can help define the width of the range.
What traders look for: Some traders use oscillators such as the Relative Strength Index (RSI) to help judge whether the asset looks overbought or oversold near each boundary.
Source: GO Markets | Educational example only.
How it works: The support level is a price zone where buying interest has historically been strong enough to stop the market from falling further. The resistance level is where selling pressure has historically prevented further gains.
When price approaches support, some traders look for signs of a potential rebound. When it approaches resistance, they look for signs that momentum may be fading. RSI readings below 35 can suggest the market is oversold near support, while readings above 65 can suggest it is overbought near resistance.
What to watch: The main risk in range trading is a breakout, when price pushes decisively through either level with strong momentum. This may signal the start of a new trend and using a stop-loss just outside the range on each trade may help manage that risk.
3. Breakouts (the coiled spring play)
Eventually, every range comes under pressure. A breakout happens when the balance shifts and price pushes through support or resistance. Markets alternate between periods of low volatility, where price moves sideways in a tight range, and high-volatility bursts where price can make a larger directional move.
The rationale: Quiet consolidation can sometimes be followed by a broader expansion in volatility. The tighter the compression, the more energy may be stored for the next move.
What traders look for: Bollinger Bands are often used to interpret changes in volatility. When the bands tighten, a squeeze is forming. Some market participants view a move outside the bands as a sign that conditions may be changing.
Source: GO Markets | Educational example only.
How it works: Bollinger Bands consist of a middle line, the 20-period moving average, and 2 outer bands that expand or contract based on recent price volatility. When the bands narrow and come close together, the squeeze, the market has been unusually calm.
This is often described as a coiled spring. Energy may be building, and a sharper move can follow. Some traders treat the first move through an outer band as an early clue on direction, rather than a definitive signal on its own.
What to watch: Not every squeeze leads to a powerful breakout. A false breakout occurs when price briefly moves outside a band, then quickly reverses back inside. Waiting for the candle to close outside the band, rather than entering mid-candle, can reduce the risk of being caught in a false move.
4. News trading (the deviation play)
This is event-driven trading. The focus is on the gap between what the market expected and what the data or headline actually delivered. Economic data releases, such as inflation figures (CPI), employment reports and central bank decisions, can cause sharp, fast moves in financial markets.
The rationale: High-impact releases, such as inflation data or central bank decisions, can force a fast repricing of assets. The bigger the surprise relative to expectations, the larger the move may be.
What traders look for: Traders often use an economic calendar to track timing. Some focus on how the market behaves after the initial reaction, rather than treating the first move as definitive.
Source: GO Markets | Educational example only.
How it works: Before the news, price may move in a calm, tight range as traders wait. When the data is released, if the actual reading differs significantly from the consensus expectation, repricing can happen fast.
Gold, for example, may spike sharply on a CPI reading that comes in above expectations. However, the candle can also print a very long upper wick, meaning price reached the spike high but was then rejected strongly. Sellers may step in quickly, and price may retrace. This spike-and-retrace pattern is one of the more recognisable setups in news trading.
What to watch: The direction and size of the initial spike do not always tell the full story. Wick length can offer an important clue. A long wick may suggest the initial move was rejected, while shorter wicks after a data release may indicate a more sustained directional move.
5. Mean reversion (the rubber-band play)
Prices can sometimes move too far, too fast. Mean reversion is built on the idea that an overextended move may drift back towards its historical average, like a rubber band pulled too tight, then snapping back.
The rationale: This is a contrarian approach. It looks for stretches of optimism or pessimism that may not be sustainable, and positions for a return to equilibrium.
What traders look for: A common example is price moving well away from a 20-day moving average (MA) while RSI also reaches an extreme reading. In that setup, traders watch for a move back towards the mean rather than a continuation away from it.
Source: GO Markets | Educational example only.
How it works: The 20-period MA represents the market's recent average price. When price moves into an extreme zone, such as more than 3 standard deviations above or below that average, it has moved a long way from its recent trend.
An RSI above 70 can suggest the market is stretched to the upside, while below 30 can suggest the same to the downside. Some mean reversion traders use these combined signals as a sign that a pullback towards the 20-period MA may be possible, rather than assuming the move will continue to extend.
What to watch: Mean reversion strategies can carry significant risk in strongly trending markets. A market can remain extended for longer than expected, and a position entered against the short-term trend can generate large drawdowns. Position sizing and clear stop-losses are critical.
6. Psychological levels (the big figure play)
Markets are driven by people, and people tend to focus on round numbers. US$100, US$2,000 or parity at 1.000 on a currency pair can act as magnets. In financial markets, certain price levels can attract a disproportionate amount of buying and selling activity, not because of technical analysis alone, but because of human psychology.
The rationale: Large orders, stop-losses and take-profit levels can cluster around these big figures, which may reinforce support or resistance. This self-reinforcing behaviour is one reason these rejections can become meaningful for traders.
What traders look for: Traders often watch how price behaves as it approaches a round number. The market may hesitate, reject the level or break through it with momentum. Multiple wick rejections at the same level may carry more weight than a single one.
Source: GO Markets | Educational example only.
How it works: When price approaches a round number from below, some traders watch for long upper wicks, the thin vertical line above the candle body. A long upper wick means price reached that level, but sellers stepped in aggressively and pushed it back down before the candle closed.
One wick rejection may be notable. Three in a cluster may be more significant. Some traders use this accumulated rejection as part of the case for a short (sell) setup at that level.
What to watch: Psychological levels can also act as magnets in the opposite direction. If price breaks through with conviction, the level may then act as support. A decisive close above the level, rather than just a wick break, can be an early sign that the rejection setup is no longer holding.
7. Sector rotation (the economic season play)
This is a macro strategy. As the economic backdrop changes, capital may move from higher-growth sectors into more defensive ones, and back again. Not all parts of the sharemarket move in the same direction at the same time.
The rationale: In a slowing economy, discretionary spending may weaken while demand for essential services can remain more stable. Investors may rotate capital between sectors accordingly.
What traders look for: With CFDs, some traders express this view through relative strength, taking exposure to a stronger sector while reducing or offsetting exposure to a weaker one.
Source: GO Markets | Educational example only.
How it works: During a growth phase, when the economy is expanding, investors tend to prefer growth-oriented sectors like technology. As the economic environment shifts, perhaps due to rising interest rates, slowing earnings or increasing recession risk, a rotation point may emerge.
In the slowdown phase, the pattern can reverse. Technology may weaken while utilities may strengthen, as investors move capital into defensive, income-generating sectors. Early signals can include relative underperformance in growth sectors combined with unusual strength in defensives.
What to watch: Sector rotation is not usually an overnight event. It typically unfolds over weeks to months. Tracking the ratio between two sectors, often shown in a relative strength chart, can make this shift visible before it becomes obvious in absolute price terms.
Why risk management is the engine of survival
The headline move is one thing. The market implication for your account is another. If you do not manage the mechanics, the strategy does not matter.
Because CFDs are traded on margin, a small market move may have an outsized impact on the account. If leverage is too high, even a minor wobble may trigger a margin call or automatic position closure, depending on the provider's terms. This is not a theoretical risk. It is a common reason new traders lose more than they expected on a trade that was directionally correct.
The market does not always move in a straight line. Sometimes, price gaps from one level to another, especially after a weekend or major news event and in those conditions, a stop-loss may not be filled at the exact requested price. That is known as slippage. It is one reason large positions may carry additional risk into major announcements.
Bottom line
The vehicle is powerful, but the playbook is what helps keep you on the road.
The obvious trade is often already priced in. What matters more is understanding which market condition is in front of you. Is it trending, ranging, breaking out or simply reacting to a headline?
Readers assessing leveraged products often focus on position sizing, risk limits and product disclosure before deciding whether the product is appropriate for them. The headlines will keep changing. The maths of risk management does not.
Disclaimer: This article is general information only and is intended for educational purposes. It explains common trading concepts and market behaviours and does not constitute financial product advice, a recommendation, or a trading signal. Any examples are illustrative only and do not take into account your objectives, financial situation or needs. CFDs are complex, leveraged products that carry a high level of risk. Before acting, consider the PDS and TMD and whether trading CFDs is appropriate for you. Seek independent advice if needed. Past performance is not a reliable indicator of future results.
Last week was as consequential as advertised. The RBA hiked, the Fed held, and markets barely had time to process any of it before reports emerged that Israel had struck Iran's South Pars gas field.
The week ahead brings fewer central bank decisions, but it may be just as important for markets. Flash PMIs will offer the first broad read on whether the war is already showing up in business confidence. Australia's February CPI is the domestic data point that matters most for the RBA's next move. And the oil market remains the dominant macro variable.
Quick facts
Brent crude spiked above $110 per barrel after Israel struck Iran's South Pars gas field for the first time.
Flash PMIs for Australia, Japan, the eurozone, UK, and the US all land Tuesday.
Australia's February CPI lands Wednesday, the first inflation read since the back-to-back RBA hikes.
Oil: From crisis to emergency
The oil situation deteriorated significantly last week. Brent crude has now surged roughly 80% since the war began on 28 February.
The 18 March strike on Iran's South Pars gas field was the first time upstream oil and gas infrastructure has been targeted.
Iran responded to the strike by threatening to target facilities across Saudi Arabia, the UAE and Qatar. If any of these threats are executed, the global oil shock would escalate from a supply disruption to a direct attack on the region's production capacity.
Analysts are now saying $150 Brent is achievable and $200 is not outside the realm of possibility. The 1970s Arab oil embargo resulted in a quadrupling of prices, and the current shock is already being described in those terms by senior energy executives.
For markets this week, oil is the dominant variable. Any signal of ceasefire, diplomatic progress or resumed Hormuz shipping could likely trigger a correction in oil prices. Any Iranian strike on Gulf infrastructure could send them higher.
Monitor
Daily vessel transit numbers through the Strait of Hormuz.
Iranian retaliation against Gulf infrastructure, a strike on Saudi or UAE facilities would be a major escalation.
When and how American and European IEA reserves reach the market.
Qatar's South Pars disruption is affecting the European LNG market.
Trump statements that could cause intraday oil price movement.
Global Flash PMIs: The first read on an economy at war
Tuesday delivers the S&P Global flash PMI estimates for March across every major economy simultaneously.
This will be the first data set to capture how manufacturers and services firms are responding to $100+ oil, the Strait of Hormuz blockade, and the broader uncertainty created by the war in the Middle East.
The key question for each economy is whether the oil price surge and war uncertainty have dented business confidence, suppressed new orders or pushed input price indices to new multi-year highs.
Given that oil crossed $100 before the survey window closed for most economies, input cost readings could be significantly elevated.
Key dates
S&P Global Flash Australia PMI: Tuesday 24 March, 9:00 am AEDT
S&P Global Flash Japan PMI: Tuesday 24 March, 11:30 am AEDT
HSBC Flash India PMI: Tuesday 24 March, 4:00 pm AEDT
HCOB Flash France PMI: Tuesday 24 March, 7:15 pm AEDT
The RBA hiked for the second meeting in a row on 17 March, lifting the cash rate to 4.10% in a narrow 5-4 vote.
Governor Bullock described it as a "very active discussion" where the direction of policy was not in question, only the timing.
This week will see the release of February's CPI as the first read to capture any of the oil shock. The trimmed mean, which strips out volatile items including fuel, will be the number the RBA watches most closely. A reading above 3.5% could cement the case for a May hike. A softer result could revive the argument for a pause.
ANZ and NAB have both stated expectations of a third hike in May, taking the cash rate to 4.35%.
Key dates
ABS Consumer Price Index (CPI): Wednesday 25 March, 11:30 am AEDT
Monitor
Trimmed mean inflation as the RBA's preferred measure.
Fuel and energy components that could separate the oil shock from domestic price pressure.
Housing and services inflation as sticky components driving the RBA's long-run concern.