- CFD Trading
- CFD Trading
- CFD Markets
- CFD Markets
- Accounts
- Accounts
- Platforms & tools
- Platforms & tools
- Platforms
- Platforms
- Premium trading tools
- Premium trading tools
- Education
- Education
- Resources
- Resources
- Help & support
- Help & support
- About
- About
- Client support
- CFD Trading
- CFD Trading
- CFD Markets
- CFD Markets
- Accounts
- Accounts
- Platforms & tools
- Platforms & tools
- Platforms
- Platforms
- Premium trading tools
- Premium trading tools
- Education
- Education
- Resources
- Resources
- Help & support
- Help & support
- About
- About
- Client support
 News & analysis
FOMC Preview – One and Done, or More to Come? The Charts to Watch
26 July 2023The long-awaited July FOMC meeting is finally upon us where rates markets are pricing in a sure thing for a 25bp hike (even a small chance of a 50bp), the question that traders will be looking for to be answered is “is this it?”. With a growing number of economists calling this the top in rates, butting up against the FOMC June statement and unwavering Fed speak since, giving guidance that there will be two more this year (including July if it happens).
This sets traders up with an intriguing FOMC meeting, with the accompanying statement and Powell Presser sure to see some volatility as traders look for clues as to what’s to come. With the background of recently cooling inflation, any language around the previously released June dot plots and whether they are still a reasonable estimate of future rate movements will likely be key.
Fed Futures odds:
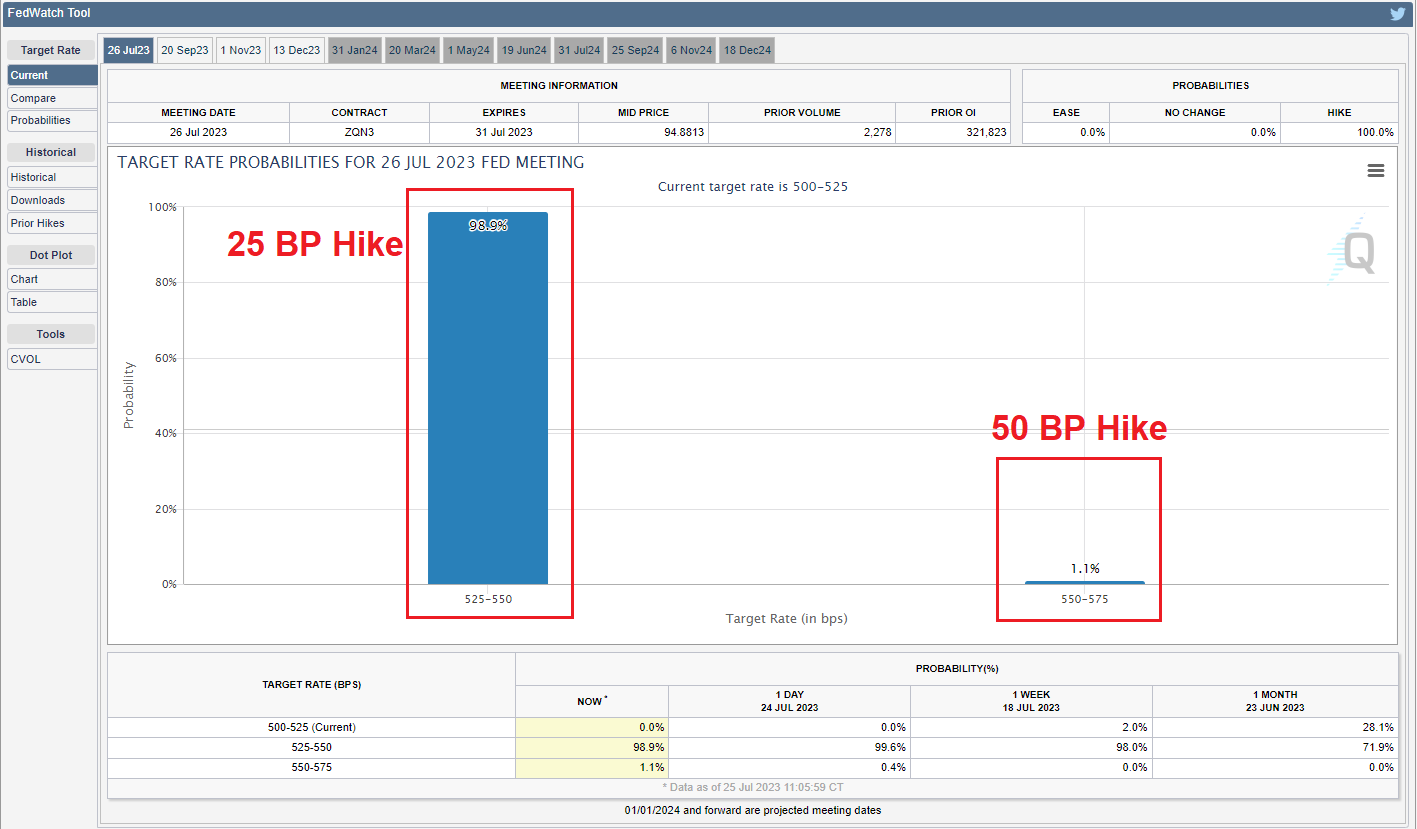
Source: CME Fedwatch tool
Tis seta traders up with some unique opportunities as the battle between the Market and the Fed should see some real volatility in both direction as market participants digest the statement and then Powell’s presser, which in the past, has contradicted somewhat traders perception of the statement.
Charts to watch:
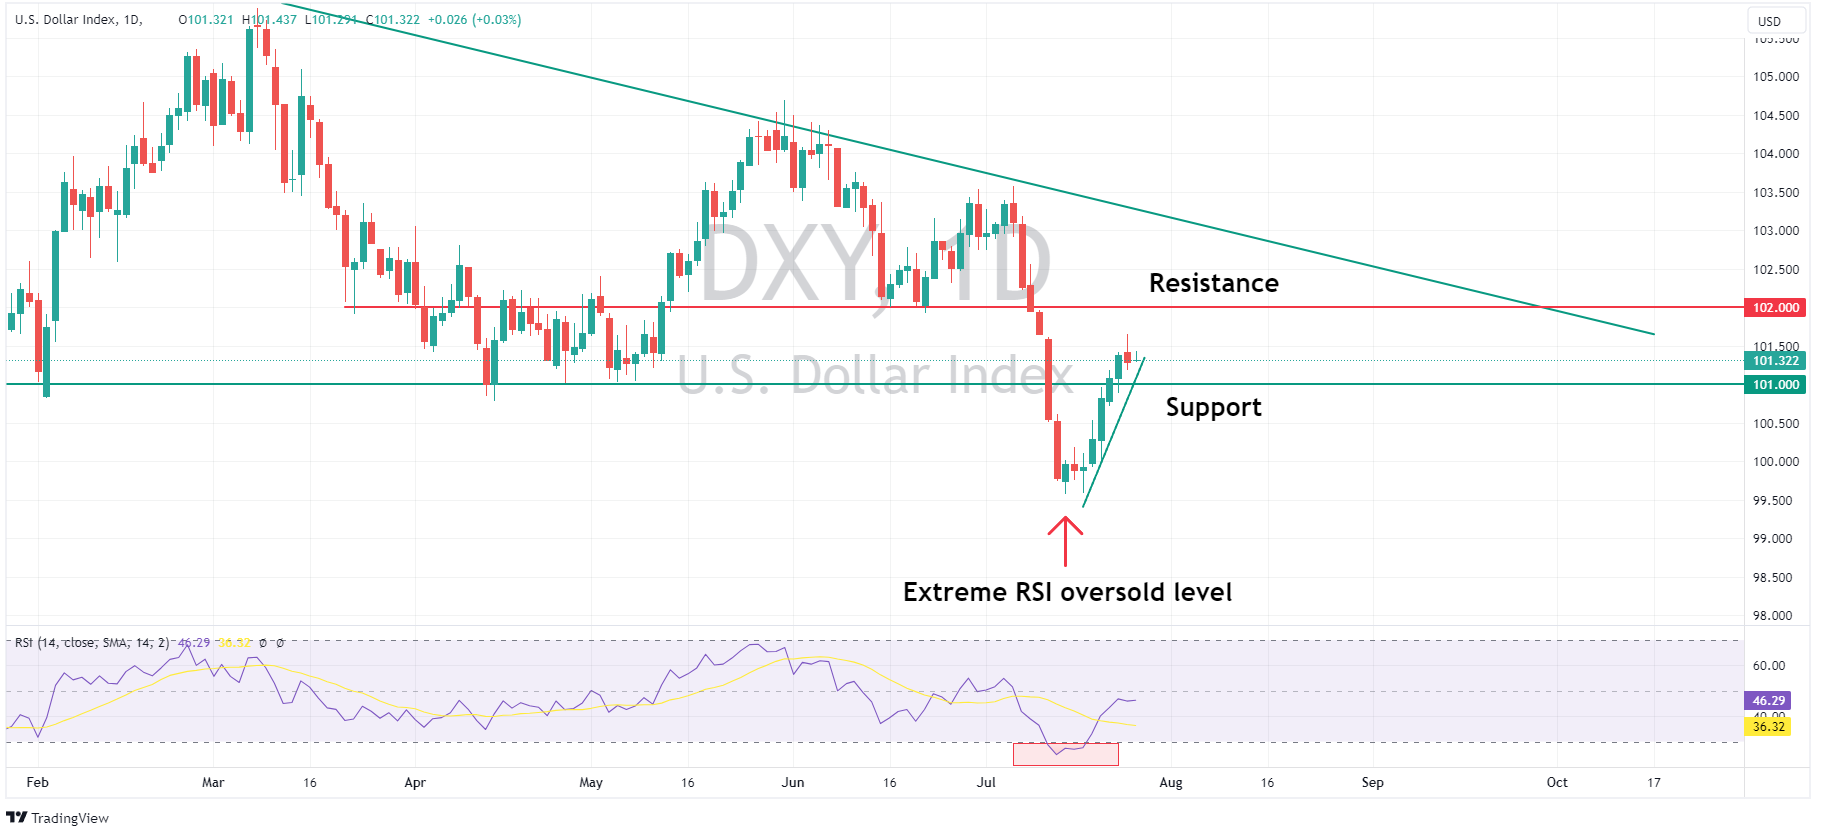
DXY – The US Dollar Index
It’s been straight up since mid-July after DXY bounced from extreme oversold levels, breaking through and holding the key S/R (and psychological) 101 level, which has held as support in the last couple of sessions. Despite this recent rally DXY is still in the oversold half of it’s daily RSI, a hawkish Fed pushing back against the market today would likely see DXY push to test the next major S/R level at 102.
A dovish Fed could see the recently established support at 101 seriously tested. In my opinion there is more chance of an upside surprise, given the market seems to be leaning towards pricing in a Powell capitulation.
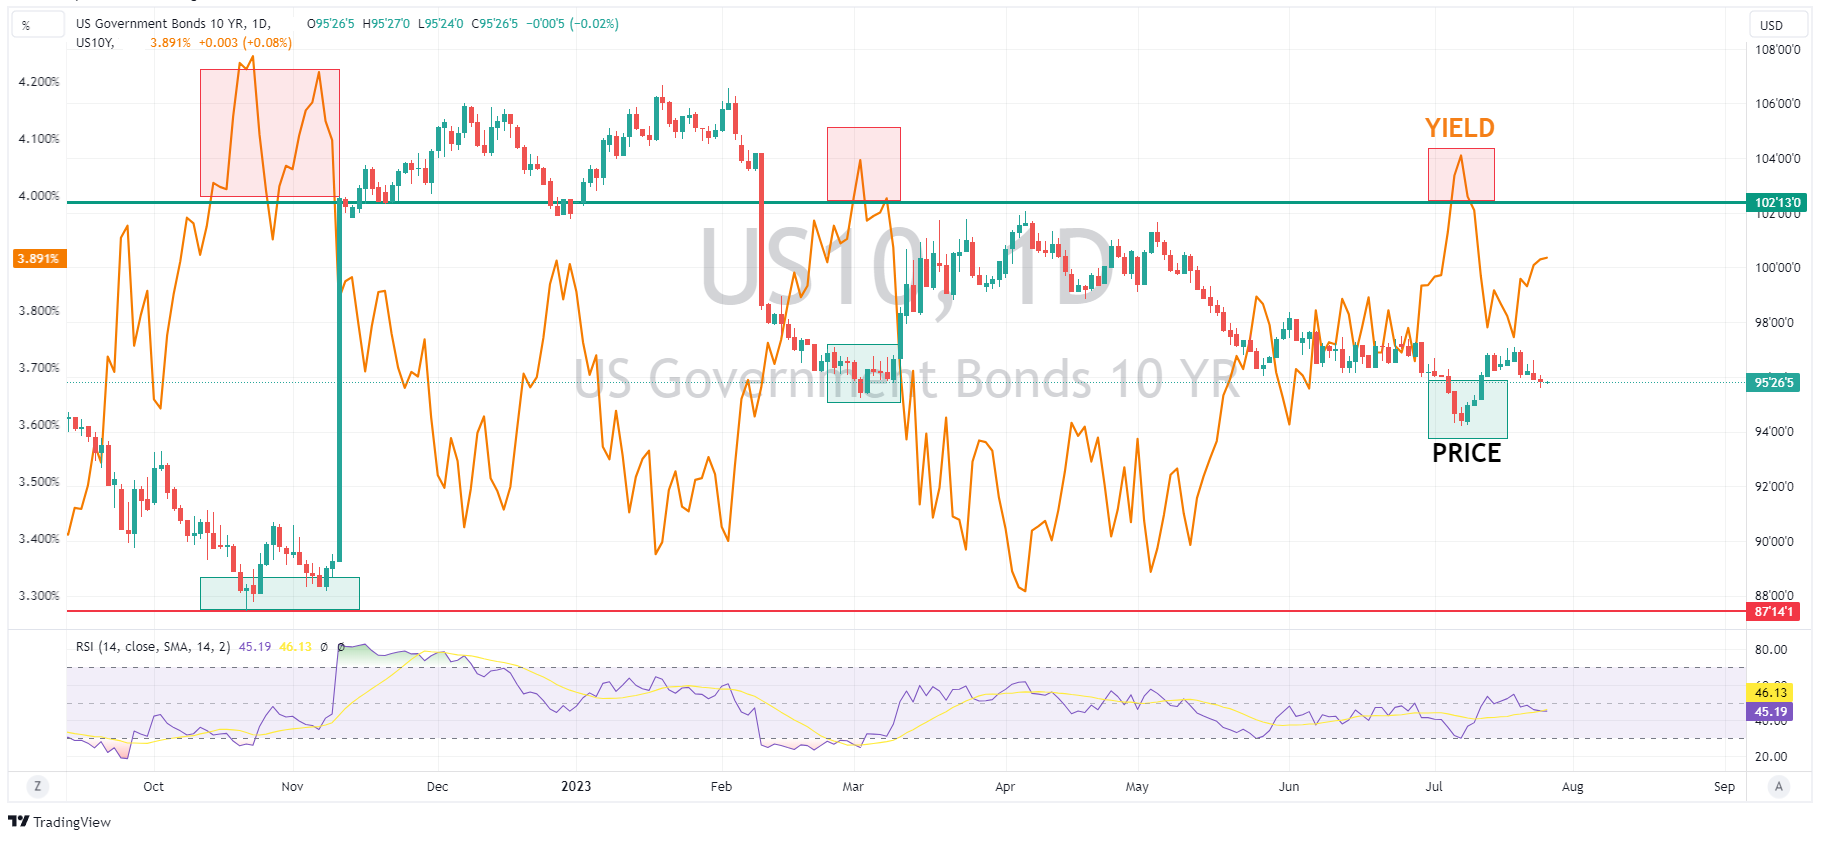
US 10-year government bonds
Government bonds are an asset. I think a lot of CFD traders are missing great opportunities in, in the current climate of rates and inflation taking center stage they are one of my favourite markets to trade with some great range trading opportunities.
Looking at the chart of the US 10-year with the yields superimposed to see the negative correlation between the two (when you trade bonds, you trade the price, not yield) Over the last twelve months the yield on the 10-year has tested and subsequently struggled to stay above 4%, this turn lower in yields at this level gives a bond trader an opportunity by buying the bond price. Todays FOMC should see some volatility in yields, I recommend keeping an eye on these over the coming days for some good trading opportunities as yields hit pivotal levels.
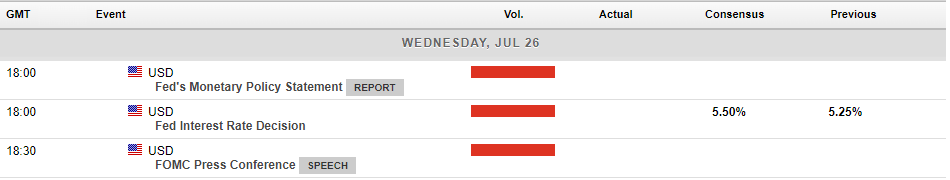
Today’s FOMC decision is due out at 18:30 GMT
Ready to start trading?
The information provided is of general nature only and does not take into account your personal objectives, financial situations or needs. Before acting on any information provided, you should consider whether the information is suitable for you and your personal circumstances and if necessary, seek appropriate professional advice. All opinions, conclusions, forecasts or recommendations are reasonably held at the time of compilation but are subject to change without notice. Past performance is not an indication of future performance. Go Markets Pty Ltd, ABN 85 081 864 039, AFSL 254963 is a CFD issuer, and trading carries significant risks and is not suitable for everyone. You do not own or have any interest in the rights to the underlying assets. You should consider the appropriateness by reviewing our TMD, FSG, PDS and other CFD legal documents to ensure you understand the risks before you invest in CFDs. These documents are available here.
#Interest #Rates #Fed #InterestRates #Banks #Banking #FinTechNext Article
Crude Realities: The extent of OPEC’s influence on financial markets
OPEC stands for the Organization of the Petroleum Exporting Countries. Founded in 1960, OPEC's main objective is to coordinate and unify the petroleum policies of its member countries to secure fair and stable prices for petroleum producers. This article briefly outlines who this organisation is and their significant influence on the pricing o...
July 28, 2023Read More >Previous Article
Gold eases heading into FOMC
After a fortnight of trending north, Gold has fallen over the past 5 days. It is currently trading at around $1960, showing a slight decline of approx...
July 26, 2023Read More >
- CFD Trading
- CFD Trading
- CFD Trading
- CFD Markets
- CFD Markets
- Accounts
- Accounts
- Platforms & tools
- Platforms & tools
- Platforms
- Platforms
- Premium trading tools
- Premium trading tools
- Education
- Education
- Resources
- Resources
- Help & support
- Help & support
- About
- About
- Client support