- Accounts
- About
- Trading
- Platforms
- Tools
- News & education
- News & education
- News & analysis
- Education hub
- Economic calendar

News & Analysis
Market Analysis 10-14 April 2023
11 April 2023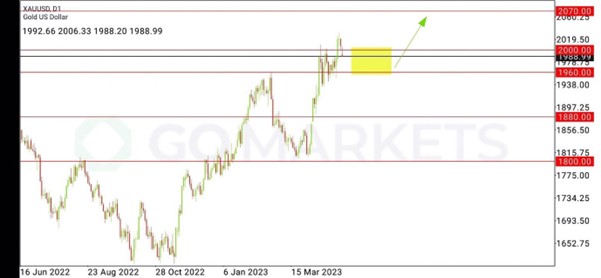
XAUUSD Analysis 10 – 14 April 2023
The gold price outlook is positive in the medium term. As last week’s closing of the buying bar was above the 1960 support or the latest high in price on the Weekly timeframe, it indicates continued buying momentum that will allow the price of gold to recover. It can rise further to test the 2070 resistance level, which is a key resistance at the weekly time frame level or the price level that gold has ever hit the most in history.
But even so, the price of gold remains negative in the short term. There may be a fall to adjust the consolidation or sideways around the 1985 and 1976 support, which are important support levels in the H4 and H1 timeframes that are worth watching. because if the price cannot go down deeper than the above two support levels The direction of gold prices is likely to continue to rise. Corresponds to the large timeframe in the medium term where the price is Up Trend.
And in the event that the price of gold cannot continue to rise, but there is a breakout of the 1985 and 1976 support levels, it can come down with continuous selling pressure. Daytime support at the 1960 price level or the latest price high in the Weekly timeframe are the next targets to watch.
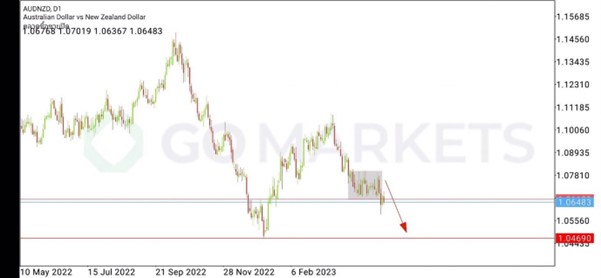
AUDUSD Analysis 10 – 14 April 2023
AUDNZD price bears a negative view on the short and medium term. Due to the continuous decline in the Weekly timeframe, the price is likely to bear down and can continue to fall.
After the price has corrected sideways on the Daily timeframe, when looking at the H4 timeframe, a sharp swing of the price can be seen, which is a sideways movement between support 1.06730 and resistance 1.07930. Rara then broke out the support 1.06730 down with a sell candlestick with more momentum than a buy candlestick. Therefore, it can be expected that Price may continue to decline to retest the support 1.04690 or the previous Low on the Weekly timeframe.
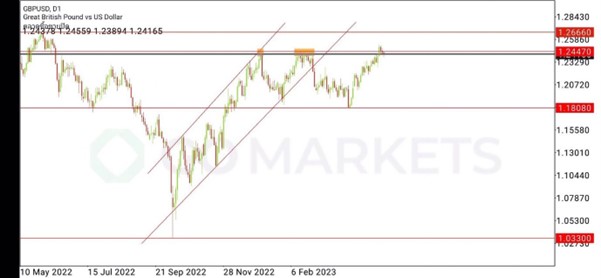
GBPUSD Analysis 10 – 14 April 2023
The GBPUSD trend is currently rallying to test the 1.24470 resistance with continued buying momentum as seen by the weekly timeframe buying pressure candlestick, although last week’s closing price was truncated. Any intestine dumper Still, the price has yet to show a strong sell candle on the Weekly timeframe, indicating a clear uptrend in both the short and medium term.
Forecasting that price, there is a tendency for the price to correct sideways at the 1.24470 resistance area before rising to test the next resistance at 1.26660 on the daily timeframe level, where the key support is 1.22700, which is the time level support. The H4 frame predicts that the price may retrace to test. If the price cannot stand on the resistance of 1.24470 and continue to rise
Disclaimer: Articles are from GO Markets analysts and contributors and are based on their independent analysis or personal experiences. Views, opinions or trading styles expressed are their own, and should not be taken as either representative of or shared by GO Markets. Advice, if any, is of a ‘general’ nature and not based on your personal objectives, financial situation or needs. Consider how appropriate the advice, if any, is to your objectives, financial situation and needs, before acting on the advice. If the advice relates to acquiring a particular financial product, you should obtain and consider the Product Disclosure Statement (PDS) and Financial Services Guide (FSG) for that product before making any decisions.
Next Article
US stocks choppy in a low volatility session ahead of pivotal CPI and FOMC minutes
US equities traded in tight ranges in a low volume session as traders remained cautious ahead of Wednesdays pivotal CPI figure out the US, followed by the release of FOMC minutes a few hours later. Major indices eventually finished mixed with the defensive Dow and recently battered Russell 2000 finishing in the green, whilst the S&P500 and N...
April 12, 2023
Read More >
Previous Article
FX analysis – USDJPY – Yield differentials pushing this pair higher
USDJPY The USDJPY is on the march higher again after a better than expected Non-Farm payroll figure on Friday saw sentiment shift hawkishly toward ...
April 11, 2023
Read More >