AI Stocks Tumble, The Big Case for Tariffs, and Shutdown Makes History
GO Markets
6/11/2025
•
0 min read
Share this post
Copy URL
Artificial intelligence stocks have begun to waver slightly, experiencing a selloff period in the first week of this month. The Nasdaq has fallen approximately 2%, wiping out around $500 billion in market value from top technology companies.
Palantir Technologies dropped nearly 8% despite beating Wall Street estimates and issuing strong guidance, highlighting growing investor concerns about stretched valuations in the AI sector.
Nvidia shares also fell roughly 4%, while the broader selloff extended to Asian markets, which experienced some of their sharpest declines since April.
Wall Street executives, including Morgan Stanley CEO Ted Pick and Goldman Sachs CEO David Solomon, warned of potential 10-20% drawdowns in equity markets over the coming year.
And Michael Burry, famous for predicting the 2008 housing crisis, recently revealed his $1.1 billion bet against both Nvidia and Palantir, further pushing the narrative that the AI rally may be overextended.
As we near 2026, the sentiment around AI is seemingly starting to shift, with investors beginning to seek evidence of tangible returns on the massive investments flowing into AI, rather than simply betting on future potential.
However, despite the recent turbulence, many are simply characterising this pullback as "healthy" profit-taking rather than a fundamental reassessment of AI's value.
Supreme Court Raises Doubts About Trump’s Tariffs
The US Supreme Court heard arguments overnight on the legality of President Donald Trump's "liberation day" tariffs, with judges from both sides of the political spectrum expressing scepticism about the presidential authority being claimed.
Trump has relied on a 1970s-era emergency law, the International Emergency Economic Powers Act (IEEPA), to impose sweeping tariffs on goods imported into the US.
At the centre of the case are two core questions: whether the IEEPA authorises these sweeping tariffs, and if so, whether Trump’s implementation is constitutional.
Chief Justice John Roberts and Justice Amy Coney Barrett indicated they may be inclined to strike down or curb the majority of the tariffs, while Justice Brett Kavanaugh questioned why no president before Trump had used this authority.
Prediction markets saw the probability of the court upholding the tariffs drop from 40% to 25% after the hearing.
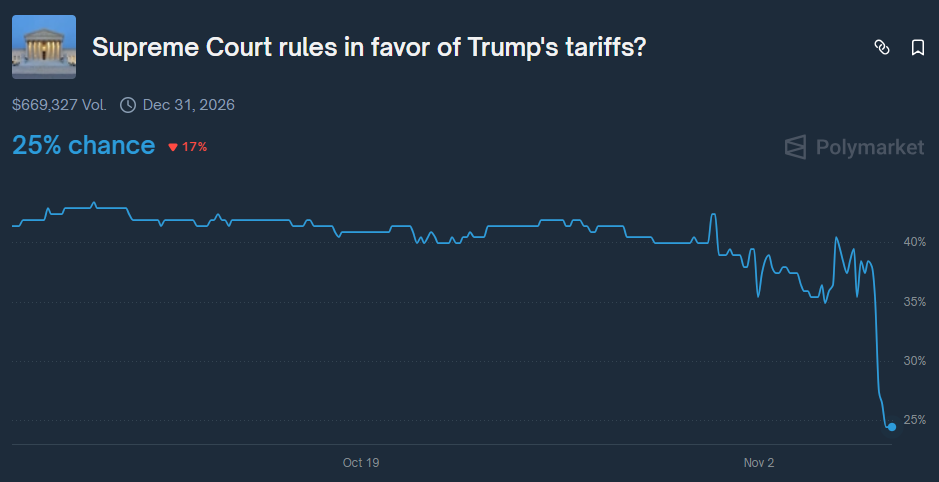
Polymarket odds on Supreme Court upholding Trump's tariffs
The US government has collected $151 billion from customs duties in the second half of 2025 alone, a nearly 300% increase over the same period in 2024.
Should the court rule against the tariffs, potential refunds could reach approximately $100 billion.
The court has not indicated a date on which it will issue its final ruling, though the Trump administration has requested an expedited decision.
Shutdown Becomes Longest in US History
The US government shutdown entered its 36th day today, officially becoming the longest in history. It surpasses the previous 35-day record set during Trump's first term from December 2018 to January 2019.
The Senate has failed 14 times to advance spending legislation, falling short of the 60-vote supermajority by five votes in the most recent vote.
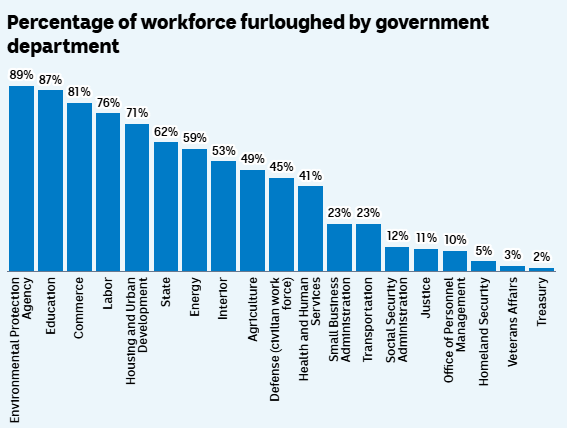
So far, approximately 670,000 federal employees have been furloughed, and 730,000 are currently working without pay. Over 1.3 million active-duty military personnel and 750,000 National Guard and reserve personnel are also working unpaid.
SNAP food stamp benefits ran out of funding on November 1 — something 42 million Americans rely on weekly. However, the Trump administration has committed to partial payments to subsidise the benefits, though delivery could take several weeks.
Flight disruptions have affected 3.2 million passengers, with staffing shortages hitting more than half of the nation's 30 major airports. Nearly 80% of New York's air traffic controllers are absent.
From a market perspective, each week of shutdown reduces GDP by approximately 0.1%. The Congressional Budget Office estimates the total cost of the shutdown will be between $7 billion and $14 billion, with the higher figure assuming an eight-week duration.
Consumer spending could drop by $30 billion if the eight-week duration is reached, according to White House economists, with potential GDP impacts of up to 2 percentage points total.
By
GO Markets
The information provided is of general nature only and does not take into account your personal objectives, financial situations or needs. Before acting on any information provided, you should consider whether the information is suitable for you and your personal circumstances and if necessary, seek appropriate professional advice. All opinions, conclusions, forecasts or recommendations are reasonably held at the time of compilation but are subject to change without notice. Past performance is not an indication of future performance. Go Markets Pty Ltd, ABN 85 081 864 039, AFSL 254963 is a CFD issuer, and trading carries significant risks and is not suitable for everyone. You do not own or have any interest in the rights to the underlying assets. You should consider the appropriateness by reviewing our TMD, FSG, PDS and other CFD legal documents to ensure you understand the risks before you invest in CFDs. These documents are available here. Any references to Australian or international shares, sectors, indices, ETFs, crypto-related stocks or other instruments are provided for market commentary and watchlist purposes only and do not constitute a recommendation, offer or solicitation to buy, sell or hold any financial product or adopt any investment strategy. International markets may involve additional risks, including currency fluctuations, regulatory differences, market structure differences, reduced liquidity and higher volatility. Company-specific, sector-specific and macroeconomic risks may also affect performance.
Commentary on geopolitical developments, economic data, central bank decisions, earnings, policy changes and other global or financial market events is based on information available at the time of publication and may change without notice. Such events can lead to sudden market moves, price gaps, reduced liquidity, wider spreads and increased volatility, particularly in leveraged products such as CFDs. Forward-looking statements, expectations and scenario analysis are inherently uncertain and should not be relied on as guarantees of future market behaviour or outcomes.
Tuesday, 12 May 2026, at roughly 7:30 pm AEST, Treasurer Jim Chalmers will stand up in Canberra and deliver the 2026-27 Federal Budget. According to Budget.gov.au, that is when the Budget is officially released, with the Budget papers going live online at the same time.
For US retailers and consumer brands, the first hit is usually margin. Import costs rise before pricing power does. Companies can try to pass those costs on, but customers may resist higher prices, especially if household budgets are already stretched. Existing inventory can also soften the first blow, which means the initial earnings result may look manageable while the next one carries the real pressure.
Tariffs, earnings and the Asia versus US split | GO Markets
Same tariff. Different earnings hit.
That is the key split for traders watching this earnings season. The US side is mainly about margin timing. The Asia side is about demand sensitivity. Not every export sector carries the same level of US demand risk.
TL;DR
US companies may face margin pressure as tariffed inventory moves through earnings.
Asian exporters may face volume pressure if US buyers reduce orders.
The timing is different: US retailers may feel the impact later, while Asian exporters may see it earlier through weaker order books.
Textiles, apparel and basic consumer goods are likely more sensitive to US demand.
Semiconductors and AI hardware may be less directly exposed to US consumers, but still carry policy, capex and valuation risk.
The big picture
Tariffs are paid at the US border by importers. From there, the cost can move through the system in several ways: higher prices, weaker margins, lower supplier prices, lower demand or a mix of all four.
Research cited by the Kiel Institute and New York Fed suggests US buyers and businesses may be absorbing a significant share of the tariff burden. That matters because it changes where the earnings pressure shows up first.
For a US retailer, the problem is straightforward but uncomfortable. If the company raises prices, demand may weaken. If it absorbs the tariff cost, margins may compress. If it still has older inventory, the hit may not show up immediately.
For an Asian exporter, the pressure can arrive through a different channel. If US buyers become cautious, they may order less. The exporter may keep prices relatively stable, but factory utilisation falls, fixed costs are spread across fewer units and earnings pressure builds.
That is why this is not just a tariff story. It is an earnings timing story.
US companies: the margin problem
The US side of the tariff story is about cost absorption.
Retailers, apparel brands, consumer electronics sellers and appliance companies often rely on imported goods, components or packaging. When tariff costs rise, they may try to protect margins through price increases, supplier negotiations, sourcing changes or inventory management.
The challenge is that none of these are clean solutions.
Price increases can test consumer demand. Supplier negotiations may take time. Sourcing changes can be expensive or slow. Inventory timing can make the first result look better than the underlying cost trend.
This is why earnings calls matter. Management commentary around pricing actions, tariff mitigation, sourcing, vendor negotiations and inventory timing may reveal more than headline sales growth.
What to watch on the US side
These signals may provide useful context in upcoming earnings reports:
If margins hold while sales remain stable, companies may be managing the pressure. If sales rise but margins fall, tariff costs may not be passing through cleanly. If guidance becomes more cautious, the market may start pricing a delayed earnings impact.
Asian exporters: the volume problem
The Asia side is not always about exporters cutting prices.
In many categories, Asian suppliers operate in competitive global markets with limited pricing power. If US buyers reduce orders, exporters may feel the impact through lower volumes rather than lower unit prices.
That distinction matters.
A company can report stable prices and still face earnings pressure if factories are running below normal utilisation. Lower volumes can reduce operating leverage, delay capital expenditure and weaken guidance.
The highest-risk sectors are usually those most closely tied to US retail demand, seasonal buying cycles and low-margin production.
Which Asian sectors are most exposed?
1. Textiles and apparel +
Highest Sensitivity
Textiles and apparel are among the clearest examples of US demand exposure.
These exporters are often tied directly to US retail orders, private-label contracts and seasonal buying cycles. If US retailers turn cautious, orders can be delayed, reduced or cancelled relatively quickly.
Risk is higher because margins are often thin, production is labour-intensive and buyers may have more power in negotiations.
Relevant export markets: Vietnam, Bangladesh, India, Indonesia and parts of China.
2. Basic consumer goods +
High Sensitivity
This includes toys, household goods, furniture, simple appliances and other discretionary or semi-discretionary exports.
These categories are exposed when US retailers reduce inventory or when consumers pull back from non-essential spending. Tariffs can add pressure if buyers try to push costs back onto suppliers.
Relevant export markets: China, Vietnam, Thailand, Malaysia and Indonesia.
3. Electronics assembly +
Medium to High Sensitivity
Electronics assembly is more mixed.
Lower-end consumer electronics can be sensitive to US household demand. Higher-value components or enterprise-linked electronics may be more resilient, depending on end-market exposure.
This sector can also be harder to read because supply chains are complex. A company may look like a technology exporter, but its actual earnings sensitivity may still depend on US consumer replacement cycles.
Relevant export markets: China, Vietnam, Malaysia, Thailand, Taiwan and the Philippines.
4. Machinery and industrial goods +
Medium Sensitivity
Machinery is less directly tied to US consumer demand than apparel or household goods. The risk is more about business investment.
If US companies delay capital expenditure because tariff uncertainty rises, machinery orders may weaken. However, order books can provide some buffer, and specialised products may have more pricing power.
Relevant export markets: Japan, South Korea, China, Taiwan and Singapore.
5. Semiconductors +
Lower Direct Sensitivity
Semiconductors are less directly exposed to US retail demand than textiles or consumer goods. Demand is often tied to broader technology cycles, autos, industrials, cloud infrastructure and AI investment.
That does not make the sector risk-free. Tariffs, export controls, geopolitics and a weaker global capex cycle can still affect earnings expectations.
Relevant export markets: Taiwan, South Korea, Malaysia, Singapore and parts of China.
6. AI hardware and data-centre supply chains +
Lowest Direct Sensitivity
AI hardware is more tied to cloud capital expenditure and data-centre buildouts than day-to-day consumer spending.
The risk is different. It is less about US shoppers buying fewer goods and more about whether AI capex expectations remain realistic, whether policy restrictions expand and whether valuations already price in strong growth.
Relevant export markets: Taiwan, South Korea, Malaysia and advanced electronics supply-chain hubs.
A simple sector risk map
Sensitivity Analysis
Indicative Asian exporter sensitivity to US consumer demand
Note: This is a general framework only. Sensitivity may vary by company, customer mix, contract structure and end market exposure.
Why timing matters
The US and Asia timelines may not line up.
A US retailer may still be selling older inventory, so the tariff impact can be delayed. Margins may hold in one quarter, then weaken as new tariffed inventory becomes a larger share of the sales mix.
An Asian exporter may see the pressure earlier if US buyers reduce orders before the cost hit appears in US consumer prices.
That creates a split earnings map:
US side: delayed margin pressure.
Asia side: earlier volume pressure.
Policy side: tariff exemptions, pauses or escalations can change the setup quickly.
The mistake is assuming a clean and immediate tariff impact. A strong US retailer result does not automatically mean tariff pressure is gone. It may only mean older inventory is still flowing through. A stable Asian exporter margin does not automatically mean demand is healthy. Volumes may be weakening beneath the surface.
The trap in the earnings season
What to watch next
On the US side, gross margins, inventory commentary, same-store sales and second-half guidance may provide useful context.
On the Asia side, export volumes, factory utilisation, order backlogs, working capital and capital expenditure guidance may be more relevant.
Across both regions, tariff policy remains the swing factor. Exemptions, pauses or new restrictions could quickly change market expectations.
Sector charts may provide additional context on whether market pricing is aligning with the earnings narrative, but they should be read alongside company commentary and macro data from the economic calendar.
FAQ
Frequently asked questions
How do tariffs affect US companies and Asian exporters differently? +
Tariffs may affect US companies through margin pressure and Asian exporters through volume pressure. US companies may face higher import costs, while Asian exporters may face fewer orders from US buyers.
Which Asian export sectors are most exposed to US demand? +
Textiles, apparel and basic consumer goods are generally more exposed to US demand because they are closely tied to retail orders and consumer spending. Electronics assembly and machinery are moderately exposed, while semiconductors and AI hardware may be less directly exposed.
Why can tariff impacts show up later in retailer earnings? +
Retailers may still be selling older inventory purchased before tariffs applied. The impact may become more visible later as new tariffed inventory moves through sales and margins.
What should investors watch in tariff-related earnings reports? +
General signals include gross margins, inventory commentary, same-store sales, export volumes, factory utilisation, order backlogs and management commentary on pricing or sourcing.
Are semiconductors and AI hardware exposed to tariffs? +
They may be less directly exposed to US consumer demand, but they can still be affected by policy restrictions, export controls, global capex cycles and valuation expectations.
Bottom Line
The tariff story is no longer only about who pays. It is about where the earnings pressure shows up first.