- CFD trading
- CFD trading
- Markets
- Markets
- Accounts
- Accounts
- Platforms
- Platforms
- Premium trading tools
- Premium trading tools
- Share trading
- Share trading
- Invest in shares
- Invest in shares
- Downloads
- Downloads
- Education
- Education
- Resources
- Resources
- Courses
- Courses
- Help & support
- Help & support
- About
- About
- Client support
- CFD trading
- CFD trading
- Markets
- Markets
- Accounts
- Accounts
- Platforms
- Platforms
- Premium trading tools
- Premium trading tools
- Share trading
- Share trading
- Invest in shares
- Invest in shares
- Downloads
- Downloads
- Education
- Education
- Resources
- Resources
- Courses
- Courses
- Help & support
- Help & support
- About
- About
- Client support
 News & analysis
The Week Ahead – FOMC, ECB, BoE – the charts to watch XAUUSD , DXY
11 December 2023Markets enter the new week with serious risk-on momentum, having seen US equities finishing the last 6 weeks with gains, but ahead we have a massive week in data that could put that narrative to the test.
A lot of this positivity in risk assets has come on the back or markets pricing in dovish pivots from the Fed and other major central banks and with the Federal Reserve, European Central Bank and Bank of England all delivering rate decisions this week we’ll be finding out if the central banks agree with this or push back.
All three banks are expected to hold rates, so it will be the forward guidance that will move the markets with the Fed also due to release an updated Summary of Economic Projections, which includes its much discussed “dot plot”. Traders will also be watching for any clues from both the BoE and ECB statements and pressers for talks of pushback against dovish market expectation in regard to future rate cuts, or not. Adding to mix we also US CPI and PPI readings, European manufacturing and PMIs and UK GDP figures among other news releases to keep traders busy.
Charts to watch:
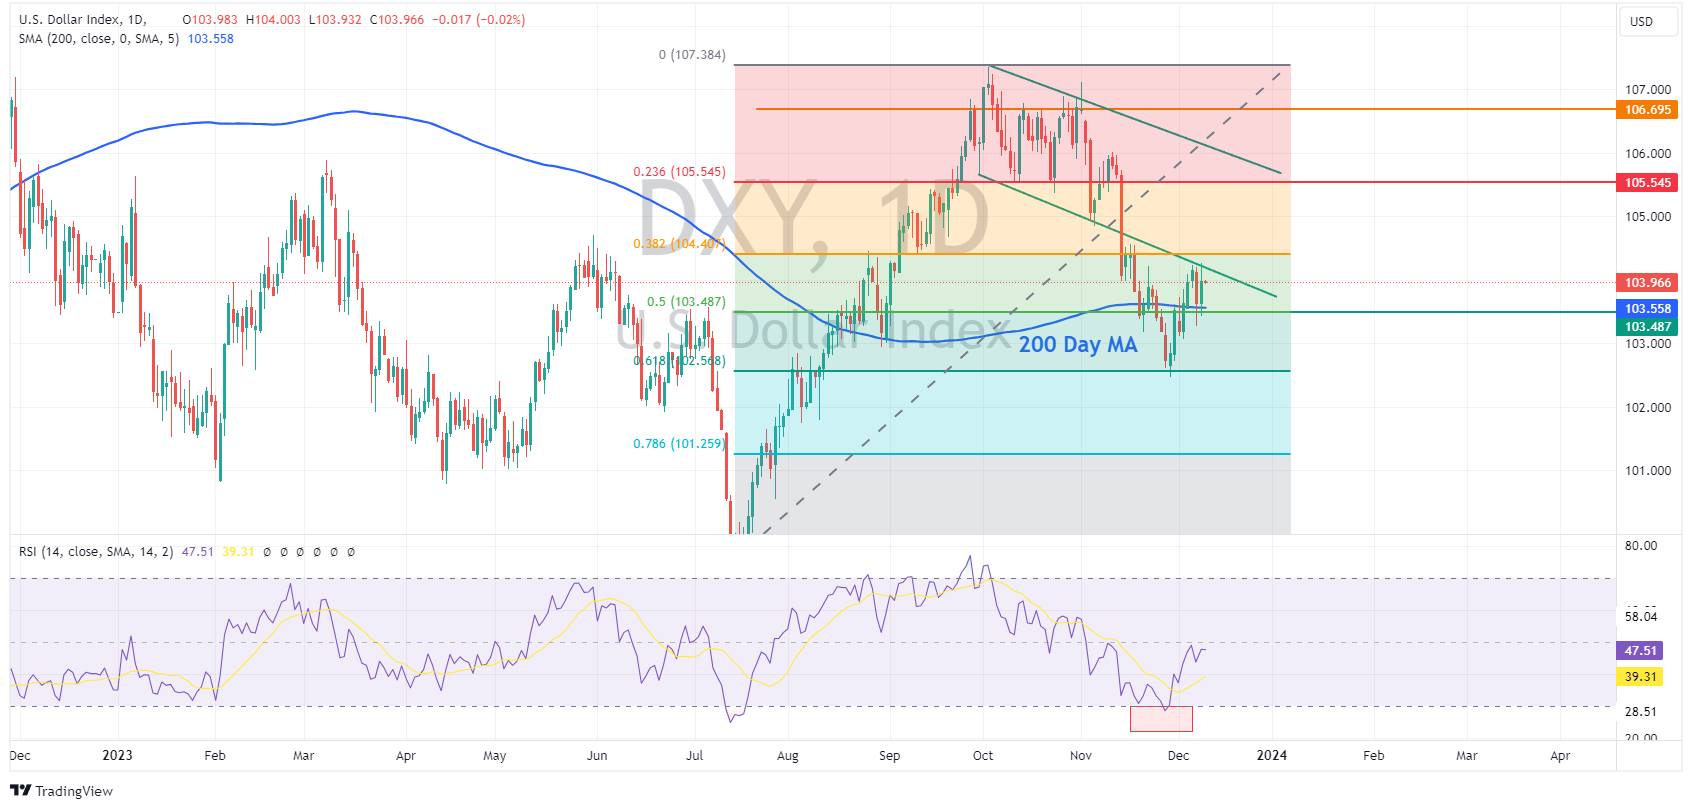
The US Dollar index (DXY)
DXY has December so far retracing some of the steep losses from November where the index fell from 107 to a low of 102.50 as FX traders started piling on bets of a more dovish Federal Reserve going forward. December saw a strong bounce off the 61.8 Fib level and an extreme oversold RSI reading to retake and find support at the 200 Day SMA. DXY is currently trading in a with key technical levels both to the up and downside in close proximity, this week’s data could conceivably test them all.
Key level to downside is the support at the 200-day SMA and 50% Fib level are around 103.50, to the upside the trendline and 38.2 Fib level resistance at around the 104.40 area.
Major figures to watch for: US CPI, US Retail Sales, US PPI, FOMC meeting.
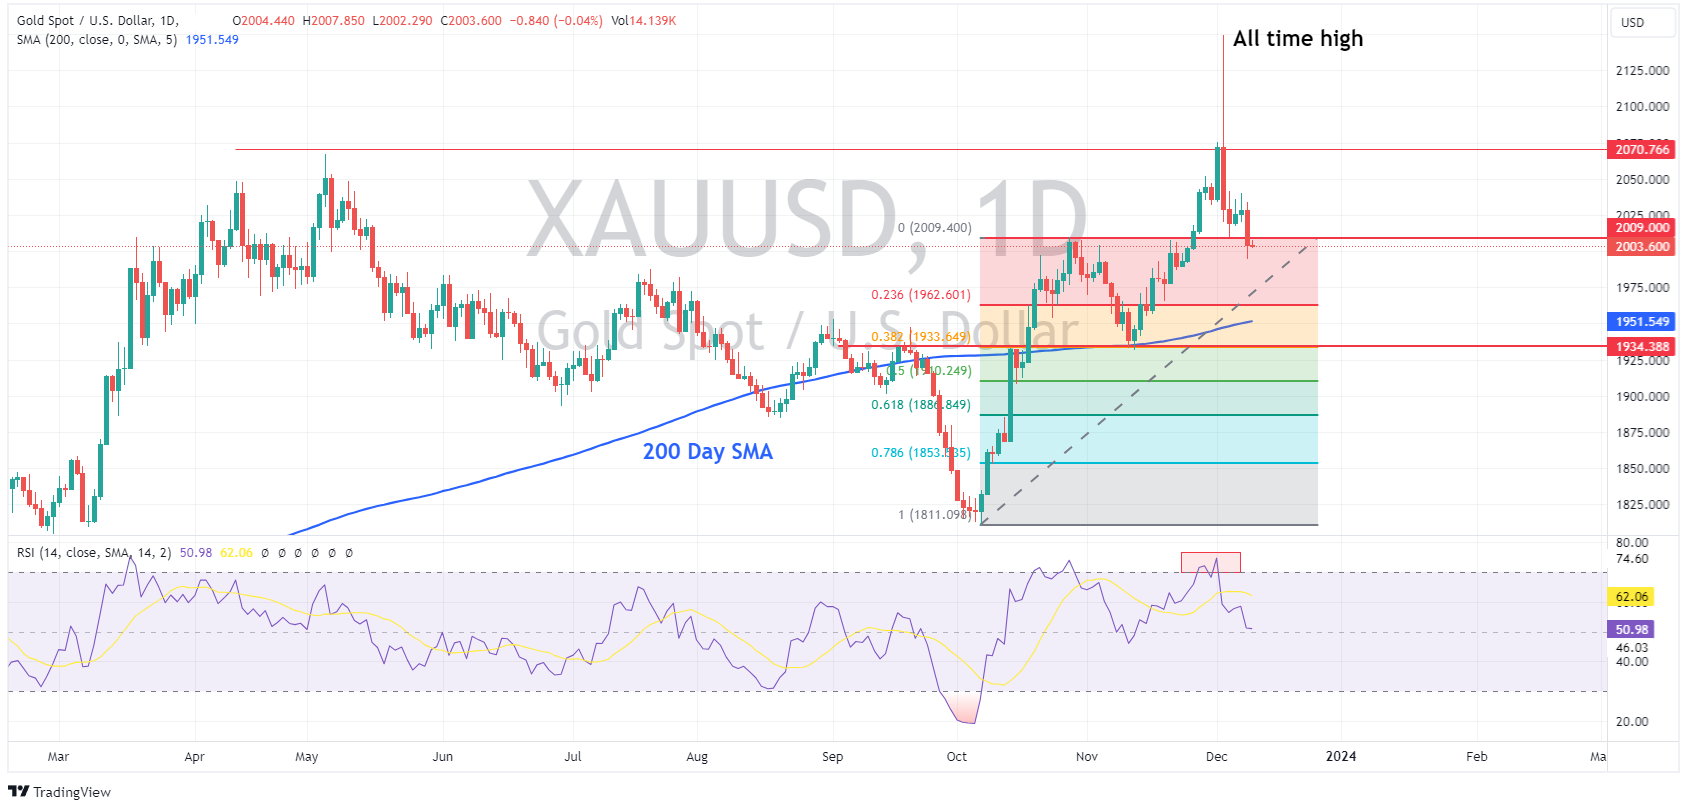
XAUUSD
Gold surged higher at market open last Monday to hit all-time highs before reversing sharply and falling for the rest of the week. The key level resistance turned support of 2009 USD an ounce was breached with gold entering the new week on the back foot.
With a big week ahead of interest rate and USD moving data, gold traders will need to be on their toes, 2009 is still the key level, a break and re-establishment of this support level will be needed to see another leg higher in gold. If it holds again as resistance a further push lower to test the 200 day SMA at around 1950 and November swing low at 1935 could be on the cards for the precious metal.
Full calendar of this week’s major economic releases at the link below:
Ready to start trading?
The information provided is of general nature only and does not take into account your personal objectives, financial situations or needs. Before acting on any information provided, you should consider whether the information is suitable for you and your personal circumstances and if necessary, seek appropriate professional advice. All opinions, conclusions, forecasts or recommendations are reasonably held at the time of compilation but are subject to change without notice. Past performance is not an indication of future performance. Go Markets Pty Ltd, ABN 85 081 864 039, AFSL 254963 is a CFD issuer, and trading carries significant risks and is not suitable for everyone. You do not own or have any interest in the rights to the underlying assets. You should consider the appropriateness by reviewing our TMD, FSG, PDS and other CFD legal documents to ensure you understand the risks before you invest in CFDs. These documents are available here.
#Economy #Economics #Finance #MarketsNext Article
Oracle revenue falls short of Wall Street estimates – the stock is falling
US software and hardware manufacturer, Oracle Corporation (NYSE: ORCL), announced results for its fiscal 2024 second quarter after the market close on Monday. Company overview Founded: June 16, 1977 Headquarters: Austin, Texas, United States Number of employees: 164,000 (2023) Industry: Enterprise software, business software, cloud...
December 12, 2023Read More >Previous Article
lululemon posts better-than-expected results
World’s second largest sporting goods company, lululemon athletica inc. (NASDAQ: LULU), released Q3 2023 financial results after the closing bell on...
December 8, 2023Read More >
- CFD trading
- CFD trading
- CFD trading
- Markets
- Markets
- Accounts
- Accounts
- Platforms
- Platforms
- Premium trading tools
- Premium trading tools
- Share trading
- Share trading
- Invest in shares
- Invest in shares
- Downloads
- Downloads
- Education
- Education
- Resources
- Resources
- Courses
- Courses
- Help & support
- Help & support
- About
- About
- Client support