- CFD trading
- CFD trading
- Markets
- Markets
- Accounts
- Accounts
- Platforms
- Platforms
- Premium trading tools
- Premium trading tools
- Share trading
- Share trading
- Invest in shares
- Invest in shares
- Downloads
- Downloads
- Education
- Education
- Resources
- Resources
- Courses
- Courses
- Help & support
- Help & support
- About
- About
- Client support
- CFD trading
- CFD trading
- Markets
- Markets
- Accounts
- Accounts
- Platforms
- Platforms
- Premium trading tools
- Premium trading tools
- Share trading
- Share trading
- Invest in shares
- Invest in shares
- Downloads
- Downloads
- Education
- Education
- Resources
- Resources
- Courses
- Courses
- Help & support
- Help & support
- About
- About
- Client support
 News & analysis
FX Analysis – USDJPY, and GOLD reaction after a surge in the Dollar
10 November 2023USD rallied strongly in Thursday’s session after a quiet start following dismal demand for US 30 year-treasuries at a scheduled bond auction, seeing yields surge and taking the USD with them. The push higher was later given an extra boost by Fed Chair Powell’s hawkish statements during a panel organized by the IMF.
In a scheduled panel chat the FOMC head said that “policymakers are not confident that they have achieved a sufficiently restrictive stance to return inflation to the 2.0% target in a sustained manner.” That was enough to see the USD bulls take charge with DXY up 0.4% for the day, while yields also spiked, this saw some volatility in USD cross pairs and gold we’ll look at the highlights in the charts below.
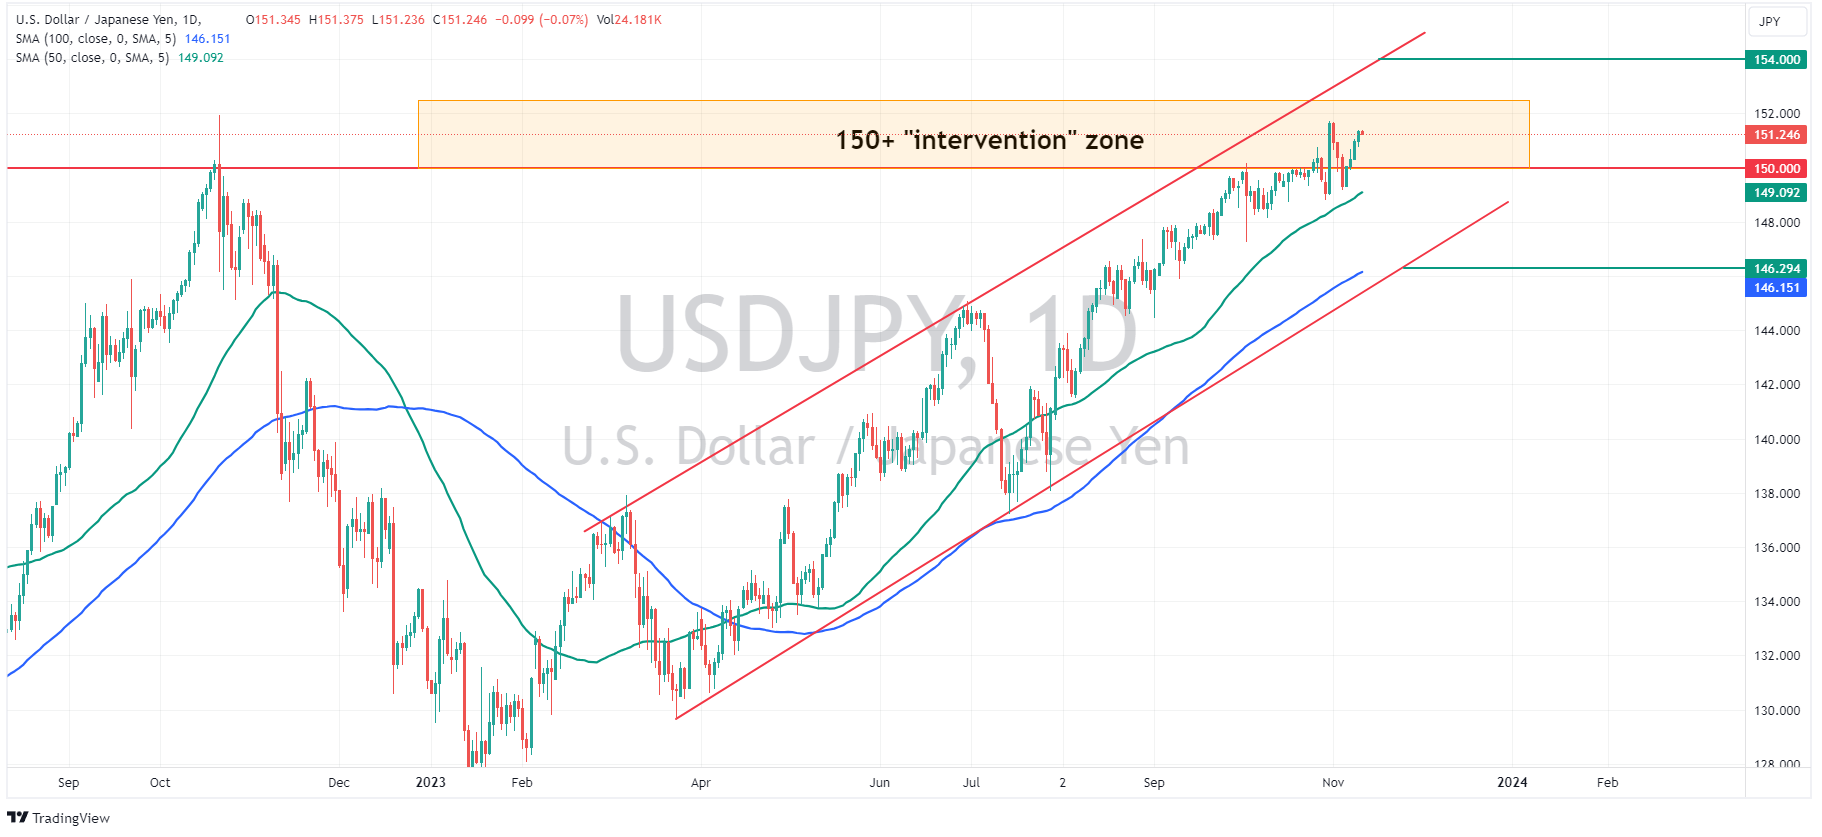
USDJPY TECHNICAL ANALYSIS
USDJPY pulled back last week after the BoJ tweak to their YCC saw Japanese bond yields rise, giving the Yen a boost. However, as has been the case with this pair in the last 12 months the uptrend quickly resumed, with USDJPY breaking back above the key 151 level and heading towards its 2022 and 2023 high of 151.72. At these levels there is always the threat of a BoJ currency intervention, so traders will need to keep an ear out for any jawboning from BoJ members telegraphing such a move.
If the BoJ steps aside a test of the upper trend line at 154 could be a possibility. If they do step in we could see a decline to a 146 handle and lower trendline before finding any technical support.
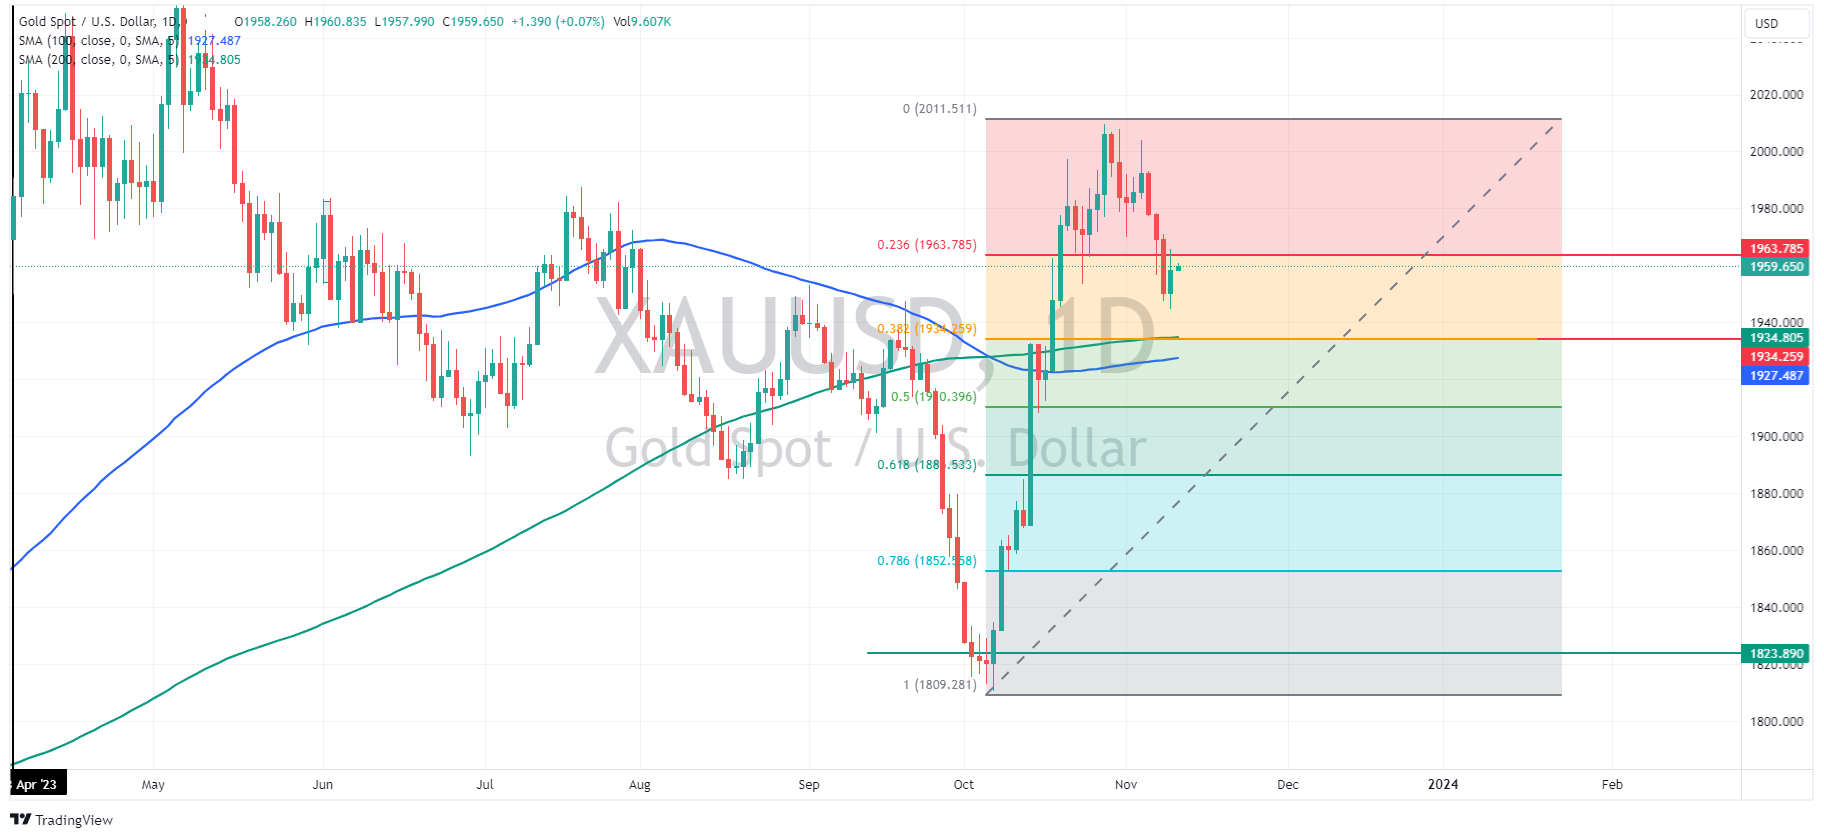
GOLD TECHNICAL ANALYSIS
Gold has reversed lower this week after the upward momentum failed at the key 2010 resistance level. Risk premium priced into gold also started to unwind after gaza conflict haven flows pushed the price rapidly higher from early October. Thursday session did see a modest bounce, despite a rampant USD which could give the bulls some hope, however the 23.6 Fib level, which acted as short-term support on the way down now seems to have switched to resistance. This will be the level on the upside to watch (1963.78), the next resistance from a technical point of view will be the 2010 level. To the downside the 38.2 Fib at 1934.79, which also matches up with the 200 day SMA looks to be the first real support level.
Ready to start trading?
The information provided is of general nature only and does not take into account your personal objectives, financial situations or needs. Before acting on any information provided, you should consider whether the information is suitable for you and your personal circumstances and if necessary, seek appropriate professional advice. All opinions, conclusions, forecasts or recommendations are reasonably held at the time of compilation but are subject to change without notice. Past performance is not an indication of future performance. Go Markets Pty Ltd, ABN 85 081 864 039, AFSL 254963 is a CFD issuer, and trading carries significant risks and is not suitable for everyone. You do not own or have any interest in the rights to the underlying assets. You should consider the appropriateness by reviewing our TMD, FSG, PDS and other CFD legal documents to ensure you understand the risks before you invest in CFDs. These documents are available here.
#Forex #ForexAnalysis #ForexBroker #ForexCharts #ForexMarket #ForexNews #ForexSignal #ForexTradingNext Article
Charts to watch in the week ahead – AUDUSD, USDOLLAR, GBPUSD
Last week’s action in the FX markets was shaped by a pushback by the Fed chair Jerome Powell and assorted other Fed members on markets pricing in a less hawkish Fed going forward. What was seen as a dovish FOMC and a big miss in NFP the week before saw traders piling back into risk assets with traders hoping for a less aggressive Fed, it seemed p...
November 13, 2023Read More >Previous Article
Global market recap: Asian-Pacific futures edge up after Wall Street’s decline.
The Asian-Pacific financial markets are bracing for a potentially modest opening on Friday, undeterred by the negative performance witnessed in US ind...
November 10, 2023Read More >
- CFD trading
- CFD trading
- CFD trading
- Markets
- Markets
- Accounts
- Accounts
- Platforms
- Platforms
- Premium trading tools
- Premium trading tools
- Share trading
- Share trading
- Invest in shares
- Invest in shares
- Downloads
- Downloads
- Education
- Education
- Resources
- Resources
- Courses
- Courses
- Help & support
- Help & support
- About
- About
- Client support