Trading FOREX, equities, commodities, and any other asset can be an emotional rollercoaster. With so many different emotions and external factors difficulties impacting a trade, it is crucial that before any trade is executed a trading plan is produced to minimise the impact of the ‘noise’. Generating the Idea The first step to any plan is to generate a trading idea.
Trade ideas, come from one of three sources. A fundamental source, a technical source, or a mix of both. What does this mean exactly?
Well, when generating ideas from a fundamental perspective, a trader can generate idea based on economic events, monetary policy from a Central bank or company relevant information just to name a few. From a technical perspective, a trader may find that an asset is trading near a potential support or resistance level or developing into a breakout pattern. Alternatively, the price may have touched an important moving average which indicates it may be ready to trade.
Traders can also put these ideas together to come up with even more robust trading ideas. Background economic factors and sector analysis Before entering a trade, a good trader should have at the very least a rudimentary understanding of the relevant sector or economic factors that may influence the trade. For example, a trader decides to trade the AUDUSD currency pair.
The trader has seen that the price is approaching a short-term support point and decides to buy the pair expecting the price to bounce of the level. However, the trader is not aware that the Federal Reserve has just increased interest rates which has increased the value of the USD. Consequently, the price goes against the trader.
Technical breakdown Prior to entering any trade, the trader should analyse the price chart and set up relevant support and resistance levels. This allows the trader to have a clear idea of key supply and demand zones for the asset before the emotions of the actual trade become prevalent. To effectively go about this step, support and resistance levels can be analysed on multiple time frames to gain an even greater edge. [caption id="attachment_272243" align="alignnone" width="2560"] Business Team Investment Entrepreneur Trading discussing and analysis graph stock market trading,stock chart concept[/caption] Entry condition Having a trade idea is one aspect however having a clear entry criterion will help reduce the impact of emotion when watching the trade unfold.
Some examples of potential entries conditions can be related to a break and retest of a certain level for an entry or waiting for a specific candlestick pattern. Furthermore, an entry may also be defined by a disproportionate increase in volume supporting a breakout. Exit Conditions Like determining entry conditions having pre planned exit points can improve the management of emotions during also trade whilst also enhancing risk management.
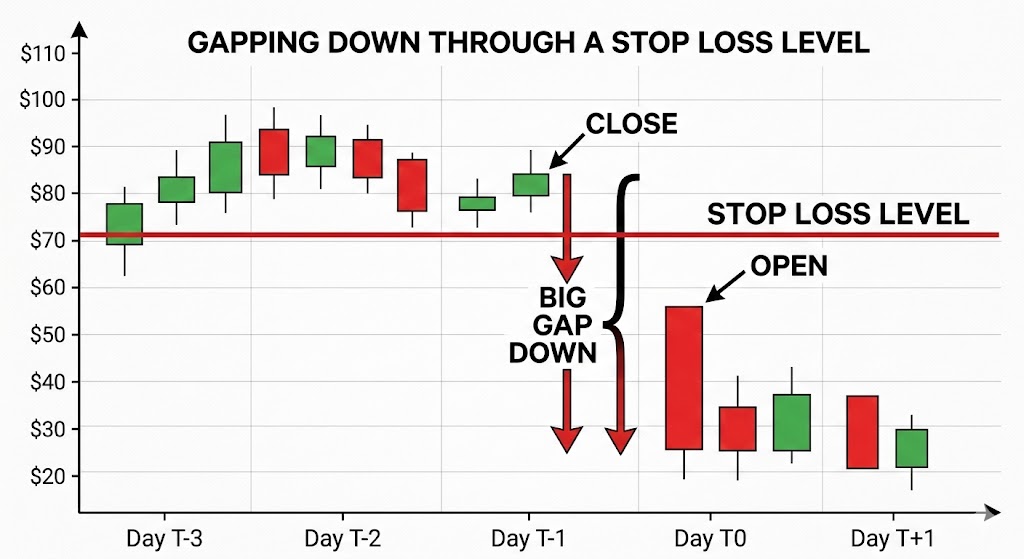
Setting take profit targets/stop loss areas will help ensure that a trade is well structured even before initiating the trade. Having pre-determined exit points can also help determine if a trade is worth entering in the first place as it allows for a determination of the potential risk reward before execution. Risk management No matter whether the trade is a scalp, swing trade or longer-term investment, each should have clear risk management guidelines.
Good risk management involves the use of stop losses and correct sizing of a trade. One method that can be effective is to have a maximum amount of the total account that you are willing to lose per trade. This could be a percentage figure or a fixed amount.
For example, if the total account size is $10,000 and you decide that the maximum loss per trade is 1%. This means that the maximum loss per trade would be $100. The next step is to then set stop loss.
The stop loss in many cases should be independent of the actual maximum risk amount. The stop loss level should be calculated before the sizing. Once the stop loss is set the size of the trade can be determined.
Risk management is perhaps the most crucial element of the trading plan because minimising losses is crucial to any long-term success in trading. Whilst having a clear trading plan will not guarantee success it will help remove many behavioral biases that can impact on a trade.
By
GO Markets
Disclaimer: Articles are from GO Markets analysts and contributors and are based on their independent analysis or personal experiences. Views, opinions or trading styles expressed are their own, and should not be taken as either representative of or shared by GO Markets. Advice, if any, is of a ‘general’ nature and not based on your personal objectives, financial situation or needs. Consider how appropriate the advice, if any, is to your objectives, financial situation and needs, before acting on the advice.
In 2025, the ASX 200 closed around 8,621 points and was up approximately 6% year to date (YTD) as of 19 December close. Market direction was most sensitive to Reserve Bank of Australia (RBA) expectations, commodity prices and China-linked demand, and (to a lesser extent) moves in the Australian dollar (AUD). The index recovered from November’s pullback, but remained below October’s record close.
Key 2025 drivers included:
RBA policy expectations: Sentiment was shaped by shifting views on the timing and extent of rate moves. The November pullback reflected repricing towards a longer pause and higher uncertainty around whether the next move could be a hike rather than a cut, particularly as jobs and inflation data surprised.
Resources and China sensitivity: With a meaningful resources weight, the index responded to iron ore stability, strong gold prices and relative firmness in base metals. China data and any perceived policy support (including signals from the People’s Bank of China (PBOC)) remained important for the export backdrop. A relatively stable AUD also reduced currency-related noise for exporters.
Index composition and market structure: The ASX 200’s heavier tilt to materials and banks, and lower exposure to high-growth technology, meant it often lagged tech-led global rallies, but tended to hold up better when AI and growth valuations were questioned.
Corporate earnings: Reporting season outcomes influenced valuation support. In September’s half-year reporting season, around 33% of ASX 200 companies beat expectations, which helped underpin pricing around current levels.
Current state
The ASX 200 was roughly 5% below its late-October record high close of 9,094 points. After the November retracement, support around 8,400 appeared to hold and buying interest improved. The 50-day EMA near 8,730 (a prior consolidation area) was a commonly watched near-term reference, noting technical indicators can be unreliable.
What to watch in January
China and commodity demand: Growth, trade and any fresh stimulus inference from the PBOC may affect sentiment.
Domestic inflation and labour data: CPI and jobs prints are key inputs into RBA expectations.
Key levels and follow-through: The post-November rebound may need continued demand to sustain momentum.
Source: Trading View
What moved the Nikkei 225 in 2025?
In 2025, the Nikkei 225 traded around 39,200 points and was up approximately 21% year to date (YTD). Market direction was most sensitive to moves in the Japanese yen (JPY) and Bank of Japan (BOJ) communication, with the index consolidating after multi-decade highs. While broader signals remained constructive, consolidation can resolve either higher or lower.
Key influences included:
JPY movements and earnings translation: A weaker JPY can boost the reported value of overseas earnings for some exporters, although it may also increase input and import costs. The net impact often depends on company hedging practices and varies by sector, with effects most evident in export-heavy industries such as automotive, industrials and parts of technology manufacturing.
Gradual BOJ policy transition: The BOJ continued to step away from ultra-easy settings, but tightening was generally cautious. Markets largely priced a slow, conditional normalisation, which helped limit downside, even as policy headlines created bouts of volatility.
Corporate governance reforms: Ongoing improvements in capital efficiency and shareholder returns supported interest from overseas investors. Share buybacks, stronger balance-sheet discipline and improved return on equity (ROE) contributed to re-rating in parts of the market.
Global cyclical exposure: The Nikkei moved with shifts in global manufacturing sentiment and expectations for US growth, particularly during risk-on phases associated with AI-related capital spending.
Current state
After pushing to multi-decade highs earlier in the year, the Nikkei spent time consolidating but has remained structurally strong. Price sits above key long-term moving averages, and some technicians watch the 50-day exponential moving average (EMA) as a potential reference level (noting these indicators can be unreliable). Currency swings and shifting BOJ expectations were commonly cited as contributors to much of the second-half volatility, although pullbacks were generally met with buying interest.
What to watch in January for Japan
JPY volatility: Sharper yen moves, especially if driven by BOJ or Federal Reserve expectations, could quickly change exporter earnings assumptions.
BOJ communication: Small changes in language on inflation persistence or bond market operations may move sentiment.
Global growth data: US and China manufacturing and trade prints remain key inputs for an externally focused economy.
2025 has seen a material decline in the fortunes of the greenback. A technical structure breakdown early in the year was followed by a breach of the 200-day moving average (MA) at the end of Q1. The index then entered correction territory, printing a three-year low at the end of Q2.
Since then, we have seen attempts to build a technical base, including a re-test of the end-of-June lows in mid-September. However, buying pressure has not been strong enough to push price back above the technically critical and psychologically important 100 level.
What the levels suggest from here
As things stand, the index remains more than 10% lower for 2025. On this technical view, the index may revisit the 96 area. However, technical levels can fail and outcomes depend on multiple factors.
US dollar index
Source: TradingView
The key question for 2026
The key question remains: are we likely to see further losses in the early part of next year and beyond, or will current support hold?
We cannot assess the US dollar in isolation and any outlook is shaped by internal and global factors, not least its relative strength versus other major currencies. Many of these drivers are interrelated, but four potential headwinds stand out for any US dollar recovery. Collectively, they may keep downside pressure in play.
Four headwinds for any US dollar recovery
1. The US dollar as a safe-haven trade
One scenario where US dollar support has historically been evident is during major global events, slowdowns and market shocks. However, the more muted response of the US dollar during risk-off episodes this year suggests a shift away from the historical norm, with fewer sustained US dollar rallies.
Instead, throughout 2025, some investors appearedto favour gold, and at other times, FX and even equities, rather than into the US dollar. If this change in behaviour persists through 2026, it could make recovery harder, even if global economic pressure builds over the year ahead.
2. US versus global trade
Trade policy is harder to measure objectively, and outcomes can be difficult to predict. That said, trade battles driven by tariffs on US imports are often viewed as an additional potential drag on the US dollar.
The impact may be twofold if additional strain is placed on the US economy through:
a slowdown in global trade volumes as impacted countries seek alternative trade relationships, with supply chain distortions that may not favour US growth
pressure on US corporate profit margins as tariffs lift costs for importers
3. Removal of quantitative tightening
The Fed formally halted its balance sheet reduction, quantitative tightening (QT), as of 1 December 2025, ending a program that shrank assets by roughly US$2.4 trillion since mid-2022.
Traditionally, ending QT is seen as marginally negative for the US dollar because it stops the withdrawal of liquidity, can ease global funding conditions, and may reduce the scarcity that can support dollar demand. Put simply, more dollars in the system can soften the currency’s support at the margin, although outcomes have varied historically and often depend on broader financial conditions.
4. Interest rate differential
Interest rate differential (IRD) is likely to be a primary driver of US dollar strength, or otherwise, in the months ahead. The latest FOMC meeting delivered the expected 0.25% cut, with attention on guidance for what may come next.
Even after a softer-than-expected CPI print, markets have been reluctant to price aggressive near-term easing. At the time of writing, less than a 20% chance of a January cut is priced in, and it may be March before we see the next move.
The Fed is balancing sticky inflation against a jobs market under pressure, with the headline rate back at levels last seen in 2012. The practical takeaway is that a more accommodative stance may add to downward pressure on the US dollar.
Current expectations imply around two rate cuts through 2026, with the potential for further easing beyond that, broadly consistent with the median projections shown in the chart below. These are forecasts rather than guarantees, and they can shift as economic data and policy guidance evolve.
Source: US Federal Reserve, Summart of Economic Projections
Every trader has had that moment where a seemingly perfect trade goes astray.
You see a clean chart on the screen, showing a textbook candle pattern; it seems as though the market planets have aligned, and so you enthusiastically jump into your trade.
But before you even have time to indulge in a little self-praise at a job well done, the market does the opposite of what you expected, and your stop loss is triggered.
This common scenario, which we have all unfortunately experienced, raises the question: What separates these “almost” trades from the truly higher-probability setups?
The State of Alignment
A high-probability setup isn’t necessarily a single signal or chart pattern. It is the coming together of several factors in a way that can potentially increase the likelihood of a successful trade.
When combined, six interconnected layers can come together to form the full “anatomy” of a higher-probability trading setup:
Context
Structure
Confluence
Timing
Management
Psychology
When more of these factors are in place, the greater the (potential) probability your trade will behave as expected.
Market Context
When we explore market context, we are looking at the underlying background conditions that may help some trading ideas thrive, and contribute to others failing.
Regime Awareness
Every trading strategy you choose to create has a natural set of market circumstances that could be an optimum trading environment for that particular trading approach.
For example:
Trending regimes may favour momentum or breakout setups.
Ranging regimes may suit mean-reversion or bounce systems.
High-volatility regimes create opportunity but demand wider stops and quicker management.
Investing time considering the underlying market regime may help avoid the temptation to force a trending system into a sideways market.
Simply looking at the slope of a 50-period moving average or the width of a Bollinger Band can suggest what type of market is currently in play.
Sentiment Alignment
If risk sentiment shifts towards a specific (or a group) of related assets, the technical picture is more likely to change to match that.
For example, if the USD index is broadly strengthening as an underlying move, then looking for long trades in EURUSD setups may end up fighting headwinds.
Setting yourself some simple rules can help, as trading against a potential tidal wave of opposite price change in a related asset is not usually a strong foundation on which to base a trading decision.
Key Reference Zones
Context also means the location of the current price relative to levels or previous landmarks.
Some examples include:
Weekly highs/lows
Prior session ranges, e.g. the Asian high and low as we move into the European session
Major “round” psychological numbers (e.g., 1.10, 1000)
A long trading setup into these areas of market importance may result in an overhead resistance, or a short trade into a potential area of support may reduce the probability of a continuation of that price move before the trade even starts.
Market Structure
Structure is the visual rhythm of price that you may see on the chart. It involves the sequences of trader impulses and corrections that end up defining the overall direction and the likelihood of continuation:
Uptrend: Higher highs (HH) and higher lows (HL)
Downtrend: Lower highs (LH) and lower lows (LL)
Transition: Break in structure often followed by a retest of previous levels.
A pullback in an uptrend followed by renewed buying pressure over a previous price swing high point may well constitute a higher-probability buy than a random candle pattern in the middle of nowhere.
Compression and Expansion
Markets move through cycles of energy build-up and release. It is a reflection of the repositioning of asset holdings, subtle institutional accumulation, or a response to new information, and may all result in different, albeit temporary, broad price scenarios.
Compression: Evidenced by a tightening range, declining ATR, smaller candles, and so suggesting a period of indecision or exhaustion of a previous price move,
Expansion: Evidenced by a sudden breakout, larger candle bodies, and a volume spike, is suggestive of a move that is now underway.
A breakout that clears a liquidity zone often runs further, as ‘trapped’ traders may further fuel the move as they scramble to reposition.
A setup aligned with such liquidity flows may carry a higher probability than one trading directly into it.
Confluence
Confluence is the art of layering independent evidence to create a whole story. Think of it as a type of “market forensics” — each piece of confirmation evidence may offer a “better hand’ or further positive alignment for your idea.
There are three noteworthy types of confluence:
Technical Confluence – Multiple technical tools agree with your trading idea:
Moving average alignment (e.g., 20 EMA above 50 EMA) for a long trade
A Fibonacci retracement level is lining up with a previously identified support level.
Momentum is increasing on indicators such as the MACD.
Multi-Timeframe Confluence – Where a lower timeframe setup is consistent with a higher timeframe trend. If you have alignment of breakout evidence across multiple timeframes, any move will often be strengthened by different traders trading on different timeframes, all jumping into new trades together.
3. Volume Confluence – Any directional move, if supported by increasing volume, suggests higher levels of market participation. Whereas falling volume may be indicative of a lesser market enthusiasm for a particular price move.
Confluence is not about clutter on your chart. Adding indicators, e.g., three oscillators showing the same thing, may make your chart look like a work of art, but it offers little to your trading decision-making and may dilute action clarity.
Think of it this way: Confluence comes from having different dimensions of evidence and seeing them align. Price, time, momentum, and participation (which is evidenced by volume) can all contribute.
Timing & Execution
An alignment in context and structure can still fail to produce a desired outcome if your timing is not as it should be. Execution is where higher probability traders may separate themselves from hopeful ones.
Entry Timing
Confirmation: Wait for the candle to close beyond the structure or level. Avoid the temptation to try to jump in early on a premature breakout wick before the candle is mature.
Retests: If the price has retested and respected a breakout level, it may filter out some false breaks that we will often see.
Then act: Be patient for the setup to complete. Talking yourself out of a trade for the sake of just one more candle” confirmation may, over time, erode potential as you are repeatedly late into trades.
Session & Liquidity Windows
Markets breathe differently throughout the day as one session rolls into another. Each session's characteristics may suit different strategies.
For example:
London Open: Often has a volatility surge; Range breaks may work well.
New York Overlap: Often, we will see some continuation or reversal of morning trends.
Asian Session: A quieter session where mean-reversion or range trading approaches may do well
Trade Management
Managing the position well after entry can turn probability into realised profit, or if mismanaged, can result in losses compounding or giving back unrealised profit to the market.
Pre-defined Invalidation
Asking yourself before entry: “What would the market have to do to prove me wrong?” could be an approach worth trying.
This facilitates stops to be placed logically rather than emotionally. If a trade idea moves against your original thinking, based on a change to a state of unalignment, then considering exit would seem logical.
Scaling & Partial Exits
High-probability trade entries will still benefit from dynamic exit approaches that may involve partial position closes and adaptive trailing of your initial stop.
Trader Psychology
One of the most important and overlooked components of a higher-probability setup is you.
It is you who makes the choices to adopt these practices, and you who must battle the common trading “demons” of fear, impatience, and distorted expectation.
Let's be real, higher-probability trades are less common than many may lead you to believe.
Many traders destroy their potential to develop any trading edge by taking frequent low-probability setups out of a desire to be “in the market.”
It can take strength to be inactive for periods of time and exercise that patience for every box to be ticked in your plan before acting.
Measure “You” performance
Each trade you take becomes data and can provide invaluable feedback. You can only make a judgment of a planned strategy if you have followed it to the letter.
Discipline in execution can be your greatest ally or enemy in determining whether you ultimately achieve positive trading outcomes.
Bringing It All Together – The Setup Blueprint
Final Thoughts
Higher-probability setups are not found but are constructed methodically.
A trader who understands the “higher-probability anatomy” is less likely to chase trades or feel the need to always be in the market. They will see merit in ticking all the right boxes and then taking decisive action when it is time to do so.
It is now up to you to review what you have in place now, identify gaps that may exist, and commit to taking action!
In 2025, the ASX 200 closed around 8,621 points and was up approximately 6% year to date (YTD) as of 19 December close. Market direction was most sensitive to Reserve Bank of Australia (RBA) expectations, commodity prices and China-linked demand, and (to a lesser extent) moves in the Australian dollar (AUD). The index recovered from November’s pullback, but remained below October’s record close.
Key 2025 drivers included:
RBA policy expectations: Sentiment was shaped by shifting views on the timing and extent of rate moves. The November pullback reflected repricing towards a longer pause and higher uncertainty around whether the next move could be a hike rather than a cut, particularly as jobs and inflation data surprised.
Resources and China sensitivity: With a meaningful resources weight, the index responded to iron ore stability, strong gold prices and relative firmness in base metals. China data and any perceived policy support (including signals from the People’s Bank of China (PBOC)) remained important for the export backdrop. A relatively stable AUD also reduced currency-related noise for exporters.
Index composition and market structure: The ASX 200’s heavier tilt to materials and banks, and lower exposure to high-growth technology, meant it often lagged tech-led global rallies, but tended to hold up better when AI and growth valuations were questioned.
Corporate earnings: Reporting season outcomes influenced valuation support. In September’s half-year reporting season, around 33% of ASX 200 companies beat expectations, which helped underpin pricing around current levels.
Current state
The ASX 200 was roughly 5% below its late-October record high close of 9,094 points. After the November retracement, support around 8,400 appeared to hold and buying interest improved. The 50-day EMA near 8,730 (a prior consolidation area) was a commonly watched near-term reference, noting technical indicators can be unreliable.
What to watch in January
China and commodity demand: Growth, trade and any fresh stimulus inference from the PBOC may affect sentiment.
Domestic inflation and labour data: CPI and jobs prints are key inputs into RBA expectations.
Key levels and follow-through: The post-November rebound may need continued demand to sustain momentum.
Source: Trading View
What moved the Nikkei 225 in 2025?
In 2025, the Nikkei 225 traded around 39,200 points and was up approximately 21% year to date (YTD). Market direction was most sensitive to moves in the Japanese yen (JPY) and Bank of Japan (BOJ) communication, with the index consolidating after multi-decade highs. While broader signals remained constructive, consolidation can resolve either higher or lower.
Key influences included:
JPY movements and earnings translation: A weaker JPY can boost the reported value of overseas earnings for some exporters, although it may also increase input and import costs. The net impact often depends on company hedging practices and varies by sector, with effects most evident in export-heavy industries such as automotive, industrials and parts of technology manufacturing.
Gradual BOJ policy transition: The BOJ continued to step away from ultra-easy settings, but tightening was generally cautious. Markets largely priced a slow, conditional normalisation, which helped limit downside, even as policy headlines created bouts of volatility.
Corporate governance reforms: Ongoing improvements in capital efficiency and shareholder returns supported interest from overseas investors. Share buybacks, stronger balance-sheet discipline and improved return on equity (ROE) contributed to re-rating in parts of the market.
Global cyclical exposure: The Nikkei moved with shifts in global manufacturing sentiment and expectations for US growth, particularly during risk-on phases associated with AI-related capital spending.
Current state
After pushing to multi-decade highs earlier in the year, the Nikkei spent time consolidating but has remained structurally strong. Price sits above key long-term moving averages, and some technicians watch the 50-day exponential moving average (EMA) as a potential reference level (noting these indicators can be unreliable). Currency swings and shifting BOJ expectations were commonly cited as contributors to much of the second-half volatility, although pullbacks were generally met with buying interest.
What to watch in January for Japan
JPY volatility: Sharper yen moves, especially if driven by BOJ or Federal Reserve expectations, could quickly change exporter earnings assumptions.
BOJ communication: Small changes in language on inflation persistence or bond market operations may move sentiment.
Global growth data: US and China manufacturing and trade prints remain key inputs for an externally focused economy.
2025 has seen a material decline in the fortunes of the greenback. A technical structure breakdown early in the year was followed by a breach of the 200-day moving average (MA) at the end of Q1. The index then entered correction territory, printing a three-year low at the end of Q2.
Since then, we have seen attempts to build a technical base, including a re-test of the end-of-June lows in mid-September. However, buying pressure has not been strong enough to push price back above the technically critical and psychologically important 100 level.
What the levels suggest from here
As things stand, the index remains more than 10% lower for 2025. On this technical view, the index may revisit the 96 area. However, technical levels can fail and outcomes depend on multiple factors.
US dollar index
Source: TradingView
The key question for 2026
The key question remains: are we likely to see further losses in the early part of next year and beyond, or will current support hold?
We cannot assess the US dollar in isolation and any outlook is shaped by internal and global factors, not least its relative strength versus other major currencies. Many of these drivers are interrelated, but four potential headwinds stand out for any US dollar recovery. Collectively, they may keep downside pressure in play.
Four headwinds for any US dollar recovery
1. The US dollar as a safe-haven trade
One scenario where US dollar support has historically been evident is during major global events, slowdowns and market shocks. However, the more muted response of the US dollar during risk-off episodes this year suggests a shift away from the historical norm, with fewer sustained US dollar rallies.
Instead, throughout 2025, some investors appearedto favour gold, and at other times, FX and even equities, rather than into the US dollar. If this change in behaviour persists through 2026, it could make recovery harder, even if global economic pressure builds over the year ahead.
2. US versus global trade
Trade policy is harder to measure objectively, and outcomes can be difficult to predict. That said, trade battles driven by tariffs on US imports are often viewed as an additional potential drag on the US dollar.
The impact may be twofold if additional strain is placed on the US economy through:
a slowdown in global trade volumes as impacted countries seek alternative trade relationships, with supply chain distortions that may not favour US growth
pressure on US corporate profit margins as tariffs lift costs for importers
3. Removal of quantitative tightening
The Fed formally halted its balance sheet reduction, quantitative tightening (QT), as of 1 December 2025, ending a program that shrank assets by roughly US$2.4 trillion since mid-2022.
Traditionally, ending QT is seen as marginally negative for the US dollar because it stops the withdrawal of liquidity, can ease global funding conditions, and may reduce the scarcity that can support dollar demand. Put simply, more dollars in the system can soften the currency’s support at the margin, although outcomes have varied historically and often depend on broader financial conditions.
4. Interest rate differential
Interest rate differential (IRD) is likely to be a primary driver of US dollar strength, or otherwise, in the months ahead. The latest FOMC meeting delivered the expected 0.25% cut, with attention on guidance for what may come next.
Even after a softer-than-expected CPI print, markets have been reluctant to price aggressive near-term easing. At the time of writing, less than a 20% chance of a January cut is priced in, and it may be March before we see the next move.
The Fed is balancing sticky inflation against a jobs market under pressure, with the headline rate back at levels last seen in 2012. The practical takeaway is that a more accommodative stance may add to downward pressure on the US dollar.
Current expectations imply around two rate cuts through 2026, with the potential for further easing beyond that, broadly consistent with the median projections shown in the chart below. These are forecasts rather than guarantees, and they can shift as economic data and policy guidance evolve.
Source: US Federal Reserve, Summart of Economic Projections
Donald Trump has officially declared the Maduro regime in Venezuela a foreign terrorist organisation and ordered a "total and complete blockade" of the country's sanctioned oil tankers.
The U.S. has positioned 11 warships in the Caribbean to enforce the blockade, which could remove 400,000 to 500,000 barrels daily from global supply.
The move sent crude prices jumping over 2% and sparked renewed concerns about supply stability heading into 2026.
UKOUSD 48-hour chart
White House Chief of Staff Susie Wiles succinctly summarised the situation as: “Trump wants to keep on blowing boats up until Maduro cries uncle."
Brent crude jumped 2.4% to $60.33 per barrel, while WTI climbed 2.6% to $56.69.
If crude maintains its $60 per barrel price, analysts project the blockade, combined with potential Russian sanctions, could push prices toward $70 as Venezuela's already-devastated economy faces collapse.
Bank of Japan to Hike Rates to Highest Level in Decades
The Bank of Japan is set to raise interest rates to their highest level in three decades this Friday, with Governor Kazuo Ueda expected to lift the benchmark rate from 0.5% to 0.75%.
While modest by global standards, this marks a landmark step in Japan's departure from decades of near-zero rates and unconventional easing.
The decision comes amid significant market turbulence. Japanese government bond yields have surged, with 30-year bonds hitting record highs and 10-year yields reaching 19-year peaks.
The volatility stems partly from concerns under new Prime Minister Sanae Takaichi, who recently approved a $118 billion stimulus package with over 60% financed through borrowing.
While Friday's hike appears certain, policymakers have signalled caution as they push rates toward levels estimated between 1% and 2.5%.
Ueda's post-meeting press conference will be closely watched for signals about future increases.
Micron Forecasts Blowout Earnings on Booming AI Market
Micron Technology is projecting second-quarter earnings of $8.42 per share, nearly double Wall Street's $4.78 estimate.
Micron shares surged 7% in after-hours trading as markets reacted to the news that the AI-driven memory chip race is showing no signs of slowing.
As one of only three major suppliers of high-bandwidth memory (HBM) chips alongside SK Hynix and Samsung, Micron sits at a chokepoint in AI infrastructure.
The HBM specialised chips are essential for training and deploying generative AI models, and current demand is dramatically outpacing supply.
CEO Sanjay Mehrotra revealed that supply tightness will extend beyond 2026, with Micron expecting to fulfil only 50-70% of key customer demand in the medium term.
Micron projects revenue of $18.70 billion this quarter versus analyst estimates of $14.20 billion. The company has retooled their operations toward AI applications, even dissolving its consumer "Crucial" brand to concentrate on AI data centre demand.
HBM chips are now the bottleneck in AI system performance, and suppliers who can deliver at scale have the potential to capture large amounts of value over the coming years.