
Volatility headlines can encourage rushed decisions and for leveraged products like CFDs, acting without a plan can increase the risk of losses. During times like this, a pattern does emerge.
News shock → Emotional reaction → Impulsive trade → Higher risk of avoidable losses
This isn’t about being “wrong” so much as it’s about skipping the emotional reaction between headline and trade idea.
Translation: The headline isn’t your signal. Your process is.
Middle East flare-ups, sanctions, shipping disruptions, regional security shocks? This is your general checklist for assessing how geopolitical developments may affect markets.
Note: This article provides general information only and is not financial advice. It does not take into account your objectives, financial situation or needs. CFDs are complex, leveraged products and carry a high risk of loss. Consider whether trading CFDs is appropriate for you and refer to the relevant disclosure documents before trading.
Step 1. Identify the driver
Here’s the trap: “Iran” is not the driver. “Conflict” is not the driver. Those are categories useful for cable news but too broad for a risk-defined CFD trade. What moves markets is the mechanism that got worse today than it was yesterday. Separate the headline from the specific mechanism.

Driver A: Energy risk
This is the Strait of Hormuz, shipping lanes, insurance and rerouting story. In Iran flare-ups, markets care because the threat isn’t just “war,” it’s friction in oil logistics including tankers avoiding routes, insurance premiums surging and temporarily suspended transits. When Hormuz risk gets priced, oil prices may react quickly where markets perceive increased shipping or supply risk, which can influence inflation expectations.
Driver B: Supply risk
This is not “ships are nervous.” This is about production outages, infrastructure hits, refinery disruptions and export constraints. This driver tends to matter more when the headline implies physical damage or credible near-term capacity loss.
Driver C: Funding stress
This is the under-discussed engine of ugly CFD outcomes: the “who needs dollars right now?” problem. This is not “risk-off vibes,” this is liquidity tightening, the kind that makes markets move together and can coincide with wider spreads, slippage and faster price moves, which may affect execution.
In an Iran flare-up, funding stress shows up when participants stop debating the headline and start doing the mechanical work of de-risking: broad USD demand, carry trades unwinding and correlated selling across risk assets. And here’s the key filter that stops you from overreacting: the USD tends to strengthen persistently and broadly mainly during severe funding stress, not every routine fear spike.
Driver D: Policy amplification
This is not about tensions rising so much as the rules changing, the kind of change that outlives the headline cycle and forces real repricing because it alters incentives, access, or flows. The Iran conflict headlines won’t stay local if policy escalates them through sanctions (supply, payments, shipping, insurance), changes to retaliation rules, or shifts in central bank reaction functions as oil risk feeds into inflation risk. That can harden rate expectations.
This is where “geopolitics” stops being narrative and becomes policy constraint and policy constraints tend to create follow-through because they change what market participants can do, not just what they think.
Before acting on a headline
If you choose to monitor breaking news, consider pausing before trading and checking whether the development is new, whether there are observable real-world constraints, and how markets are reacting. Don’t ask ‘is this bullish for gold?’. Instead, consider:
- Is this a flow story, a barrel story, a funding story, or a policy story?
- Is it new information or a remix of what markets already knew?
- Is there evidence of real-world constraint (shipping behaviour, insurance, official measures), or just rhetoric?”
Step 2. Identify the key markets
Some traders stick to a small set of markets they know well, especially when headlines hit. Liquidity and spreads can change fast. If you try to watch everything, you may end up trading your own adrenaline rather than the market.
1) Oil (WTI or Brent proxy)
If the driver is energy flow risk or supply risk, oil is usually the first and cleanest repricing channel—risk premium, inflation impulse, and global growth expectations all run through here.
2) USD conditions (DXY proxy or your most tradable USD pairs)
Not because the USD is always “safe haven,” but because it’s the funding layer under everything. In true stress, you’ll see broad USD strength; in “headline stress,” you often won’t.
3) Gold
Gold is not “up on fear” by default, its fear filtered through USD and real yields. If USD funding stress ramps up, gold can be pulled in different directions and this is why traders get whipsawed: they trade the story, not the cross-currents.
4) A volatility gauge (execution risk, not ideology)
This can help gauge whether conditions may lead to wider spreads, slippage or faster moves.
5) The instrument you actually trade
For a lot of CFD traders, this is where the Iran shock becomes your problem in the form of local markets and local positioning and USD pairs.
Don’t map by habit, map by driver
- Energy flow risk? Oil first, then risk indices, then FX linked to risk/commodities.
- Funding stress? USD conditions first, then JPY crosses, then equities.
- Policy shock? Watch oil + USD together—policy can tighten both simultaneously.
Translation: For some traders, focus comes from watching fewer markets that are most relevant to the driver they’re assessing.
Step 3. Check the charts that matter
Before considering any trade setup, some traders do a quick ‘triage’ check. The aim isn’t prediction, it’s checking whether fast markets could mean wider spreads, slippage or sharper moves in leveraged products like CFDs.
Chart A: Oil
What you’re checking: Is the market pricing real disruption risk, or just reacting? In Iran-related flare-ups, “Hormuz risk” narratives tend to show up as a risk premium conversation in oil, often faster than it shows up in equities or FX.
Examples of chart features some traders look at include
- Is price breaking and holding above a prior structure level? (Not just spiking).
- Did it gap and then fill? (Often means headline heat > real constraint).
- Is the move continuing during liquid sessions, or only during thin hours? (Thin-hours moves are where CFD spreads can punish you the most).
Translation: Oil indicates whether the Iran story may become an inflation/flow story or just a screen-flash.
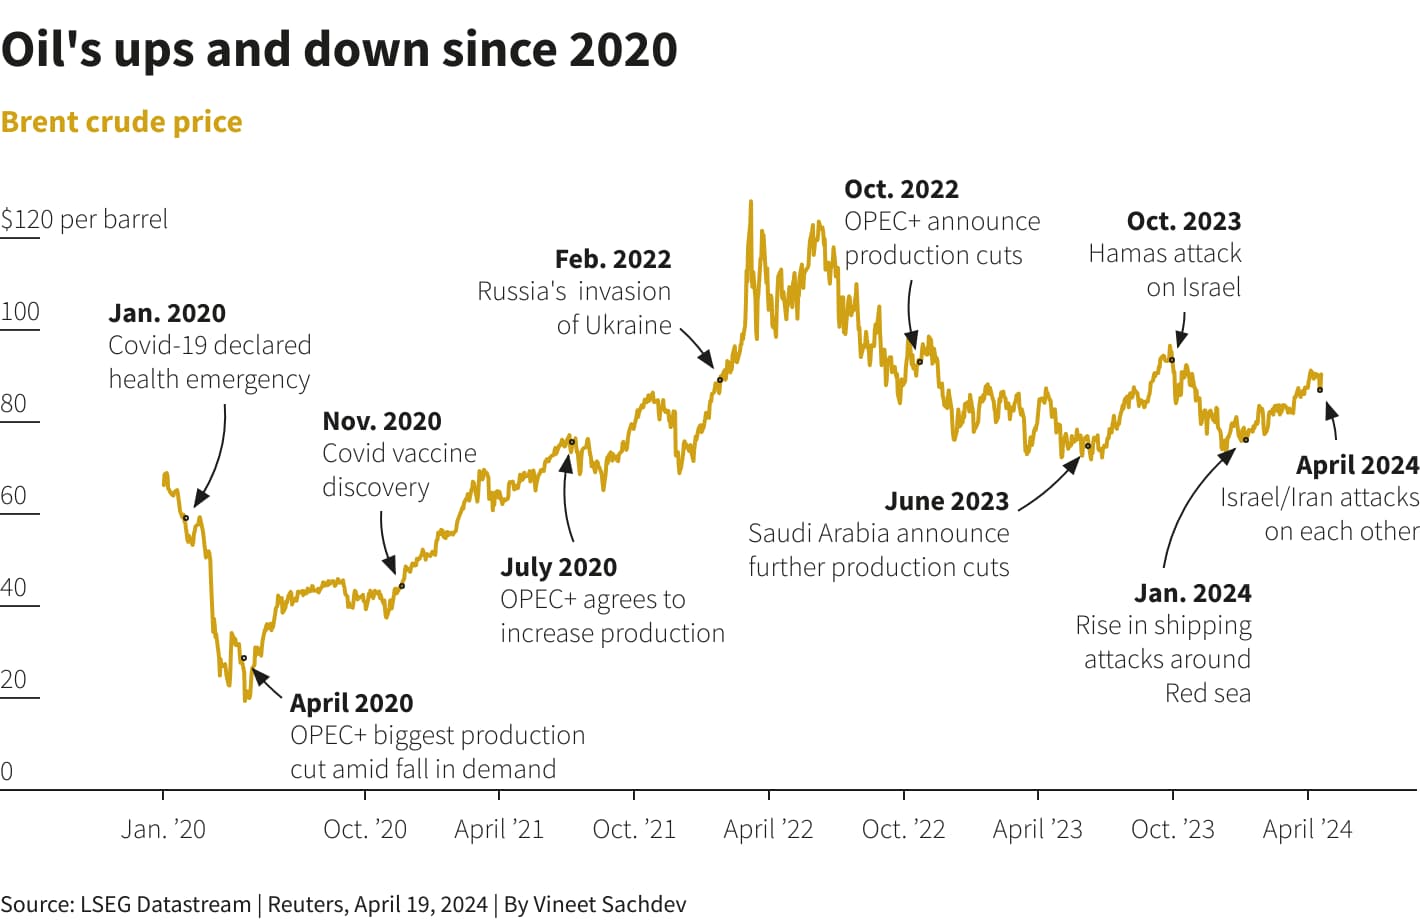
Chart B: USD
What you’re checking: Is this turning into a funding event? The USD doesn’t “safe-haven” on schedule. In some episodes of severe global funding stress, the USD has strengthened broadly and persistently, although this isn’t consistent across all headline-driven spikes.
Practical CFD filters:
- Broad USD strength across multiple pairs (not just one cross doing something weird).
- Commodity FX vs USD (AUD, CAD proxies) behaving like risk is truly tightening.
- JPY crosses as a stress indicator (carry unwind tells the truth quickly).
If USD is not confirming, that’s information. It often means: headline risk is loud, but global liquidity isn’t actually panicking.
Translation: USD indicates whether the Iran headline is “market stress”… or “market noise with wider spreads and higher execution risk.”
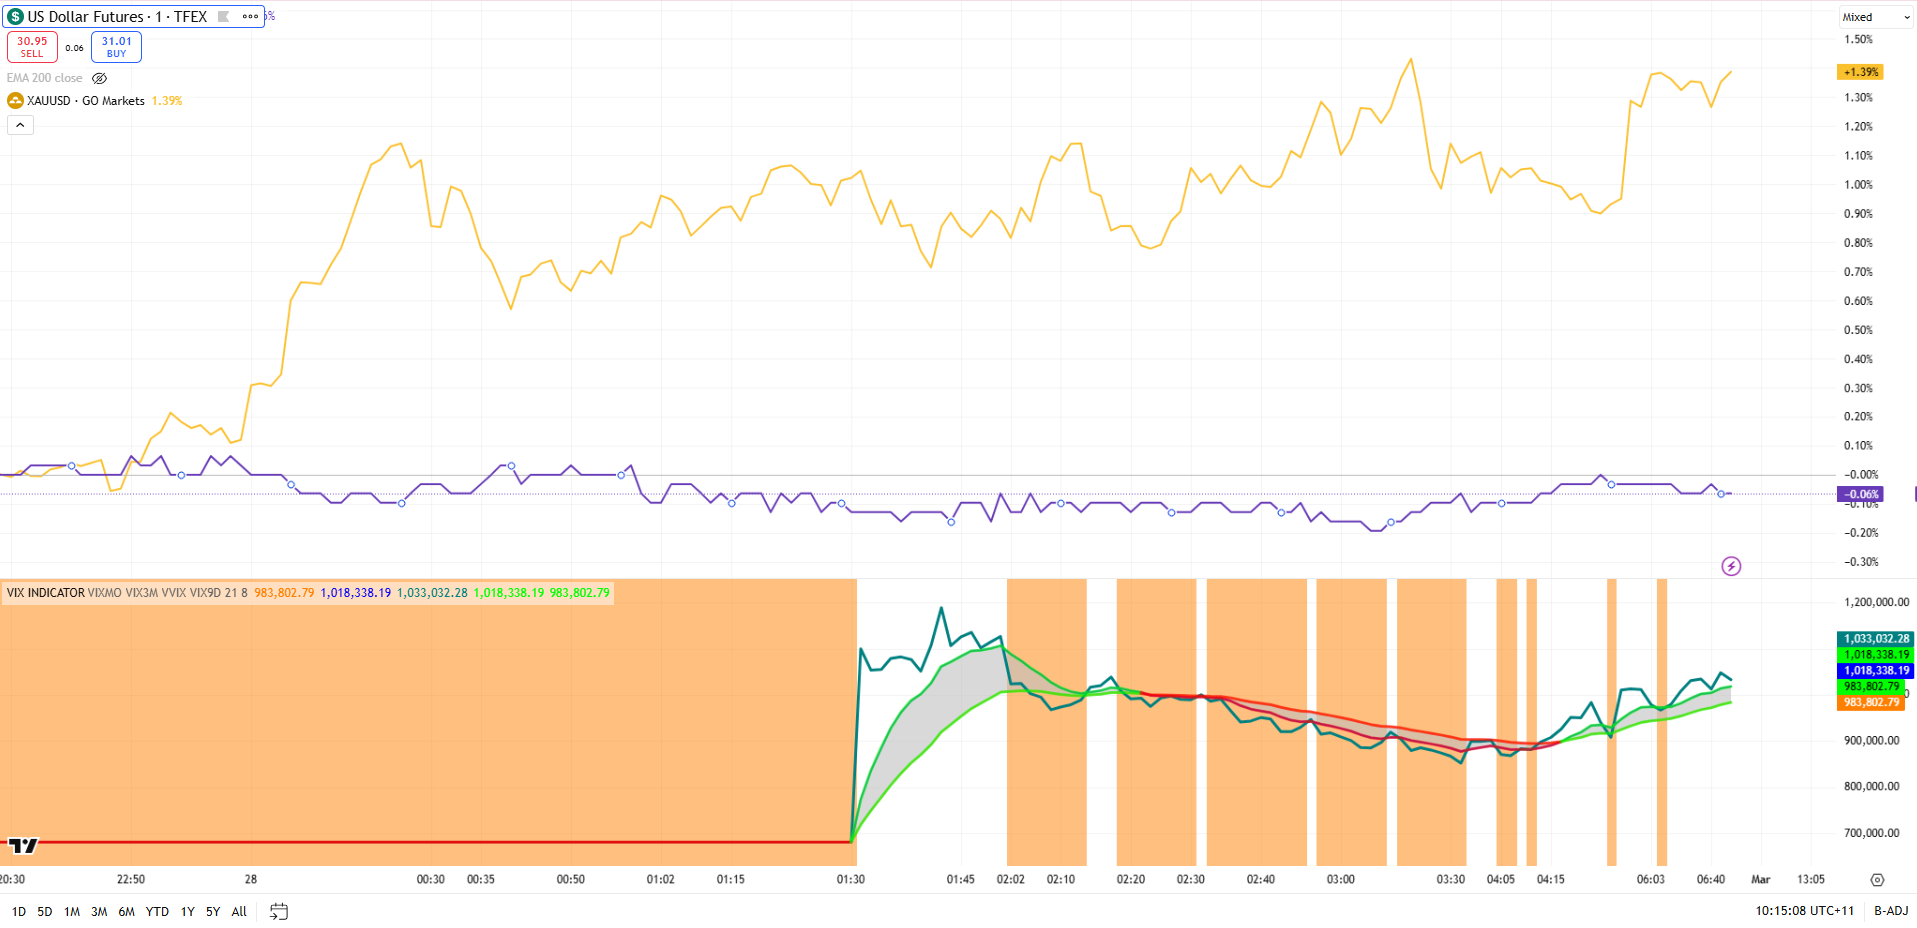
Chart C: Volatility
What you’re checking: How dangerous normal sizing has become.
Use a sizing governor that forces honesty:
- Normal ranges → normal size
- ~1.5× typical range expansion → consider half size
- ~2× range expansion → quarter size or stand aside
Some traders reduce position size or choose not to trade when ranges expand materially versus usual conditions. Any sizing approach depends on individual circumstances and risk tolerance.
Because in CFDs, volatility doesn’t just change directionality, it changes execution quality, stop distance, and how fast a loss becomes a margin problem.
Translation: Volatility is your permission slip or your stop sign.

Step 4. Choose a setup type
Geopolitics creates volatility but it doesm't guarantee trend.
Pick structure, not opinion
- Breakout: after the market forms a post-headline range.
- Pullback: once trend is established and liquidity steadies.
- Mean reversion: only if the spike stalls and structure confirms.
Common mistake: picking direction first, then hunting confirmation.
Translation: The setup is the response to price behaviour, not your worldview.
Step 5. Define risk
From a general risk-management perspective, traders often define that a trade idea is not complete until it has
- Entry condition: what must happen for you to participate
- Invalidation: where you are wrong
- Position size: based on dollars-at-risk, not conviction
- Session max loss: daily or weekly cap (protects you from spiral trading)
For CFDs specifically, regulators emphasise how leverage can accelerate losses, and why protections such as margin close-out arrangements, leverage limits and negative balance protection (where applicable) exist.

Reportingdates and release times are based on company investor relations calendars whereconfirmed. Where dates or times are not marked confirmed, they are GO Marketsestimates. Consensus EPS, revenue and analyst-range data are sourced fromBloomberg and Earnings Whispers, as at 09 July 2026 (AEST). Company guidance,backlog and operating metrics are sourced from the latest company filings orresults presentations, unless stated otherwise. Any scenario analysis reflectsGO Markets analysis. Figures and schedules may change without notice.
The information provided is of general nature only and does not take into account your personal objectives, financial situations or needs. Before acting on any information provided, you should consider whether the information is suitable for you and your personal circumstances and if necessary, seek appropriate professional advice. All opinions, conclusions, forecasts or recommendations are reasonably held at the time of compilation but are subject to change without notice. Past performance is not an indication of future performance. Go Markets Pty Ltd, ABN 85 081 864 039, AFSL 254963 is a CFD issuer, and trading carries significant risks and is not suitable for everyone. You do not own or have any interest in the rights to the underlying assets. You should consider the appropriateness by reviewing our TMD, FSG, PDS and other CFD legal documents to ensure you understand the risks before you invest in CFDs. These documents are available here.
Any references to Australian or international shares, sectors, indices, ETFs, crypto-related stocks or other instruments are provided for market commentary and watchlist purposes only and do not constitute a recommendation, offer or solicitation to buy, sell or hold any financial product or adopt any investment strategy. International markets may involve additional risks, including currency fluctuations, regulatory differences, market structure differences, reduced liquidity and higher volatility. Company-specific, sector-specific and macroeconomic risks may also affect performance.
Commentary on geopolitical developments, economic data, central bank decisions, earnings, policy changes and other global or financial market events is based on information available at the time of publication and may change without notice. Such events can lead to sudden market moves, price gaps, reduced liquidity, wider spreads and increased volatility, particularly in leveraged products such as CFDs. Forward-looking statements, expectations and scenario analysis are inherently uncertain and should not be relied on as guarantees of future market behaviour or outcomes.


.jpeg)


