For three decades, Japan’s stock market was where growth money went to gather dust. That was the story, anyway.
Now the Nikkei 225 has moved through 50,000 and is testing levels near 68,000. It is a significant rerating, and global funds that spent years looking elsewhere are quietly rebuilding positions.
The policy mix behind the move has already picked up a name: Sanaenomics, after Prime Minister Sanae Takaichi’s economic program.
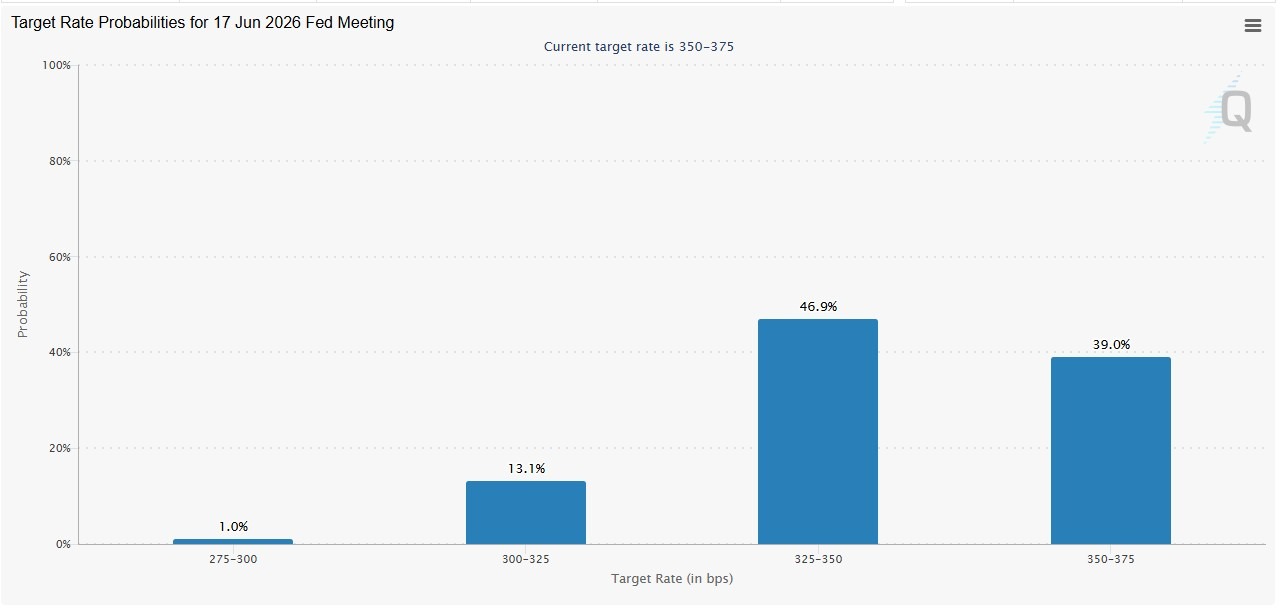
Three forces are doing the work. The Bank of Japan (BOJ) is holding its policy rate near rock-bottom levels, even as higher Middle East-driven oil costs squeeze Japan’s import bill. Real wages are growing, putting more spending power back into consumers’ pockets. Meanwhile, the Tokyo Stock Exchange is pushing undervalued companies towards buybacks, higher dividends and cleaner balance sheets.
0.75%
BOJ policy rate
4.35%
RBA cash rate
~360bps
Rate differential
~68,000
Nikkei 225 current test level
Put those pieces together and the picture becomes more interesting.
A relatively cheap currency, stronger consumer spending and more shareholder-friendly boardrooms have made Japan one of the more closely watched carry trade stories in global markets.
A carry trade involves borrowing in a low-rate currency and deploying that capital where potential returns are higher. With Australia’s cash rate sitting around 360 bps above Japan’s, that gap is helping shape interest in pairs such as AUD/JPY.
The five stocks to watch
This is not a random basket. Three companies are exposed to the weak-yen export story. One offers a more direct view of domestic consumption. The final company sits inside the artificial intelligence (AI) infrastructure buildout. Here is what puts each one on the watchlist.
01.Toyota Motor Corp.
NYSE: TM | TSE: 7203
The world’s largest automaker by volume is also one of the more direct equity expressions of the weak-yen trade. Toyota sells globally but reports in yen. When the yen weakens, overseas earnings can translate back more favourably.
Management has also supported the company through a substantial buyback program and record dividend payments. These measures have helped offset part of the estimated cost of new US tariffs on its exports. For traders, Toyota provides a highly liquid way to monitor the relationship between the yen, export margins and global vehicle demand without trading the currency market directly.
Dividend Per Share Trend: ¥60 to ¥95
Corporate distributions climbed steadily over the FY2023–FY2026 horizon, alongside an explicit ¥100 per share dividend milestone forecast out into FY2027. Total fiscal outlays for FY2026 reached ¥1,238.2 billion.
What could support it
- A weaker yen supporting export margins
- The buyback and dividend program
- Resilient hybrid vehicle demand
What could limit it
- US tariff costs
- A sudden yen reversal
Source: Toyota Motor Corporation Investor Relations, Presentation dated 8 May 2026. Note: FY2027 metrics reflect forward-looking management forecasts.
02.Sony Group Corp.
NYSE: SONY | TSE: 6758
Sony is where the currency story meets the technology cycle. The company is known for gaming and entertainment, but its image sensor business is also an important part of the global consumer technology supply chain.
Sony sensors are used in a large share of premium smartphone cameras, including current-generation iPhones. That places the company inside two overlapping themes: the first is the earnings translation benefit that may come from a weaker yen; the second is the edge-AI hardware cycle, as smartphone and camera manufacturers move more processing directly onto their devices. Sony’s diversified earnings base is why traders may view it differently from a more concentrated hardware or export business.
Segment Performance: Sales Up 20% | Income Up 37%
Imaging & Sensing Solutions posted net segment sales of ¥2,151.5 billion and operating income of ¥357.3 billion. Strong volume momentum driven by premium mobile sensors offset net foreign exchange headwinds of ¥15 billion on sales and ¥12.5 billion on operating income.
What could support it
- Sensor demand from smartphone manufacturers
- Resilient fundamental underlying component volume
- A diversified earnings base
What could limit it
- A slowdown in consumer electronics
- Localized unfavorable foreign currency translation matrices
Source: Sony Group Corporation, FY2025 Financial Results presentation, 8 May 2026. Refers to fiscal year segment performance details.
03.Honda Motor Co.
NYSE: HMC | TSE: 7267
Honda looks similar to Toyota until you get to the currency sensitivity. Its hybrid-heavy vehicle range has been capturing demand as growth in pure electric vehicle (EV) sales cools. At the same time, its export revenue may benefit from a weaker yen.
The difference is how sharply the earnings profile could respond if the currency reverses. That is why traders often keep one eye on USD/JPY. A stronger yen could quickly reduce some of the currency support behind Honda’s overseas earnings.
Automobile Deficit: -¥1,411.1 Billion Operating Income
Lending depth to currency realities, structural segment returns slid into a deficit from a positive profit baseline of ¥243.8 billion. While tariff headwinds impacted earnings by ¥331.6 billion and FX detracted ¥41.6 billion, massive ongoing EV-related losses of ¥1,453.6 billion remain the primary structural drag.
What could support it
- Hybrid vehicle market share absorption
- Favorable export volume tracking structures
What could limit it
- EV development capital expenditures and associated segment losses
- Elevated tariff headwinds and global session policy reversals
Source: Honda Motor Co., Financial Presentation for the Fiscal Year ended 31 March 2026, published 14 May 2026.
Asia session in focus
Momentum can build quickly during the Asia session. Track the global levels, markets and macro catalysts shaping the current trend.
04.Sanrio Co. Ltd.
TSE: 9684
Then there is Sanrio, which matters precisely because it is not the same trade. The lifestyle and licensing company behind some of Japan’s best-known pop-culture intellectual property does not depend on a weaker yen in the same way as the exporters above it.
Its licensing-heavy model is capital-light and operates at relatively high margins. The company has also reported one of the strongest returns on equity in this group. That makes Sanrio a useful test of whether Japan’s market rally is being supported by domestic consumers, rather than currency translation alone.
Core Efficiency: 40.1% Operating Margin | 41.6% ROE
FY2026 financial closures confirmed total sales scaled to ¥194.1 billion, yielding an operating profit of approximately ¥77.9 billion. High-quality corporate efficiency is highlighted by an expansive return on equity profile exceeding 41.5%.
What could support it
- Rising real wages and consumer spending
- High-margin, capital-light IP licensing models
What could limit it
- A pullback in domestic discretionary consumer budgets
- Market entry valuation structural constraints
Source: Sanrio Company, Ltd. Investor Relations Financial Highlights database updated June 2026; latest briefing 23 June 2026.
05.Advantest Corp.
TSE: 6857
The least glamorous job in AI may also be one of the most important. Advantest makes the equipment used to test advanced chips before they ship. It is not the part of the supply chain that usually gets the headlines, but the chips cannot move without it.
That puts Advantest directly in the path of global AI data centre spending. Its order backlog tends to move with hyperscaler capital expenditure (capex), making the company one of several Asian semiconductor names traders use to monitor the AI infrastructure cycle outside the US.
FY2026 Forecast Metrics: ¥1.420 Trillion Sales | 44.2% Operating Margin
Corporate guidance targets operating income of ¥627.5 billion, anchored to an exchange rate baseline baseline of USD/JPY 150 and EUR/JPY 170. Quantitative sensitivity states a ¥1 weakening of the yen against the USD increases operating income by ¥4 billion, while a ¥1 weakening against the EUR reduces it by ¥0.4 billion.
What could support it
- AI infrastructure capital outlays from major hyperscalers
- Quantifiable financial sensitivity leverage via USD exchange rate depreciation
What could limit it
- An escalation in export controls or technology tariff architectures
- Cyclical slowdown phases in semiconductor manufacturing equipment capex
Source: Advantest Corporation corporate earnings forecast report, released 27 April 2026. Data structures reflect structural company forecast models.
What could go wrong
The positive case is easy to tell. The harder part, and often the more useful part, is asking what could interrupt it. Four risks are worth watching before treating the trend as settled.
Energy shock
Japan imports most of its crude oil from the Middle East. A sustained increase in oil prices could reduce real wage gains, pressure household spending and potentially push the BOJ towards faster, less comfortable policy tightening.
Currency intervention
A sharp and rapid decline in the yen has historically drawn intervention from Japan’s Ministry of Finance. That kind of surprise could trigger a sharp unwind in crowded carry trade positioning. Review comparative parameter shifts inside our regional reporting matrix.
Recency bias
A pullback after a substantial rerating would not automatically mean the broader trend had reversed. But assuming a pullback cannot happen is a risk in itself.
Trade policy
Semiconductor equipment manufacturers such as Advantest sit at the centre of global supply chains. That leaves them exposed to changes in export controls or tariff disputes that may have little connection to Japan’s domestic economic outlook.
The bottom line
The interesting part is that Japan is not one trade. Toyota and Honda are currency stories wrapped in automotive businesses. Sony sits between currency exposure and the technology cycle. Sanrio offers a more direct view of domestic consumption. Advantest is an AI supply chain company that happens to be Japanese.
The same market can rise for several different reasons. Understanding which lever is moving each company can help separate the broader theme from the market noise.
Explore the markets behind the theme
Access more than 110 FX pairs through GO Markets, subject to regional session open parameters and local product availability.