What is the Gold-to-copper ratio and why is it important? And more importantly, what could it be telling us? The Gold-To-Copper Ratio Health Check Copper is often referred to as a barometer for economic growth and gold has historically been the safe-haven, a risk-off asset of choice for investors, so naturally comparing the two allows one to take a decent look at broader market sentiment.
Why Copper? Copper is one of the most widely used metals from both established and emerging economies and on top of that it is the only base metal used throughout all aspects of industrialization. Therefore increase in industrialization equates to an increasing demand in copper which ultimately relates to higher copper prices.
For this reason, the metal holds the moniker of "Dr. Copper." and why we can use it as an indicator of economic growth. The Ratio Explained In layman's terms, the gold-to-copper ratio is the current gold price divided by the current copper price.
However what is more import is what this ratio indicates and how it can help us get a firmer understand of the macro forces at play within the market. The gold-to-copper ratio is effectively a visual representation of risk-on/risk-off sentiment. The higher the ratio means that fewer people are buying copper and more are buying gold so what we see is a risk-off sentiment, meaning that people are more cautious with their money and investments, sticking to low-risk products.
The lower the ratio equates to the inverse, vis-à-vis risk-on sentiment and more stimulus into the economy. Gold-to-Copper Ratio Historical Traits In June of 2016, the story on everybody’s radar was bond yields at the lowest since the middle of the financial crisis with the U.S. 10-year yield printing lows at 1.3579% in and then for the next few weeks we saw the yield sit at around the lows and the 1.50% level. Was the gold-to-copper ratio signaling a shift to us?
The ratio peaked in early September 2016 but very quickly began to tumble as Gold prices started to see sell-offs and Copper started to see pretty heavy buying, this resulted in seeing the ratio price drop by about a third. It was during the second leg lower for the ratio that we started to see a bid in bond yields and the transition to a more risk-off environment, which we can see in the chart below that shows both the U.S. 10yr Bond yield (orange line) and the Dow Jones Industrial Index (white shaded line) begin their rally higher. U.S. 10yr Bond yield & Dow Jones Industrial Index So how can we utilise this within our trading?
To quote Samuel Goldwyn “The harder you work, the luckier you get.” and in this case, the harder you work to understand the interconnectivity of financial markets the ‘luckier’ you get with trading. Understanding how certain assets can be used to evaluate market/economic sentiment allows you to move away from being dependent on the obvious indicators, i.e. economic data & mainstream media sources and will enable you to be ahead of the curve, active as a pose to reactive. So, with the Gold price just popping above $1200 an ounce and Copper prices pushing lower on the back of poor Chile exports, we could see the gold-to-copper begin to push higher again, was the Gold-to-copper ratio flashing a warning to us before the significant equity market sell-off on Wednesday the 10th?
Will a push higher in the ratio signal a further sell-off in equities? We will be watching closely, both the commodity prices and equity indices to see where the market takes us next. This article is written by a GO Markets Analyst and is based on their independent analysis.
They remain fully responsible for the views expressed as well as any remaining error or omissions. Trading Forex and Derivatives carries a high level of risk. Sources: Bloomberg
By
GO Markets
Disclaimer: Articles are from GO Markets analysts and contributors and are based on their independent analysis or personal experiences. Views, opinions or trading styles expressed are their own, and should not be taken as either representative of or shared by GO Markets. Advice, if any, is of a ‘general’ nature and not based on your personal objectives, financial situation or needs. Consider how appropriate the advice, if any, is to your objectives, financial situation and needs, before acting on the advice.
The latest move in oil has put energy names back in focus. Over the past six months, Exxon Mobil and Baker Hughes have outperformed Brent crude on a normalised basis, Chevron has remained broadly constructive, SLB has lagged the commodity and Woodside's broker consensus has been more measured.
When crude moves, the impact rarely stays contained to the commodity itself. Higher oil prices can affect inflation expectations, shipping costs and corporate margins across the global economy.
What the latest move is showing
There are three broad ways companies can benefit from firmer oil prices:
Producing oil and gas, by selling the commodity at a higher price
Providing services and equipment to producers
Transporting oil around the world
Each of the names below represents one of those exposure types, with a different risk profile when crude rises.
1. Exxon Mobil (NYSE: XOM)
Over the past six months, Exxon Mobil has outperformed Brent crude, with its share price up nearly 35% compared with about 30% for Brent. As of 11 March 2026, both were trading just over 3% below their all-time highs, while Exxon remained closer to its 52-week high.
Exxon Mobil is one of the world's largest integrated oil companies, with exposure spanning exploration, production, refining and chemicals. When oil prices rise, its upstream business may benefit from wider margins, while its scale and diversification can help cushion weaker parts of the cycle.
Exxon Mobil (XOM) vs. Brent Crude 3-month performance
Exxon Mobil and Brent crude normalised performance over six months, as of 11 March 2026 at the time of writing | Source: Share Trader
Analyst consensus: Buy
According to TradingView data, analyst sentiment towards Exxon is broadly positive. Of the 31 analysts tracked, 15 rate the stock Strong Buy or Buy, 13 rate it Hold, 1 rates it Sell and 2 rate it Strong Sell.
That positive view is linked to Exxon's balance sheet strength and higher-margin production. The most optimistic analysts project a 1-year price target as high as US$183.00. The average price target is US$145.00, which sits about 3.6% below the current trading price.
Exxon Mobil analyst ratings and price targets, as of 11 March 2026 at the time of writing | Source: TradingView
2. Chevron (NYSE: CVX)
Chevron is another global integrated major that has benefited from the recent move higher in crude, with its shares trading near 52-week highs. Like Exxon, Chevron operates across the value chain, including upstream production, refining and marketing.
Chevron's completed acquisition of Hess adds Guyana and other upstream assets, which some analysts see as supportive over time. That said, the earnings impact remains subject to integration, project execution and commodity price risks.
Exxon Mobil vs Chevron performance, 6-month chart
Chevron and Exxon Mobil normalised performance over six months, as of 11 March 2026 at the time of writing | Source: Share Trader
Analyst consensus: Buy
Chevron is viewed similarly to Exxon, with broker sentiment remaining broadly constructive. Recent TradingView aggregates show 30 analysts covering the stock over the past three months, with 17 rating it Strong Buy or Buy, 11 at Hold, 1 at Sell and 1 at Strong Sell.
Analysts have highlighted Chevron's diversified portfolio and the potential contribution from Hess, although commodity price volatility and execution risk may keep some more cautious.
Chevron analyst ratings and price targets, as of 11 March 2026 at the time of writing | Source: TradingView
3. SLB (NYSE: SLB)
SLB, previously known as Schlumberger, is one of the world's largest oilfield services and technology providers. It supplies tools, equipment and software that help producers find, drill and complete wells more efficiently.
Over the past six months, SLB has lagged Brent crude, with the share price trading in a choppier range and remaining below its recent peak. That suggests the stronger oil backdrop has not been fully reflected in the share price.
That pattern is not unusual for oilfield services companies, where customer spending decisions often follow moves in the underlying commodity rather than move in lockstep with them. Any future re-rating would depend on factors including producer capital spending, contract timing, service pricing, offshore activity and broader market conditions. A firmer oil price should not be assumed to translate automatically into a firmer SLB share price.
SLB vs Brent crude, 1-month normalised performance
SLB and Brent crude normalised performance over six months, as of 11 March 2026 at the time of writing | Source: Share Trader
Consensus: Buy
According to TradingView data, third-party analyst consensus on SLB is Buy. Of the 33 analysts covering the stock, 27 rate it Strong Buy or Buy, 4 rate it Hold and 2 rate it Sell or Strong Sell.
That indicates constructive broker sentiment, although the gap between oil prices and SLB's recent share-price performance suggests investors may still want clearer evidence of improving service demand and pricing before the stock fully reflects the stronger commodity backdrop.
SLB analyst ratings and price targets, as of 11 March 2026 at the time of writing | Source: TradingView
4. Baker Hughes (NASDAQ: BKR)
Baker Hughes is another major oilfield services and equipment provider, with additional exposure to industrial segments such as LNG and power infrastructure. Even when oil prices are not at extreme highs, advances in drilling technology and lower break-even costs have helped keep many shale plays profitable, supporting demand for its services.
The company has also been described as well positioned because of its balance sheet and its exposure to ongoing exploration and production activity. In a period of higher, or even stable-to-firm, oil prices, that mix of services and energy technology may create several revenue drivers.
Over the past six months, Baker Hughes has materially outperformed Brent crude on a normalised basis. Brent traded in a much tighter range for most of the period before moving higher late, while BKR climbed more steadily and reached a significantly stronger cumulative gain. That suggests BKR's share price benefited not only from the backdrop in oil, but also from company-specific optimism and broader support for oilfield services and energy technology names.
BKR vs Brent crude, 6-month normalised performance
Baker Hughes and Brent crude normalised performance over six months, as of 11 March 2026 at the time of writing | Source: Share Trader
Analyst consensus: Buy
According to TradingView data, Baker Hughes is categorised as Strong Buy. Based on 25 analysts who provided ratings over the past three months, 16 rated the stock Strong Buy, 3 rated it Buy, 4 rated it Hold, 1 rated it Sell and 1 rated it Strong Sell.
Overall, broker sentiment towards Baker Hughes is broadly positive, with more than three quarters of covering analysts rating the stock either Strong Buy or Buy, while most of the remainder were at Hold. That supportive analyst view appears to reflect BKR's exposure to both traditional oilfield services and broader energy and industrial technology markets, including LNG infrastructure.
Baker Hughes analyst ratings and price targets, as of 11 March 2026 at the time of writing | Source: TradingView
5. Woodside Energy (ASX: WDS)
Woodside Energy gives the list an Australia-based producer with significant exposure to LNG and oil markets. Its earnings are closely tied to realised commodity prices, which makes the stock sensitive to shifts in crude and gas pricing, as well as broader global energy demand.
Compared with some of the larger US energy names, broker sentiment towards Woodside appears more measured. Investors are balancing the company's global LNG exposure and leverage to stronger energy prices against softer recent realised prices, project and execution risks, and longer-term regulatory and decarbonisation pressures.
Analyst consensus: Hold
According to TradingView data, Woodside is rated Neutral/Hold. Of 15 analysts, 2 rate it Strong Buy, 4 rate it Buy, 7 rate it Hold, 1 rates it Sell and 1 rates it Strong Sell.
The average 12-month price target is A$29.20 versus a current price of about A$30.28, implying downside of roughly 3.6%. Relative to the larger US energy names in this list, that points to a more cautious broker view.
Woodside Energy analyst ratings and price targets, as of 11 March 2026 at the time of writing | Source: TradingView
6. Global oil tanker operators
Oil tanker companies can benefit when firmer oil prices, OPEC+ policy shifts and geopolitical tension increase long-distance shipments and disrupt usual trade routes. When oil volumes travel further, 'tonne-mile' demand can support tanker day rates and profitability even when the broader energy market is volatile.
Analyst consensus: N/A
This is a broader industry category rather than a single publicly traded stock, so there is no single broker consensus to cite. Analyst views would need to be assessed at the company level, such as Frontline plc (FRO), Euronav (EURN) or Scorpio Tankers (STNG).
More broadly, the sector is cyclical. Any benefit from tighter shipping markets can reverse if routes normalise, freight rates fall or supply increases.
Risks and constraints
Higher oil prices do not remove risk for these names.
If prices rise too far, too fast, demand destruction and policy responses can weigh on future earnings.
Political decisions from OPEC+ or other major producers can reverse a rally by increasing supply.
Services and tanker companies are highly cyclical. When the cycle turns, pricing power can fade quickly.
Company-specific issues, including project execution, realised pricing and capital spending, still matter.
Taken together, these names may benefit from firmer oil prices, but they also carry sector-specific, geopolitical and company-level risks that deserve close attention.
Key market observations
Woodside provides LNG and oil exposure, although current broker sentiment is more neutral than for the larger US names.
Tanker operators may benefit when freight markets tighten, though that trade remains highly cyclical and route-dependent.
SLB and Baker Hughes may benefit if firmer oil prices translate into more drilling and completion activity, but the share-price response has been mixed.
Exxon Mobil and Chevron offer direct exposure to stronger upstream margins, supported by diversified operations.
References in this article to Exxon Mobil, Chevron, SLB, Baker Hughes, Woodside, tanker operators, analyst consensus ratings and price targets are included for general market commentary only and do not constitute a recommendation or offer in relation to any financial product or security. Third-party data, including consensus ratings and target prices, may change without notice and should not be relied on in isolation. Energy and shipping exposures are cyclical and can be materially affected by commodity price volatility, realised pricing, production changes, project execution, geopolitical disruptions, freight market conditions, regulatory developments and shifts in investor sentiment. Any views about potential beneficiaries of higher oil prices are subject to significant uncertainty.
Before the charts start talking, the region does. Over the weekend, the Middle East moved from tense to kinetic. Joint US and Israeli strikes hit targets inside Iran, and multiple outlets reported Iran’s Supreme Leader Ayatollah Ali Khamenei was killed. That single fact changes the whole market sentence structure and it is not just geopolitics, it is risk premia being re-priced in real time, across energy, volatility and the global growth outlook.
Markets do not trade tragedy, rather they trade uncertainty. When the uncertainty sits on top of global energy arteries, price discovery gets loud.
At a glance
What happened: Multiple major outlets reported that Iran’s Supreme Leader Ayatollah Ali Khamenei was killed following joint US and Israeli strikes inside Iran, with Iranian state media cited as confirming his death.
What markets may focus on now: A fast-moving repricing of geopolitical risk premia, led by crude and refined products, plus cross-asset volatility as headlines drive liquidity, correlations and intraday ranges.
What is not happening yet: Markets may be pricing more of a headline risk premium than a fully evidenced, sustained physical supply disruption.
Next 24 to 72 hours: Focus is likely to stay on escalation signals and second-order constraints, including any impact on Gulf shipping routes and the policy and diplomatic track, including any UN Security Council dynamics.
Australia and Asia hook: Flight and airspace disruptions are already spilling beyond the region. For markets, Asia-facing sensitivities can show up through refinery margins and shipping and insurance costs, while AUD can behave as a risk barometer when global risk appetite is unstable.
Oil is the transmission mechanism
Brent crude spiked by as much as 13% in early trade on Monday 2 March, touching around US$82 per barrel in reporting, as the Strait of Hormuz risk moved from theoretical to immediate. The Strait matters because roughly one-fifth of global oil and gas shipments pass through it and when tankers hesitate, insurers re-price, and routes get re-written, energy becomes a volatility product.
Base case: partial disruption and higher “risk premium” in crude, with big intraday swings. Upside risk: a sustained shipping slowdown or direct infrastructurehits, which some analysts warn could push crude materially higher. Downside risk: de-escalation headlines, emergency supply responses, orclearer shipping protection that compresses the risk premium.
The VIX does not move in a vacuum, and this spike in uncertainty is already spilling into other asset classes in a fairly ‘textbook’ way. As volatility reprices, the market’s first instinct has been a flight to safety, alongside a scramble for commodities most exposed to the conflict.
Monday saw Asia opened with that tone: Japan’s Nikkei 225 was reported down around 2.4%, and Australia’s ASX 200 dipped before stabilising. At the same time, defensive positioning showed up in classic safe havens. Gold futures gapped higher by roughly 3% over the weekend, while traditional refuge currencies, led by the Swiss franc, attracted immediate inflows against both the euro and the US dollar.
Equity risk, by contrast, took the hit. US index futures, including the Dow and S&P 500, opened lower as desks moved to price in the twin threat of a wider regional conflict and the inflationary drag that can follow a sharp jump in energy costs.
Gold rallied as the market reached for insurance. Reporting had gold up close to 3% in the same Monday session that oil surged. Worth noting for Aussie and Asia traders: when oil jumps and gold jumps together, the market is often telling you it is worried about both inflation and growth. That is a messy mix for central banks, including the RBA, because petrol-driven inflation can rise even as demand softens.
What this could mean for CFD risk management
Focus 1: map the event risk calendar
In headline-driven markets, prices can move faster than liquidity. The risk is not just being wrong; it can also be timing and execution risk in volatile conditions.
Some traders monitor which developments might change market sentiment (for example, official statements or verified operational updates). If you choose to trade, it may be worth understanding how price gaps and volatility could affect your position, including around session opens and major announcements.
Markets can gap or move quickly, and order execution (including stop orders, if used) may not occur at expected levels, especially in fast conditions or low liquidity. Features and outcomes depend on the product terms and market conditions.
Focus 2: watch the energy to inflation pathway
If crude remains elevated, markets may watch whether inflation expectations shift. If that occurs, it could influence rates, equities and FX and although outcomes depend on multiple factors and can change quickly.
That may be reflected in:
Global bond yields, as rates markets adjust.
Equity valuation sensitivity, particularly in long-duration and growth-heavy areas.
FX moves, including across the Australian dollar, Japanese yen, and some commodity-linked currencies.
Asia starts the week with a fresh geopolitical shock that is already being framed in oil terms, not just security terms. The first-order move may be a repricing of risk premia and volatility across energy and macro, while markets wait to see whether this becomes a durable physical disruption or a fast-fading headline premium.
At a glance
What happened: US officials said the US carried out “Operation Absolute Resolve”, including strikes around Caracas, and that Venezuela’s President Nicolás Maduro and his wife were taken into US custody and flown to the United States (subject to ongoing verification against the cited reporting).
What markets may focus on now: Headline-driven risk premia and volatility, especially in products and heavy-crude-sensitive spreads, rather than a clean “missing barrels” shock.
What is not happening yet: Early pricing has so far looked more like a headline risk premium than a confirmed physical supply shock, though this can change quickly, with analysts pointing to ample global supply as a possible cap on sustained upside.
Next 24 to 72 hours: Market participants are likely to focus on the shape of the oil “quarantine”, the UN track, and whether this stays “one and done” or becomes open-ended.
Australia and Asia hook: AUD as a risk barometer, Asia refinery margins in diesel and heavy, and shipping and insurance where the price can show up in friction before it shows up in benchmarks.
What happened, facts fast
Before anyone had time to workshop the talking points, there were strikes, there was a raid, and there was a custody transfer. US officials say the operation culminated in Maduro and his wife being flown to the United States, where court proceedings are expected.
Then came the line that turned a foreign policy story into a markets story. President Trump publicly suggested the US would “run” Venezuela for now, explicitly tying the mission to oil.
Almost immediately after that came a message-discipline correction. Secretary of State Marco Rubio said the US would not govern Venezuela day to day, but would press for changes through an oil “quarantine” or blockade.
That tension, between maximalist presidential rhetoric and a more bureaucratically describable “quarantine”, is where the uncertainty lives. Uncertainty is what gets priced first.
Source: Adobe images
Why this is price relevant now
What’s new versus known for positioning
What’s new, and price relevant, is that the scale and outcome are not incremental. A major military operation, a claimed removal of Venezuela’s leadership from the country, and a US-led custody transfer are not the sort of things markets can safely treat as noise.
Second, the oil framing is explicit. Even if you assume the language gets sanded down later, the stated lever is petroleum. Flows, enforcement, and pressure via exports.
Third, the embargo is not just a talking point anymore. Reporting says PDVSA has begun asking some joint ventures to cut output because exports have been halted and storage is tightening, with heavy-crude and diluent constraints featuring prominently.
What’s still unknown, and where volatility comes from
Key unknowns include how strict enforcement is on water, what exemptions look like in practice, how stable the on-the-ground situation is, and which countries recognise what comes next. Those are not philosophical questions. Those are the inputs for whether this is a temporary risk premium or a durable regime shift.
Political and legal reaction, why this drives tail risk
The fastest way to understand the tail here is to watch who calls this illegal, and who calls it effective, then ask what those camps can actually do.
Internationally, reaction has been fast, with emphasis on international law and the UN Charter from key partners, and UN processes in view. In the US, lawmakers and commentators have begun debating the legal basis, including questions of authority and war powers. That matters for markets because it helps define whether this is a finite operation with an aftershock, or the opening chapter of a rolling policy regime that keeps generating headlines.
Market mechanism, the core “so what”
Here’s the key thing about oil shocks. Sometimes the headline is the shock. Sometimes the plumbing is the shock.
Venezuela’s heavy-crude system: Orinoco production, key pipelines, and export/refining bottlenecks.
Volumes and cushion
Venezuela is not the world’s swing producer. Its production is meaningful at the margin, but not enough by itself to imply “the world runs out of oil tomorrow”. The risk is not just volume. It is duration, disruption, and friction.
The market’s mental brake is spare capacity and the broader supply backdrop. Reporting over the weekend pointed to ample global supply as a likely cap on sustained gains, even as prices respond to risk.
Quality and transmission
Venezuela’s barrels are disproportionately extra heavy, and extra heavy crude is not just “oil”. It is oil that often needs diluent or condensate to move and process. That is exactly the kind of constraint that shows up as grade-specific tightness and product effects.
Reporting has highlighted diluent constraints and storage pressure as exports stall. Translation: even if Brent stays relatively civil, watch cracks, diesel and distillates, and any signals that “heavy substitution” is getting expensive.
Heavy-light spread as a stress gauge: rising differentials can signal costly substitution and tighter heavy supply.
Products transmission, volatility first, pump later
If crude is the headline, products are the receipt, because products tell you what refiners can actually do with the crude they can actually get. The short-run pattern is usually: futures reprice risk fast, implied volatility pops; physical flows adapt more slowly; retail follows with a lag, and often with less drama than the first weekend of commentary promised.
For Australia and Asia desks, the bigger point is transmission. Energy moves can influence inflation expectations, which can feed into rates pricing and the dollar, and in turn affect Asia FX and broader risk, though the links are not mechanical and can vary by regime.
Some market participants also monitor refined-product benchmarks, including gasoline contracts such as reformulated gasoline blendstock, as part of that chain rather than as a stand-alone signal.
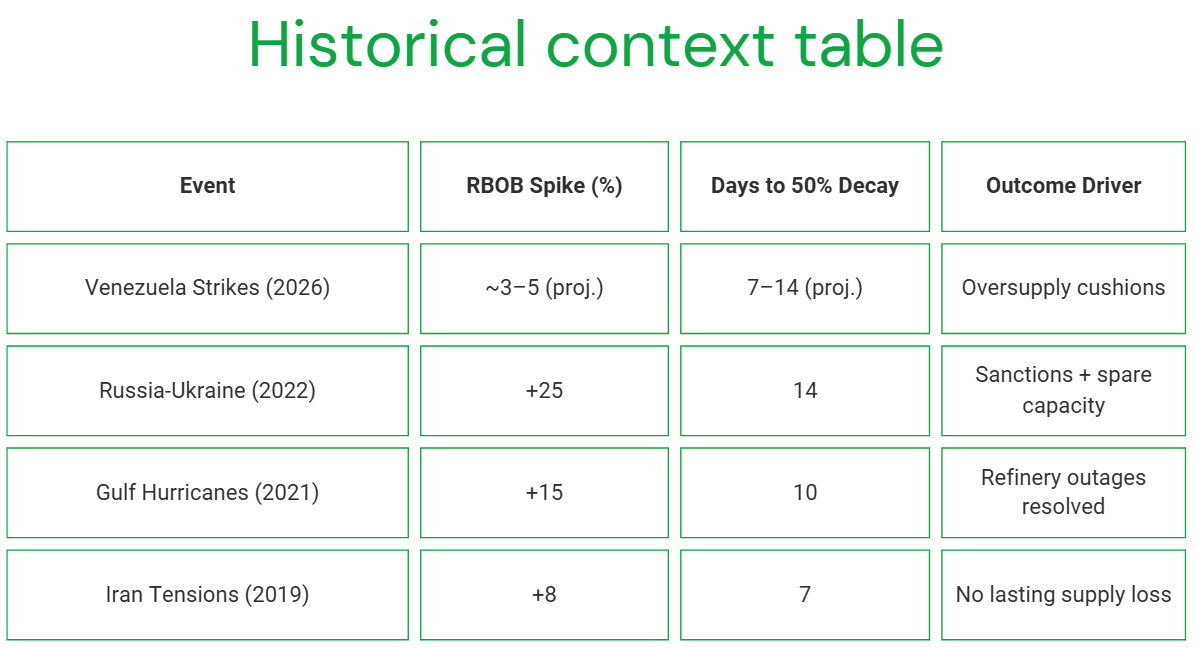
Historical context, the two patterns that matter
Two patterns matter more than any single episode.
Pattern A: scare premium. Big headline, limited lasting outage. A spike, then a fade as the market decides the plumbing still works.
Pattern B: structural. Real barrels are lost or restrictions lock in; the forward curve reprices; the premium migrates from front-month drama to whole-curve reality.
One commonly observed pattern is that when it is only premium, volatility tends to spike more than price. When it is structural, levels and time spreads move more durably.
The three possible market reactions
Contained, rhetorical: quarantine exists but porous; diplomacy churns; no second-wave actions. Premium bleeds out; volatility mean-reverts.
Escalation, prolonged control risk: “not governing” language loses credibility; repeated operations; allies fracture further. Longer-duration premium; broader risk-off impulse across FX and rates.
Australia and Asia angle
For Sydney, Singapore, and Hong Kong screens, this is less about Venezuelan retail politics and more about how a Western Hemisphere intervention bleeds into Asia pricing.
AUD is the quick and dirty risk proxy. Asia refiners care about the kind of oil and the friction cost. Heavy crude plus diluent dependency makes substitution non-trivial. If enforcement looks aggressive, the “price” can show up in freight, insurance, and spreads before it shows up in headline Brent.
Catalyst calendar, key developments markets may monitor
US policy detail: quarantine rules, enforcement posture, exemptions.
UN and allies: statements that signal whether this becomes a long legitimacy fight.
ASX defence stocks are back on more watchlists and according to the Stockholm International Peace Research Institute (SIPRI), global military spending reached approximately US$2.718 trillion in 2024, up 9.4% in real terms.
Australia’s current defence settings are set out in the 2024 National Defence Strategy and related investment planning documents, which outline long-term capability funding priorities. Furthermore, Canberra has pointed to A$330 billion of capability investment through 2034, including added funding for surface combatants, preparedness, long-range strike and autonomous systems.
Here is the part most people miss: not all ASX defence stocks are the same trade. Some sit close to naval shipbuilding. Some are counter-drone names and some are smaller, higher-risk operators where one contract may matter much more than the market assumes.
These five names are not a buy list, rather they are a practical watchlist for investors trying to understand where procurement momentum may actually show up on the ASX.
1) Austal (ASX: ASB)
Austal is one of the ASX-listed companies most directly exposed to Australia’s naval shipbuilding pipeline, although contract execution, margins and delivery timing remain important variables.
They aren't just winning random contracts; they have signed a massive legal agreement (the Strategic Shipbuilding Agreement) that makes them the official partner for building Australia's next generation of mid-sized military ships in Western Australia.
In February 2026, the government gave Austal the green light on a $4 billion project. This isn't for just one ship, it’s for 8 "Landing Craft Heavy" vessels. These are huge transport ships (about 100 metres long) designed to carry heavy tanks and equipment directly onto a beach. But here is the part most people miss, shipbuilding is a marathon, not a sprint.
As you can see in the delivery timeline, while construction starts in 2026, the final ship won't be delivered until 2038. For an investor, this means Austal has a "guaranteed" stream of income for the next 12 years, but they have to be very good at managing their costs over that long period to actually make a profit.
2) DroneShield (ASX: DRO)
If you have seen footage of small drones disrupting modern battlefields, DroneShield is building part of the "off switch". Its focus is counter-drone technology, including systems that detect, disrupt or defeat drones using electronic warfare, sensors and software-led tools, rather than relying only on traditional munitions.
By early 2026, DroneShield had moved beyond the label of a promising start-up and into a much larger commercial phase. It reported FY2025 revenue of A$216.5 million, up 276% from FY2024, and said it started FY2026 with A$103.5 million in committed revenue.
One point the market may overlook is the software layer in the model. DroneShield reported A$11.6 million in Software as a Service (SaaS) revenue in FY2025 and said it is working towards SaaS making up 30% of revenue within five years. Its subscription model includes software updates for deployed systems, which adds a growing stream of recurring revenue alongside hardware sales.
Among ASX defence stocks, DroneShield is one of the most direct ways to follow the counter-UAS theme. It is also one of the names where sentiment can swing quickly, because growth stories can rerate both up and down when order timing changes.
EOS builds both the "brain" and the "muscle" for military platforms. It is best known for remote weapon systems, which allow operators to control armed turrets from inside protected vehicles, and for high-energy laser systems aimed at counter-drone defence. EOS has said its unconditional backlog reached about A$459.1 million in early 2026, following a series of contract wins through 2025. That points to a much larger base of secured work, although delivery timing and revenue conversion still matter.
EOS signed a €71.4 million, about A$125 million, contract with a European customer for a 100-kilowatt high-energy laser weapon system. EOS says the system is designed for a low cost per shot and can engage up to 20 drones a minute. The Australian Government has set aside A$1.3 billion over 10 years for counter-drone capability acquisition, and EOS has disclosed that it was part of a successful LAND 156 bid team. That does not guarantee future revenue, but it does support medium-term visibility in a market the company is already targeting.
EOS reads as a rebound story, but one that still depends on execution. The company has reoriented around remote weapon systems, counter-drone systems and lasers, all areas tied to stronger defence spending. The key question is whether it can keep converting backlog and pipeline into delivered revenue while maintaining balance-sheet discipline.
4) Codan (ASX: CDA)
Codan is sometimes left out of casual defence stock lists because it is more diversified. That may be an oversight. In its H1 FY26 results, Codan said its Communications business designs mission-critical communications for global military and public safety markets. Communications revenue rose 19% to A$221.8 million. The company also said DTC delivered strong growth from defence and unmanned systems demand, with unmanned systems revenue up 68% to A$73 million. Codan said about half of that unmanned revenue was linked to operational defence applications in conflict zones.
This is where the story becomes more nuanced. In a basket of ASX defence stocks, Codan may offer a different profile, with less pure headline sensitivity, broader operating diversification and meaningful exposure to military communications and unmanned systems without being a single-theme name. That diversification may also mean the stock does not always trade like a pure-play defence name.
HighCom sits at the speculative end of this list, and it should be labelled that way. The company says its two continuing businesses are HighCom Armor, which supplies ballistic protection, and HighCom Technology, which supplies and maintains small and medium uncrewed aerial systems, counter-uncrewed aerial systems, and related engineering, integration, maintenance and logistics support for the ADF and other aligned regional militaries.
In H1 FY26, revenue from continuing operations fell 59% to A$10.9 million, while EBITDA moved to a A$5.4 million loss from a A$1.9 million profit a year earlier. HighCom also disclosed A$5.1 million in HighCom Technology revenue, including A$3.5 million from small uncrewed aerial systems (SUAS) spare parts and A$1.6 million from sustainment services provided to the Australian Department of Defence.
So yes, HighCom is one of the more financially sensitive ASX defence stocks on the board. But it is also the kind of smaller name that can show how procurement filters down into support, sustainment and specialist protection gear.
Key market observations
Track program milestones, not just political headlines. Contract awards, manufacturing starts, delivery schedules and sustainment work often matter more than a single announcement day.
Separate pure-play exposure from diversified exposure. DroneShield and EOS are closer to concentrated defence technology themes, while Codan brings communications exposure within a broader business mix.
Watch sovereign capability themes in Australia. Austal and EOS are tied to local manufacturing, integration and Australian supply chains, which supports the broader sovereign capability theme in this group.
Pay attention to balance sheets and cash conversion. Procurement momentum can be real even when timing gets messy. HighCom's latest half is a reminder of that.
Defence headlines can look immediate. Earnings usually are not. Austal's major naval work stretches into the next decade. EOS contracts are delivered over multiple years. DroneShield's order flow appears strong, but the company still separates committed revenue from broader pipeline opportunity. HighCom shows the other side of the coin. Exposure to procurement does not automatically translate into smooth financial execution.
References to ASX-listed defence stocks are general information only, not a recommendation to buy, sell or hold any security or CFD. These stocks can be highly volatile and are sensitive to contract timing, government policy, geopolitics, execution risk and market conditions. Backlog, pipeline and revenue expectations are not guarantees of future performance.
Three central banks are deciding rates simultaneously, Brent crude is swinging wildly around US$100 a barrel, and a war in the Middle East is rewriting the inflation outlook in real time. Whatever happens this week could set the tone for markets for the rest of 2026.
Quick facts
The Reserve Bank of Australia (RBA) announces its next cash rate decision on Tuesday, with markets now pricing a 66% chance of a second hike to 4.1%.
Some analysts have warned the Iran war could push US inflation to 3.5% by year-end and delay Fed rate cuts until September, making this week's FOMC dot plot the most closely watched in years.
Brent crude is flirting with US$100 a barrel after Iran launched what state media described as its "most intense operation since the beginning of the war."
RBA: Will Australia hike again?
The RBA raised the cash rate for the first time in two years to 3.85% at its February meeting after inflation picked up materially in the second half of 2025.
The question now is whether it moves again before even seeing the next quarterly CPI print, which isn't due until 29 April.
Deputy Governor Andrew Hauser acknowledged ahead of the meeting that policymakers face a genuinely divided decision, shaped by conflicting economic signals at home and growing instability abroad.
Financial markets currently assign around a 66% probability to another hike, with a May increase considered virtually certain regardless of what happens Monday.
The FOMC meets on March 17–18, with the policy statement scheduled for 2:00 pm ET on March 18 and Chair Jerome Powell's press conference at 2:30 pm. CME FedWatch shows a 99% probability that the Fed holds rates at 3.50% to 3.75%.
The real action is in the Summary of Economic Projections (SEP) and dot plot. The current median dot shows one 25-basis-point cut for 2026. If it shifts to two cuts, that is dovish and bullish for risk assets. If it shifts to zero cuts or adds a rate hike into the projection, markets could react in the other direction.
Further complicating matters, Powell's term as Federal Reserve Chair expires on May 23, 2026. Kevin Warsh is the leading candidate to replace him, viewed as more hawkish on monetary policy. Any comment from Powell on this transition could move markets independently of the rate decision itself.
Bank of Japan: Further tightening could be brought forward
The BOJ meets on March 18–19, with the decision expected Thursday morning Tokyo time. The current policy rate sits at 0.75% (a 30-year high), and the January 2026 meeting produced a hold in an 8-1 vote.
Governor Ueda has categorised the March meeting as "live," noting the timeline for further tightening could be "brought forward" if Shunto spring wage negotiations yield stronger-than-expected results.
Those results are due to begin flowing in during the week, making them the critical input for the BOJ's decision. Nomura expects 2026 Shunto wage hikes to come in around 5.0%, including seniority, with base pay growth of approximately 3.4%. If results confirm that trajectory, the case for a March hike strengthens considerably.
The complication is the global backdrop. Japan imports roughly 90% of its energy needs, and oil around US$100 per barrel is pushing up import costs and threatening to add inflationary pressure. A BOJ hike into a global oil shock would be an unusually bold move.
Most market participants still lean toward a hold at this meeting, with April or July seen as the more likely timing for the next move.
Brent crude briefly touched US$119.50 per barrel earlier in the week before dropping 17% to below US$80, then rebounding toward US$95 on mixed signals from Washington about the Strait of Hormuz.
As of Thursday, Brent was back over US$100 as Iran launched fresh attacks on commercial shipping and the IEA reserve release failed to bring meaningful relief.
In the scenario where a longer conflict inflicts damage to energy infrastructure, analysts estimate CPI could rise to 3.5% by the end of 2026, with gasoline prices approaching US$5 per gallon in the second quarter.
For this week, oil acts as a macro meta-variable. Every geopolitical headline, ceasefire signal, tanker attack, reserve release, and Trump comment could move equities, bonds and currencies in real time.
US-Israeli strikes on Iran launched on 28 February sent Brent crude surging past US$119 a barrel, gold above US$5,200, and defence stocks to all-time highs.
Against that backdrop, investors are focusing on a small group of commodity-linked names that may remain sensitive to further moves in oil, LNG and gold. The key question is whether the shock proves sustained, or whether a ceasefire, shipping normalisation, or policy action removes part of the geopolitical risk premium.
1. ExxonMobil (NYSE: XOM)
ExxonMobil has been one of the clearest beneficiaries of the price surge. Shares hit a record high of US$159.60 in early March and are up approximately 28% year-to-date.
The company produces 4.7 million barrels of oil equivalent per day, has a Permian Basin breakeven of around US$35/barrel, and is committed to US$20 billion in buybacks for 2026.
Wells Fargo raised its price target to US$183 from US$156 following the escalation, while broader analyst consensus sits around US$140–$144. However, XOM is already trading above many consensus targets, and disruption to its LNG partner QatarEnergy poses a near-term operational headwind.
Chevron touched a new 52-week high of US$196.76 in early March and has risen approximately 24% year-to-date.
The company's Brent breakeven for dividends and capital expenditure sits around US$50/barrel. This means that at current Oil prices above US$90, it is generating significant free cash flow.
However, Chevron has temporarily halted operations at a gas field off Israel's coast following missile activity in the region, and the stock has since pulled back more than 1% as the conflict directly affects its operations.
What to watch
Direct operational updates from Chevron's Middle East and Israeli assets.
Any further halts that could weigh on near-term production.
With Qatar having halted output after Iranian drone strikes, buyers across Asia and Europe are scrambling for alternative supply. Woodside, as one of Australia's largest LNG producers and exporters, sits outside the conflict zone and is well-positioned to benefit from rerouted demand.
Analysts caution that actual substitution takes time due to shipping and contract constraints, meaning the price uplift may be more durable than a simple spot trade. European TTF benchmark gas prices surged over 50% in a week, amplifying the margin environment for non-Middle Eastern LNG producers.
What to watch
The pace and timeline of any Qatar LNG production restart.
If QatarEnergy remains offline for weeks, Woodside could begin re-contracting European buyers at elevated spot prices.
An Australian dollar move higher could be a headwind worth tracking for USD-denominated earnings.
4. Cheniere Energy (NYSE: LNG)
Alongside Woodside, Cheniere is the most direct US beneficiary of the Qatar LNG disruption. As the largest LNG exporter in the United States, it saw intraday strength at the start of the conflict week.
US domestic energy production has buffered American consumers from the worst of the shock, but the export premium has widened as European and Asian buyers pay up for non-Gulf supply.
The trade is "geopolitically sensitive," and any resolution could reverse upside quickly. But for as long as Hormuz and Gulf gas infrastructure remain compromised, Cheniere is positioned to benefit structurally.
What to watch
Any diplomatic breakthrough that reopens Gulf shipping lanes.
Announcements of new long-term offtake contracts signed at current elevated prices.
Gold surged 5.2% in a single session on 1 March, touching US$5,246/oz, as markets sought safe-haven assets. Newmont, the world's largest gold producer, has seen its reserves effectively revalued at these prices.
It is up alongside gold's 24% year-to-date gain, and its all-in sustaining costs remain largely fixed.
However, Gold miners sold off sharply on 4 March, and Newmont fell nearly 8% in a single session as broader risk-off deleveraging hit precious metals equities.
The stock has recovered since, but volatility remains high. For longer-duration investors, analysts note that "safe" mining jurisdictions such as Canada, Australia, and Nevada are commanding fresh premiums as Middle East instability raises the value of geopolitically secure supply.
What to watch
Whether gold can hold above US$5,000/oz.
A prolonged conflict could accelerate an M&A cycle in junior gold miners.
A ceasefire or broad equity deleveraging event as the primary risk to monitor.
Lockheed Martin reached a new all-time high of US$676.70 on 3 March, up over 4% for the day. Its F-35 fighters, precision-guided munitions, THAAD systems, and HIMARS rocket artillery are central to the ongoing air campaign.
The US Department of Defence is moving to replenish munitions stockpiles, and Trump's stated ambition to raise the US defence budget to US$1.5 trillion by 2027 adds a longer-term structural tailwind beyond the immediate conflict.
Defence stocks are rising amid classic geopolitical risk pricing, but investors should note that actual contract flow takes time to translate into earnings, and valuations already reflect considerable optimism.
What to watch
The pace of US Department of Defence munitions replenishment orders.
How quickly contract wins translate into backlog growth.
Barrick is tracking gold's historic run alongside Newmont, with the stock up sharply year-to-date. It sits at a roughly US$78 billion market capitalisation and is reporting record free cash flow projections as its all-in sustaining costs remain well below current spot prices.
Like Newmont, it experienced a sharp single-session selloff of more than 8% during the broader 4 March deleveraging event, before partially recovering.
Royalty and streaming companies such as Wheaton Precious Metals (WPM) are being favoured by some investors as a more inflation-protected way to access gold upside, given their lower operational cost exposure. But Barrick remains one of the world’s largest listed gold miners, with earnings that are highly sensitive to changes in the gold price
What to watch
Gold's ability to hold above US$5,000/oz.
Any Barrick moves toward junior miner acquisitions.
Energy cost inflation, as rising fuel prices could begin to squeeze miner operating margins.