Anda sedang memperhatikan layar pada pukul 14:00. Bank sentral mengumumkan bahwa mereka mempertahankan suku bunga tetap stabil. Ini persis seperti yang diperkirakan pasar. Namun, indeks S&P 500 tiba-tiba melonjak 1% dan dolar AS justru melemah.
Jika pergerakan seperti ini pernah membuat Anda lengah, Anda tidak sendirian. Banyak trader tahu bahwa suku bunga itu penting, tetapi seringkali kesulitan menjelaskan mengapa keputusan untuk mempertahankan suku bunga (tanpa ada perubahan sama sekali) tetap dapat memicu volatilitas pasar yang tajam.
Mengapa suku bunga itu penting
Suku bunga bank sentral sering kali digambarkan sebagai "harga dari uang". Karena harga uang memengaruhi bagaimana investor menilai berbagai aset, ekspektasi suku bunga bisa menjadi salah satu kekuatan utama yang menggerakkan pasar.
Apa yang dimaksud dengan suku bunga bank sentral sebenarnya
Pada dasarnya, suku bunga bank sentral adalah tingkat bunga yang dikenakan oleh bank sentral ketika meminjamkan uang kepada bank-bank komersial. Tingkat bunga tersebut kemudian mengalir ke ekonomi yang lebih luas dan pasar keuangan.
Anda tidak membutuhkan gelar sarjana ekonomi untuk bisa trading. Namun, sangat membantu jika Anda memahami siapa yang menentukan harga uang tersebut, dan bagaimana pasar merespons ketika harga itu diperkirakan akan berubah.
Ada lima bank sentral utama yang memegang peran kunci dalam arus modal global:
Hawkish dan dovish: dua kata yang wajib diketahui trader
Jika Anda membaca berita atau analisis keuangan, Anda akan sering menjumpai dua kata ini: hawkish dan dovish. Istilah-istilah ini menggambarkan ke mana arah kecenderungan kebijakan bank sentral. Ini bukan tentang hal yang "baik" atau "buruk".
Sebuah bank sentral dikatakan hawkish ketika mereka cenderung memilih suku bunga yang lebih tinggi atau kebijakan moneter yang lebih ketat guna mengendalikan inflasi. Sebagai contoh, jika gubernur bank sentral mengatakan, "Kami tetap sangat waspada terhadap risiko inflasi dan siap untuk bertindak," pasar mungkin mengartikannya sebagai sinyal hawkish.
Sebuah bank sentral dikatakan dovish ketika mereka lebih condong ke arah suku bunga rendah atau kebijakan longgar untuk mendukung pertumbuhan ekonomi. Jika gubernur mencatat bahwa "risiko penurunan pada pasar tenaga kerja telah meningkat," para trader mungkin menangkap hal ini sebagai pergeseran dovish.
Pasar dapat merespons perubahan nada bicara (tone) ini sama agresifnya dengan keputusan suku bunga yang sebenarnya.
← Kebijakan Longgar/Pertumbuhan
Kebijakan Ketat/Inflasi →
Dovish
"Risiko penurunan pada pasar tenaga kerja telah meningkat."
- Cenderung mengarah ke suku bunga yang lebih rendah
- Fokus pada mendukung pertumbuhan ekonomi
- Seringkali memperlemah mata uang domestik
- Umumnya mendukung pasar saham dan emas
Hawkish
"Kami tetap sangat waspada terhadap risiko inflasi."
- Cenderung mengarah ke suku bunga yang lebih tinggi
- Fokus penuh pada pengelolaan inflasi
- Seringkali memperkuat mata uang domestik
- Umumnya menekan pasar saham dan emas
Perhatikan ekspektasi, bukan hanya keputusannya
Keputusan bank sentral barulah setengah dari cerita. Pasar biasanya bergerak berdasarkan perbedaan antara apa yang terjadi dengan apa yang sebelumnya diharapkan oleh para trader.
Misalnya, keputusan mempertahankan suku bunga tetap bisa mendorong pasar bergerak tajam jika pernyataan bank sentral terdengar lebih hawkish dari perkiraan. Sebaliknya, kenaikan suku bunga bisa jadi tidak berdampak besar jika para trader sudah mengantisipasi dan memperhitungkannya (priced-in). Pertanyaan kuncinya bukanlah 'Apakah mereka menaikkan, menahan, atau menurunkan?' melainkan 'Apakah ini mengubah arah suku bunga ke depannya?'
Mengapa pasar bergerak sebelum keputusan resmi dibuat
Ini adalah konsep yang sangat krusial: pasar tidak menunggu keputusan bank sentral diketuk. Mereka sudah memperhitungkan perkiraan arah suku bunga jauh-jauh hari.
Ketika bank sentral mengumumkan keputusan suku bunga yang persis sama dengan ekspektasi pasar, reaksi yang terjadi biasanya terbatas. Pergerakan yang lebih besar sering kali muncul ketika keputusan, pernyataan tertulis, atau konferensi pers berbeda dari apa yang telah dihargai oleh pasar.
Bayangkan sebuah skenario di mana para trader memperkirakan bank sentral akan menaikkan suku bunga tiga kali tahun ini. Jika bank menaikkan suku bunga hari ini tetapi memberi isyarat bahwa ini mungkin menjadi kenaikan terakhirnya, pasar bisa menganggap kenaikan tersebut sebagai kejutan yang dovish. Pasar saham justru bisa menguat meskipun suku bunga dinaikkan.
Jebakan umum
Pemangkasan suku bunga dapat mengecewakan jika trader mengharapkan pemangkasan yang lebih besar, atau jika bank sentral mengisyaratkan pengurangan yang lebih sedikit di masa depan. Kenaikan suku bunga bisa direspons positif jika kenaikannya tidak seagresif yang ditakutkan, atau jika prospek ke depannya terdengar melunak.
Sebelum menilai keputusan bank sentral, pertanyaan utamanya adalah: apa yang sebenarnya sudah diperhitungkan oleh pasar saat ini?
Terminal rate (Suku bunga terminal)
Para trader juga memantau konsep yang dikenal sebagai terminal rate. Ini adalah tingkat suku bunga puncak atau akhir yang diperkirakan akan dicapai oleh bank sentral pada akhir siklus kenaikan atau penurunan tarifnya.
Terminal rate sangat penting karena membantu menjadi acuan bagi imbal hasil obligasi (bond yields), valuasi saham, dan perbedaan nilai tukar mata uang asing (FX). Jika ekspektasi terminal rate bergeser lebih tinggi, pasar dapat melakukan penyesuaian harga secara tajam, bahkan jika suku bunga saat ini belum berubah.
Faktor-faktor yang menggerakkan ekspektasi suku bunga
Ekspektasi suku bunga selalu berubah secara dinamis. Perubahan ini didorong oleh rilis data ekonomi terbaru yang memaksa para trader untuk menilai kembali apa yang kemungkinan akan dilakukan bank sentral selanjutnya.
Penggerak Ekspektasi Suku Bunga
Ekspektasi Naik
Inflasi bergerak lebih tinggi dari perkiraan, artinya bank sentral mungkin perlu menaikkan suku bunga lebih banyak atau menahannya di level tinggi lebih lama.
Ekspektasi Turun
Inflasi mendingin lebih cepat dari perkiraan, memberikan ruang bagi bank sentral untuk memangkas suku bunga.
Ekspektasi Naik
Lapangan kerja kuat dan upah meningkat, menunjukkan bahwa ekonomi mampu menyerap suku bunga yang lebih tinggi.
Ekspektasi Turun
Sektor pekerjaan melemah dan angka pengangguran meningkat, meningkatkan tekanan untuk segera mendukung pertumbuhan ekonomi.
Ekspektasi Naik
Pertumbuhan ekonomi tangguh, mengurangi urgensi atau kebutuhan akan suku bunga yang lebih rendah.
Ekspektasi Turun
Pertumbuhan melambat atau berkontraksi, meningkatkan peluang adanya pelonggaran kebijakan moneter.
Ekspektasi Naik
Gubernur bank sentral memberi sinyal kekhawatiran tentang inflasi, mengisyaratkan kenaikan lanjutan, atau menunjukkan suku bunga akan bertahan tinggi lebih lama.
Ekspektasi Turun
Gubernur menandai adanya kelemahan ekonomi, mengisyaratkan peluang pemotongan, atau menyebutkan bahwa opsi pemotongan suku bunga mulai didiskusikan.
Ekspektasi Turun (Sifatnya Mengesampingkan)
Tekanan perbankan, gagal bayar kredit, atau disfungsi pasar dapat mendorong bank sentral melakukan jeda (pause) meskipun risiko inflasi ada. Peristiwa risiko sistemik dapat memicu pemotongan darurat di luar jadwal pertemuan resmi.
Bagaimana elemen kejutan bisa menggerakkan pasar
Keputusan suku bunga hanyalah satu bagian kecil. Arah reaksi pasar sangat bergantung pada apa yang sebenarnya terjadi dibandingkan dengan apa yang diharapkan sebelumnya.
Apa Yang Terjadi
Lebih ketat dari perkiraan pasar
Bank menaikkan suku bunga ATAU memberi sinyal pengurangan pemotongan
Dampak Pasar
Dolar AS bisa menguat
Emas bisa berada dalam tekanan
Harga obligasi bisa turun
Imbal hasil (yields) bisa naik
Saham pertumbuhan bisa tertekan
Apa Yang Terjadi
Lebih longgar dari perkiraan pasar
Bank memotong suku bunga ATAU memberi sinyal pemotongan lebih banyak
Dampak Pasar
Dolar AS bisa melemah
Emas bisa mendapat dukungan
Harga obligasi bisa naik
Imbal hasil (yields) bisa turun
Saham pertumbuhan terdukung
Skenario
Sesuai Ekspektasi
Apa Yang Terjadi
Tidak ada informasi baru
Keputusan sesuai dengan harga pasar
Dampak Pasar
Reaksi pasar cenderung diredam
Posisi pra-pengumuman berbalik
Fokus kembali beralih ke data
Bagaimana ekspektasi suku bunga menggerakkan pasar yang Anda perdagangkan
Karena dolar adalah unit hitung utama untuk begitu banyak aset global, pergerakannya secara mekanis memengaruhi harga aset-aset tersebut. Empat korelasi berikut adalah yang paling penting bagi para trader yang aktif di pasar ini.
Emas - XAU/USD
Menjadi lebih mahal bagi pembeli asing
↓
Minyak - WTI/Brent
Penetapan harga berbasis Dolar memicu hambatan
↓
AUD/USD
Mata uang risiko + komoditas terkena dampak ganda
↓
S&P 500
Tekanan pada pendapatan perusahaan multinasional
↓
Dampak arah pergerakan yang tipikal terjadi ketika dolar AS menguat. Ini adalah kecenderungan, bukan jaminan pasti.
Obligasi
Ekspektasi suku bunga adalah penggerak utama imbal hasil obligasi jangka pendek. Ketika ekspektasi penurunan suku bunga naik, harga obligasi cenderung naik dan imbal hasil (yield) cenderung turun. Sebaliknya, ketika ekspektasi kenaikan suku bunga meningkat, harga obligasi cenderung turun dan imbal hasil cenderung naik. Pelajari pergeseran pelacakan terbalik ini di dalam kerangka kerja terperinci kami yang menjelaskan apa itu imbal hasil obligasi.
Saham (Equities)
Suku bunga yang lebih tinggi meningkatkan tingkat diskonto yang diterapkan pada pendapatan masa depan perusahaan. Hal ini dapat mengurangi nilai sekarang (present value) yang diberikan investor pada perusahaan yang berbasis pertumbuhan. Itulah sebabnya indeks yang sensitif terhadap suku bunga seperti Nasdaq dapat jatuh tajam ketika ekspektasi suku bunga naik di luar dugaan.
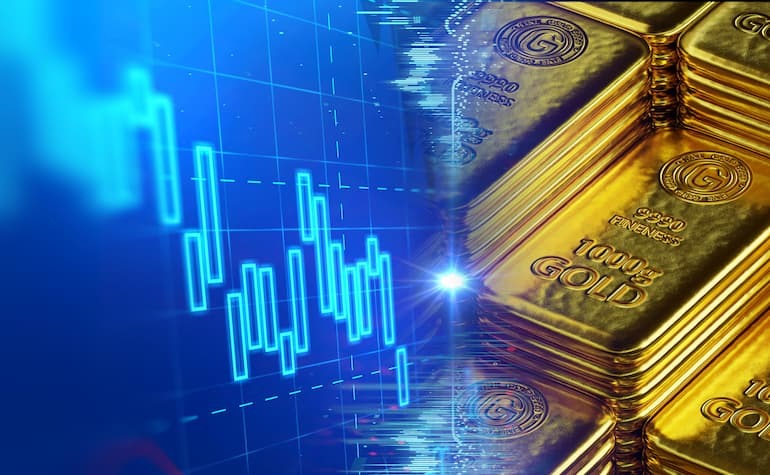
Emas
Ekspektasi suku bunga yang lebih tinggi dapat mendorong imbal hasil riil (real yields) bergerak naik. Hal tersebut meningkatkan biaya peluang (opportunity cost) dalam memegang emas, karena emas tidak menghasilkan imbal hasil/bunga langsung. Sebaliknya, ekspektasi suku bunga yang lebih rendah dapat mendukung emas dengan mengurangi biaya peluang tersebut.
FX, Termasuk AUD/USD dan EUR/USD
Perbedaan suku bunga (interest rate differentials) antar negara adalah penggerak utama nilai tukar mata uang asing. Ketika Fed diperkirakan akan menahan suku bunga lebih tinggi dan lebih lama daripada RBA, perbedaan suku bunga tersebut dapat menguntungkan dolar AS dan menekan pasangan mata uang AUD/USD.
Kripto, Termasuk Bitcoin
Ekspektasi suku bunga yang lebih tinggi dapat menurunkan selera pasar terhadap aset berisiko tinggi dan ber-beta tinggi, karena modal cenderung bergeser ke instrumen yang lebih aman dan menghasilkan bunga pasti. Ekspektasi suku bunga yang lebih rendah dapat menyuntikkan dukungan bagi aset yang digerakkan oleh likuiditas termasuk Bitcoin, meskipun pasar kripto secara khusus juga dipengaruhi oleh regulasi, sentimen, posisi pasar (positioning), serta faktor spesifik aset itu sendiri.