Indices Trading – What are Indices and how to use CFDs to trade them
Lachlan Meakin
22/9/2023
•
0 min read
Share this post
Copy URL
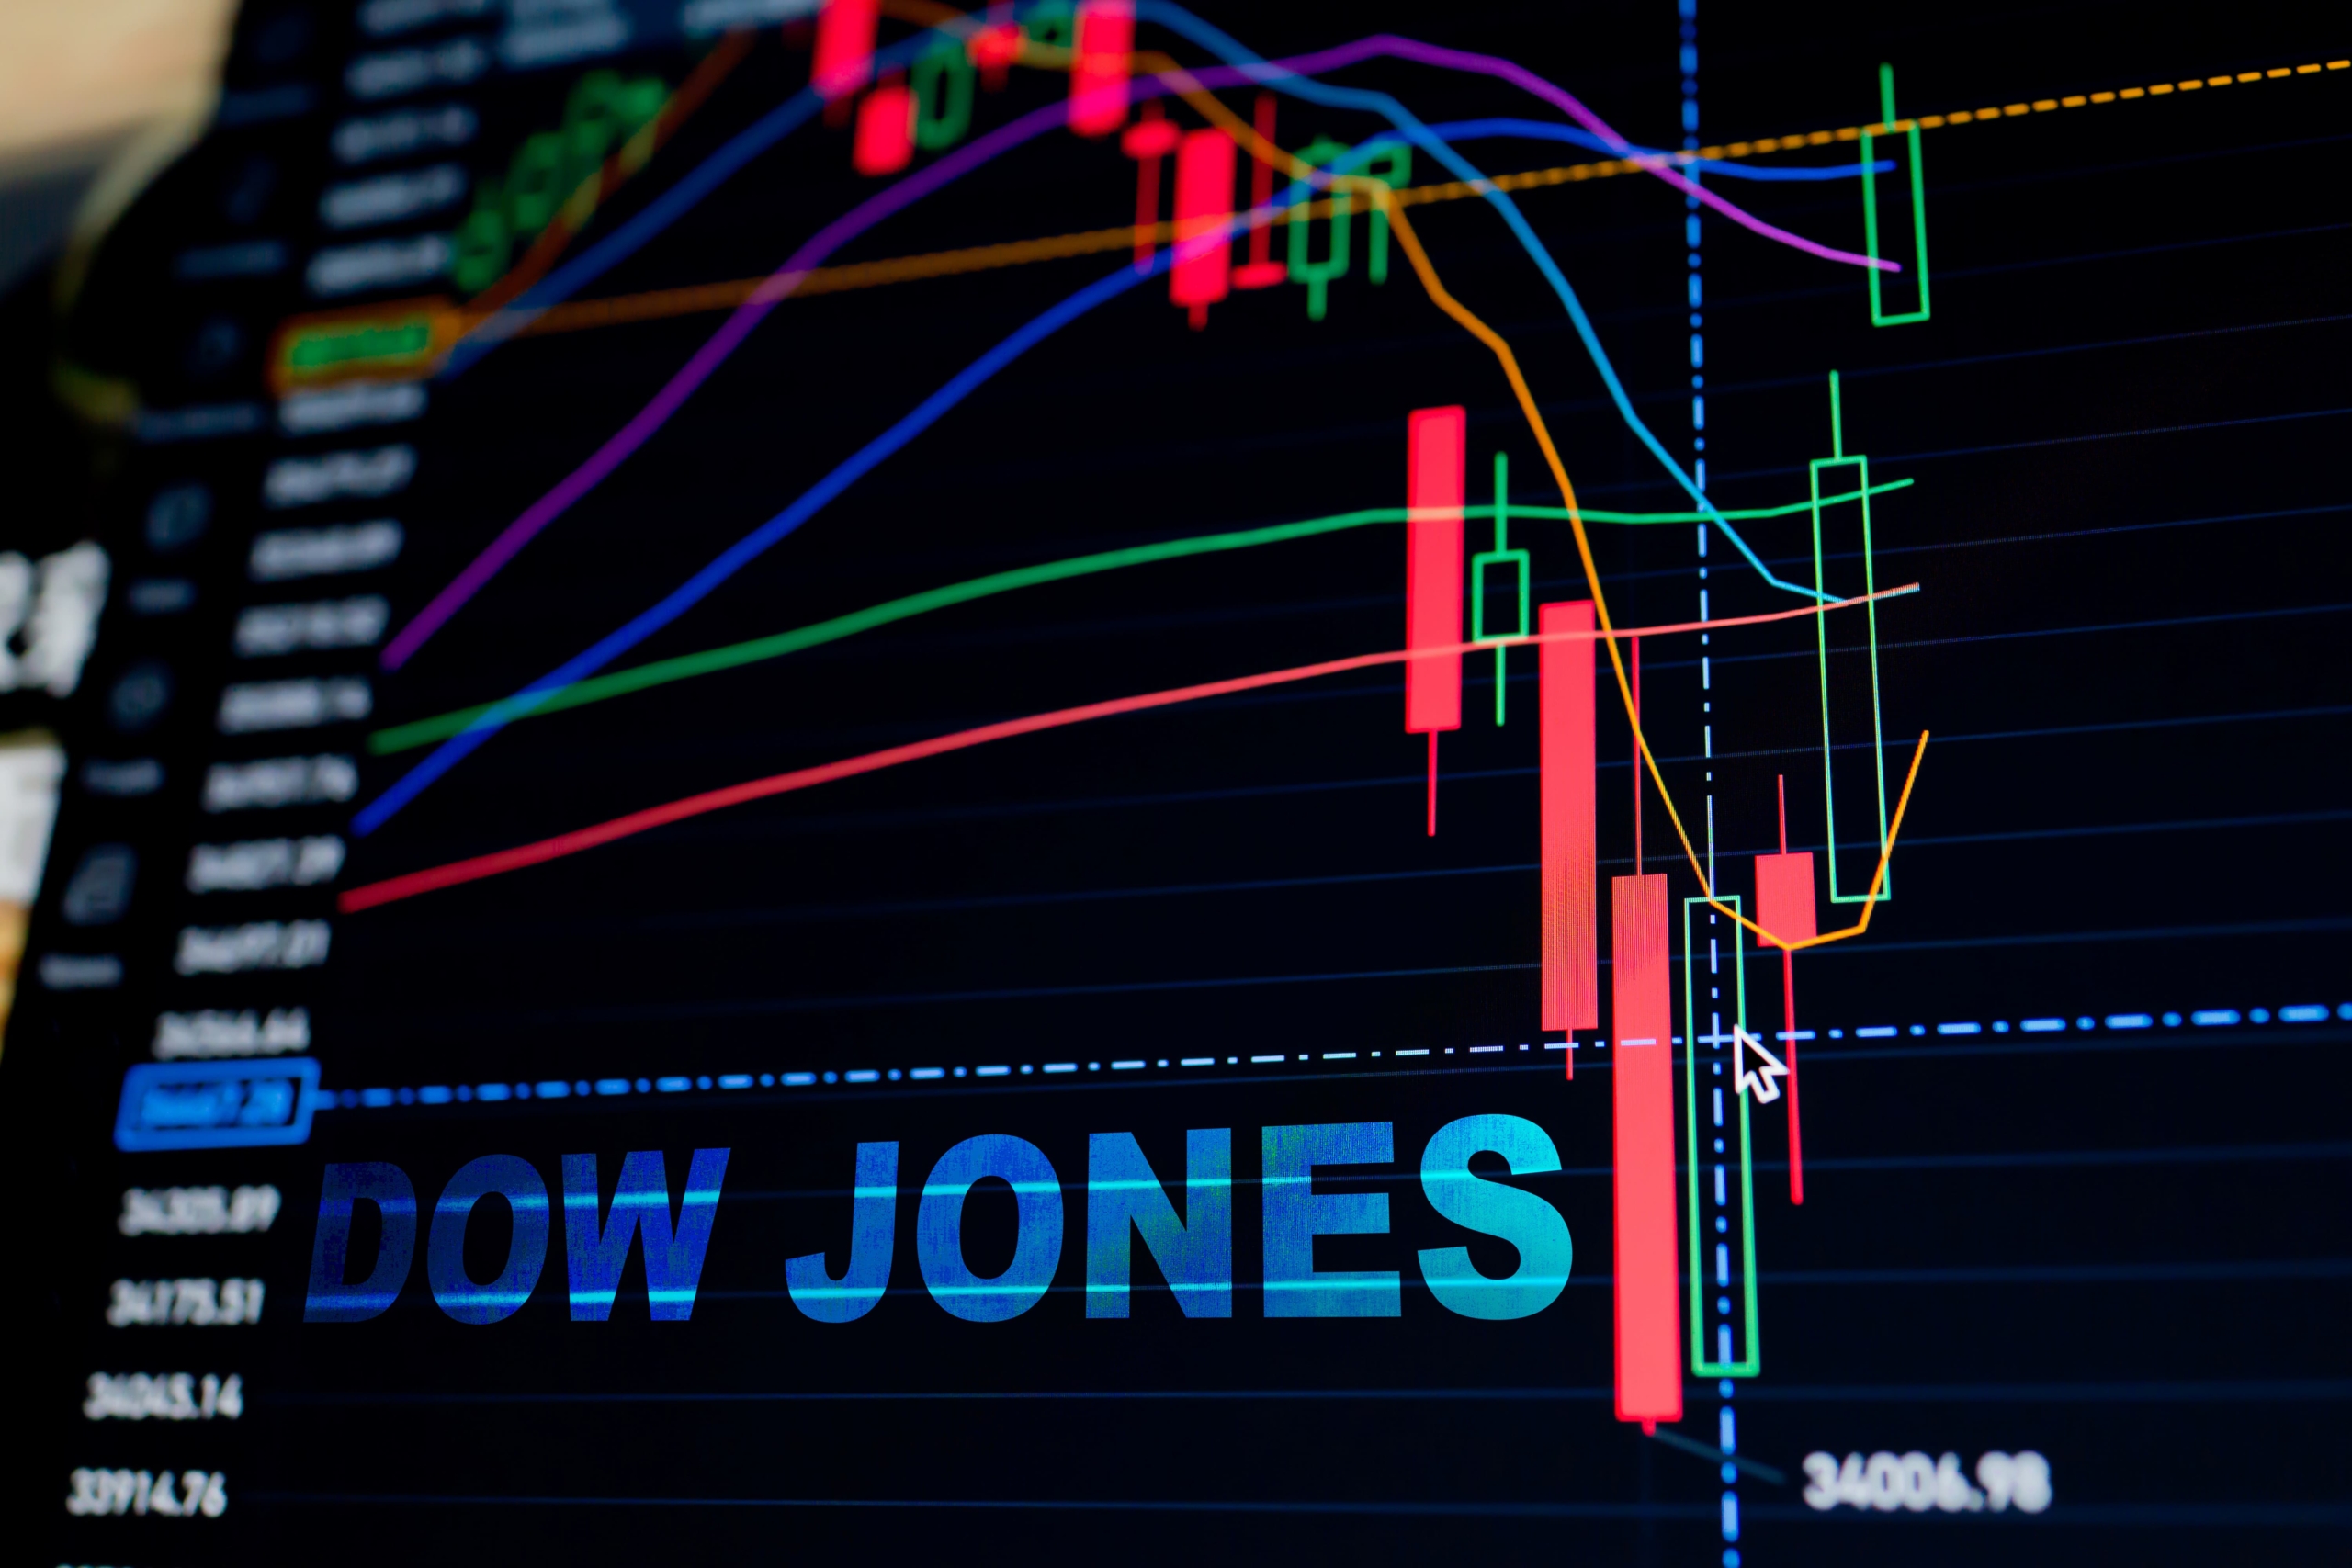
Index trading is one of the most popular class of markets to trade for CFD traders, rivalling major FX pairs in trading volume, but what is indices trading and how does trading them with CFDs work? Most people will be familiar with the names of the major stock indices from financial reports in all forms of media, the most popular stock indices of CFD traders and the stocks they track are below: USA The Dow Jones Industrial average - 30 largest blue-chip companies in the US NASDAQ Composite Index – Top 100 largest non-financial companies in the US (Mostly Tech) S&P 500 Index - 500 large cap companies in the US (Bank heavy) Europe and UK FTSE 100 – Top 100 UK companies CAC 40 – Top 40 French companies DAX 40 – Top 40 German companies (Formerly known as the DAX30 which it may still be labelled as) Asia and Australia ASX 200 – Top 200 Australian companies Hang Seng - A selection of the largest companies in Hong Kong. Nikkei 225 - Consists of 225 stocks in the Prime Market of the Tokyo Stock Exchange Some of the advantages of trading indices: You can take a broad view of the health (or not) of that countries stock market, i.e. rather than take a position in a single stock, take a position in a basket of stocks by buying or selling the index they are components of.
Higher leverage available to trade stock indices, up to 100:1 for qualified Pro clients. Extended trading hours, you can take positions in most indices up to 23 hours a day, far greater hours than the underlying stock exchanges. Take positions long or short with ease to profit from both a rising and falling market.
When you take a Long (Buy) position you profit if the market moves up, a Short (Sell) position will profit when the market moves down. How Indices are priced and understanding your position size Stock Indices are priced in the native currency i.e., the Dow Jones (WS30 on the GO Markets platform) is priced in USD, the FTSE100 in GBP, the ASX200 in AUD etc. This is important to keep in mind when choosing your position size, it also important to know the specifications of the contract you are trading is to make sure you understand the lot sizing before entering a trade.
You can check the specifications of any contract on MT4 and MT5 by right clicking it in the Market Watch Window and selecting “Specification” An example specification of the Dow (WS30) is below (MT4 specs, MT5 is very similar): You can see in the example above that the WS30 contract with GO Markets has a contract size of 1, this means 1 lot will equal $1 USD per point movement in PnL if you take a position. e.g., if you buy 1 lot at a price of 33670 and the price rises to 33680 you are in profit by 10 points, which would equal $10 USD Most indices will have a contract size of 1, though it is advisable to always check as some may have different values, an example in the S&P 500 (US500) which has a contract size of 10. It is important to understand the contract size and base currency of the index you are trading before entering a trade to avoid any nasty surprises. Main drivers of what moves an Index’s price.
In choosing which Index to trade it is also important to understand the drivers of that index and it’s component stocks. All Indexes will have some common drivers, such as global growth concerns, geopolitical events and non-US indices will be affected (fairly or not) by what US markets are doing. Each index will also have its own individual drivers as well though.
Examples The NASDAQ (NDX100) is heavily weighted with mega cap tech stocks, the health of the Tech sector will heavily influence its price. The ASX200 and FTSE100 both have large contingents of miners, meaning commodity prices will be big drivers of these 2 indexes, more so the ASX200. The Russell 2000 has many regional and mid-size banks as its component stocks, which is why during the recent banking crisis it underperformed other US indices.
Understanding these unique drivers for each Index is recommended to make the best trading decisions possible. In Summary, trading Indices opens up some great opportunities to position yourself to profit from market moves, spreads on Indices with GO Markets are some of the best in the CFD industry, with tight spreads in and out of hours( Some brokers will artificially increase spreads on Indices outside the stock market hours of that country) They allow you to seamlessly take long or short positions to speculate for profit, or to headge existing stock positions from an overnight move. You can click the link below to learn more about Index trading with GO Markets. https://www.gomarkets.com/au/index-trading-cfds/
By
Lachlan Meakin
Head of Research, GO Markets Australia.
Artikel ini ditulis oleh analis dan kontributor GO Markets berdasarkan analisis independen atau pengalaman pribadi mereka. Pandangan, opini, atau gaya trading yang diungkapkan sepenuhnya merupakan milik penulis, dan tidak mewakili atau dibagikan oleh GO Markets. Setiap saran yang diberikan bersifat “umum” dan tidak mempertimbangkan tujuan, situasi keuangan, atau kebutuhan pribadi Anda. Sebelum mengambil tindakan berdasarkan saran tersebut, pertimbangkan apakah saran tersebut sesuai dengan tujuan, situasi keuangan, dan kebutuhan Anda. Jika saran tersebut berkaitan dengan perolehan produk keuangan tertentu, Anda harus memperoleh Pernyataan Pengungkapan (Disclosure Statement/DS) dan dokumen hukum lainnya yang tersedia di situs web kami sebelum membuat keputusan apa pun.
2025 has seen a material decline in the fortunes of the greenback. A technical structure breakdown early in the year was followed by a breach of the 200-day moving average (MA) at the end of Q1. The index then entered correction territory, printing a three-year low at the end of Q2.
Since then, we have seen attempts to build a technical base, including a re-test of the end-of-June lows in mid-September. However, buying pressure has not been strong enough to push price back above the technically critical and psychologically important 100 level.
What the levels suggest from here
As things stand, the index remains more than 10% lower for 2025. On this technical view, the index may revisit the 96 area. However, technical levels can fail and outcomes depend on multiple factors.
US dollar index
Source: TradingView
The key question for 2026
The key question remains: are we likely to see further losses in the early part of next year and beyond, or will current support hold?
We cannot assess the US dollar in isolation and any outlook is shaped by internal and global factors, not least its relative strength versus other major currencies. Many of these drivers are interrelated, but four potential headwinds stand out for any US dollar recovery. Collectively, they may keep downside pressure in play.
Four headwinds for any US dollar recovery
1. The US dollar as a safe-haven trade
One scenario where US dollar support has historically been evident is during major global events, slowdowns and market shocks. However, the more muted response of the US dollar during risk-off episodes this year suggests a shift away from the historical norm, with fewer sustained US dollar rallies.
Instead, throughout 2025, some investors appearedto favour gold, and at other times, FX and even equities, rather than into the US dollar. If this change in behaviour persists through 2026, it could make recovery harder, even if global economic pressure builds over the year ahead.
2. US versus global trade
Trade policy is harder to measure objectively, and outcomes can be difficult to predict. That said, trade battles driven by tariffs on US imports are often viewed as an additional potential drag on the US dollar.
The impact may be twofold if additional strain is placed on the US economy through:
a slowdown in global trade volumes as impacted countries seek alternative trade relationships, with supply chain distortions that may not favour US growth
pressure on US corporate profit margins as tariffs lift costs for importers
3. Removal of quantitative tightening
The Fed formally halted its balance sheet reduction, quantitative tightening (QT), as of 1 December 2025, ending a program that shrank assets by roughly US$2.4 trillion since mid-2022.
Traditionally, ending QT is seen as marginally negative for the US dollar because it stops the withdrawal of liquidity, can ease global funding conditions, and may reduce the scarcity that can support dollar demand. Put simply, more dollars in the system can soften the currency’s support at the margin, although outcomes have varied historically and often depend on broader financial conditions.
4. Interest rate differential
Interest rate differential (IRD) is likely to be a primary driver of US dollar strength, or otherwise, in the months ahead. The latest FOMC meeting delivered the expected 0.25% cut, with attention on guidance for what may come next.
Even after a softer-than-expected CPI print, markets have been reluctant to price aggressive near-term easing. At the time of writing, less than a 20% chance of a January cut is priced in, and it may be March before we see the next move.
The Fed is balancing sticky inflation against a jobs market under pressure, with the headline rate back at levels last seen in 2012. The practical takeaway is that a more accommodative stance may add to downward pressure on the US dollar.
Current expectations imply around two rate cuts through 2026, with the potential for further easing beyond that, broadly consistent with the median projections shown in the chart below. These are forecasts rather than guarantees, and they can shift as economic data and policy guidance evolve.
Source: US Federal Reserve, Summart of Economic Projections
The “Magnificent Seven” technology companies are expected to invest a combined $385 billion into AI by the end of 2025.
Microsoft is positioning itself as the platform leader. Nvidia dominates the underlying AI infra. Google leads in research. Meta is building open-source tech. Amazon – AI agents. Apple — on-device integration. And Tesla pioneering autonomous vehicles and robots.
The “Big 4” tech companies' AI spending alone is forecast at $364 billion.
With such enormous sums pouring into AI, is this a winner-take-all game?
Or will each of the Mag Seven be able to thrive in the AI future?
Microsoft: The AI Everywhere Strategy
Microsoft has made one of the biggest bets on AI out of the Mag Seven — adopting the philosophy that AI should be everywhere.
Through its deep partnership with OpenAI, of which it is a 49% shareholder, the company has integrated GPT-5 across its entire ecosystem.
Key initiatives:
GPT-5 integration across consumer, enterprise, and developer tools through Microsoft 365 Copilot, GitHub Copilot, and Azure AI Foundry
Azure AI Foundry for unified AI development platform with model router technology
Copilot ecosystem spanning productivity, coding, and enterprise applications with real-time model selection
$100 billion projected AI infrastructure spending for 2025
Microsoft’s centrepiece is Copilot, which can now detect whether a prompt requires advanced reasoning and route to GPT-5's deeper reasoning model.
This (theoretically) means high-quality AI outputs become invisible infrastructure rather than a skill users need to learn.
However, this all-in bet on OpenAI does come with some risks. It is putting all its eggs in OpenAI's basket, tying its future success to a single partnership.
Elon Musk warned that "OpenAI is going to eat Microsoft alive"[/caption]
Google: The Research Strategy
Google’s approach is to fund research to build the most intelligent models possible. This research-first strategy creates a pipeline from scientific discovery to commercial products — what it hopes will give it an edge in the AI race.
Key initiatives:
Over 4 million developers building with Gemini 2.5 Pro and Flash
Ironwood TPU offering 3,600 times better performance compared to Google’s first TPU
AI search overviews reaching 2 billion monthly users across Google Search
DeepMind breakthroughs: AlphaEvolve for algorithm discovery, Aeneas for ancient text interpretation, AlphaQubit for quantum error detection, and AI co-scientist systems
Google’s AI research branch, DeepMind, brings together two of the world's leading AI research labs — Google Brain and DeepMind — the former having invented the Transformer architecture that underpins almost all modern large language models.
The bet is that breakthrough research in areas like quantum computing, protein folding, and mathematical reasoning will translate into a competitive advantage for Google.
Today, we're introducing AlphaEarth Foundations from @GoogleDeepMind , an AI model that functions like a virtual satellite which helps scientists make informed decisions on critical issues like food security, deforestation, and water resources. AlphaEarth Foundations provides a… pic.twitter.com/L1rk2Z5DKk
Meta has made a somewhat contrarian bet in its approach to AI: giving away their tech for free. The company's Llama 4 models, including recently released Scout and Maverick, are the first natively multi-modal open-weight models available.
Key initiatives:
Llama 4 Scout and Maverick - first open-weight natively multi-modal models
AI Studio that enables the creation of hundreds of thousands of AI characters
$65-72 billion projected AI infrastructure spending for 2025
This open-source strategy directly challenges the closed-source big players like GPT and Claude. By making AI models freely available, Meta is essentially commoditizing what competitors are trying to monetize. Meta's bet is that if AI models become commoditized, the real value will be in the infrastructure that sits on top. Meta's social platforms and massive user base give it a natural advantage if this eventuates.
Meta's recent quarter was also "the best example to date of AI having a tangible impact on revenue and earnings growth at scale," according to tech analyst Gene Munster.
H1 relative performance of the Magnificent Seven stocks. Source: KoyFin, Finimize
However, it hasn’t been all smooth sailing for Meta. Their most anticipated release, Llama Behemoth, has all but been scrapped due to performance issues. And Meta is now rumored to be developing a closed-source Behemoth alternative, despite their open-source mantra.
Amazon: The AI Agent Strategy
Amazon’s strategy is to build the infrastructure for AI that can take actions — booking meetings, processing orders, managing workflows, and integrating with enterprise systems.
Rather than building the best AI model, Amazon has focused its efforts on becoming the platform where all AI models live.
Key initiatives:
Amazon Bedrock offering 100+ foundation models from leading AI companies, including OpenAI models.
$100 million additional investment in AWS Generative AI Innovation Center for agentic AI development
Amazon Bedrock AgentCore enabling deployment and scaling of AI agents with enterprise-grade security
$118 billion projected AI infrastructure spending for 2025
The goal is to become the “orchestrator” that lets companies mix and match the best models for different tasks.
Amazon’s AgentCore will provide the underlying memory management, identity controls, and tool integration needed for these companies to deploy AI agents safely at scale.
This approach offers flexibility, but does carry some risks. Amazon is essentially positioning itself as the middleman for AI. If AI models become commoditized or if companies prefer direct relationships with AI providers, Amazon's systems could become redundant.
Nvidia: The Infra Strategy
Nvidia is the one selling the shovels for the AI gold rush. While others in the Mag Seven battle to build the best AI models and applications, Nvidia provides the fundamental computing infrastructure that makes all their efforts possible.
This hardware-first strategy means Nvidia wins regardless of which company ultimately dominates. As AI advances and models get larger, demand for Nvidia's chips only increases.
Key initiatives:
Blackwell architecture achieving $11 billion in Q2 2025 revenue, the fastest product ramp in company history
New chip roadmap: Blackwell Ultra (H2 2025), Vera Rubin (H2 2026), Rubin Ultra (H2 2027)
Data center revenue reaching $35.6 billion in Q2, representing 91% of total company sales
Manufacturing scale-up with 350 plants producing 1.5 million components for Blackwell chips
With an announced product roadmap of Blackwell Ultra (2025), Vera Rubin (2026), and Rubin Ultra (2027), Nvidia has created a system where the AI industry must continuously upgrade to Nvidia’s newest tech to stay competitive.
This also means that Nvidia, unlike the others in the Mag Seven, has almost no direct AI spending — it is the one selling, not buying.
However, Nvidia is not indestructible. The company recently halted its H20 chip production after the Chinese government effectively blocked the chip, which was intended as a workaround to U.S. export controls.
Apple: The On-Device Strategy
Apple's AI strategy is focused on privacy, integration, and user experience. Apple Intelligence, the AI system built into iOS, uses on-device processing and Private Cloud Compute to help ensure user data is protected when using AI.
Key initiatives:
Apple Intelligence with multi-model on-device processing and Private Cloud Compute
Enhanced Siri with natural language understanding and ChatGPT integration for complex queries
Direct developer access to on-device foundation models, enabling offline AI capabilities
$10-11 billion projected AI infrastructure spending for 2025
The drawback of this on-device approach is that it requires powerful hardware from the user's end. Apple Intelligence can only run on devices with a minimum of 8GB RAM, creating a powerful upgrade cycle for Apple but excluding many existing users.
Tesla: The Robo Strategy
Tesla's AI strategy focuses on two moonshot applications: Full Self-Driving vehicles and humanoid robots.
This is the 'AI in the physical world' play. While others in the Mag Seven are focused on the digital side of AI, Tesla is building machines that use AI for physical operations.
Tesla’s Optimus robot replicating human tasks
Key initiatives:
Plans for 5,000-10,000 Optimus robots in 2025, scaling to 50,000 in 2026
Robotaxi service targeting availability to half the U.S. population by EOY 2025
AI6 chip development with Samsung for unified training across vehicles, robots, and data centers
$5 billion projected AI infrastructure spending for 2025
This play is exponentially harder to develop than digital AI, and the markets have reflected low confidence that Tesla can pull it off.
TSLA has been the worst-performing Mag Seven stock of 2025, down 18.37% in H1 2025.
However, if Tesla’s strategy is successful, it could be far more valuable than other AI plays. Robots and autonomous vehicles could perform actual labour worth trillions of dollars annually.
The $385 billion Question
The Mag Seven are starting to see real revenue come in from their AI investments. But they're pouring that money (and more) back into AI, betting that the boom is just getting started.
The platform players like Microsoft and Amazon are betting on becoming essential infrastructure. Nvidia’s play is to sell the underlying hardware to everyone. Google and Meta compete on capability and access. While Apple and Tesla target specific use cases.
The $385 billion question is which of the Magnificent Seven has bet the right way? Or will a new player rise and usurp the long-standing tech giants altogether?
You can access all Magnificent Seven stocks and thousands of other Share CFDs on GO Markets.
Over the past 3 months Nvidia has moved through ranges that some stocks don’t do in years, in some cases decades. Having lost over 35 per cent in the June to August sell off, it quickly bounced over 40 per cent in the preceding 20 days once it hit its August low as we build positions ahead of its results. These results delivered Nvidia style numbers with three figure growth on the sales, net profit and earnings lines but this did not appease the market, seeing it fall 22 per cent in a little over 8 days.
Which brings us to now – a new 16 per cent drive as Nivida reports it’s struggling to meet demands and that the AI revolution is translating faster than even it expected. This got us thinking – Where are we right “Now” in the AU players? Thus, it’s time to dive into the drivers for the Nvidia and Co.
AI players. Supersonic As mentioned, Nvidia’s results have been astonishing – and it still has time to do a US$50 billion buyback. It collected the award for becoming the world’s largest company in the shortest timeframe in the post-WWII era, think about that for one second – that’s faster than Amazon, Microsoft, Apple, Google, Shell, BP, ExxonMobil, TV players of the 60s and 70s.
So the question is how does it keep its speed and trajectory? Well that comes from what some are calling the ‘supersonic’ scalers. These are the players like Google, Amazon, Meta and Microsoft that are the users and providers of the AI revolution.
These are the players that have spent hundreds billions thus far on the third digital revolution. Let us once again put that into perspective, the amount of spending is (inflation adjusted) the same as what was spent during the 1960’s on mainframe computing and the 1990’s distribution of fibre-optics. So we have now seen that level of spending in AI the next step is ‘usage’ and that is the inflection point we find ourselves at.
Currently AI is mainly used to train foundational models and chatbots – which is fine but not long-term financially stable. It needs to move into things like productions – that is producing models for corporate clients that forecast, streamline and increase productivity. This is the ‘Grail’ This immediately raises the bigger question for now – can this Grail be achieved?
The Voices To answer that – let us present some arguments from some of AI’s largest “Voices” On the AI potential and the possibility of a profound and rapid technological revolution, Sam Altman, CEO of OpenAI, has claimed that AI represents the "biggest, best, and most important of all technology revolutions," and predicts that AI will become increasingly integrated into all aspects of life. This reflects a belief in AI's far-reaching influence over time. The never subtle McKinsey and Co. has projected that generative AI could eventually contribute up to $8 trillion to the global economy annually.
This figure underscores the massive economic potential of AI. The huge caveat: McKinsey's predictions are never real-world tested and inevitably fall flat in the market. This kind of money is what makes AI so attractive to players in Venture Capital.
For the VC watchers out there the one that is catching everyone’s attention is VC accelerator Y Combinator which is fully embracing the technology. Just to put Y Combinator into context, according to Jared Heyman’s Rebel Fund, if anyone had invested in every Y Combinator deal since 2005 (which would have been impossible just to let you know), the average annual return would have been 176%, even after accounting for dilution. Furthermore to the VC story - AI has accounted for over 40 per cent of new unicorns (startups valued at $1 billion or more) in the first half of 2024, and 60 per cent of the increase in VC-backed valuations.
So far in 2024, U.S. unicorn valuations have grown by $162 billion, largely driven by AI’s rapid expansion, according to Pitchbook data. So the Voices certainly believe it can be achieved. But is this a good thing?
The Good, the Bad and the Ugly AI is advancing at such a rapid pace that existing performance benchmarks, such as reading comprehension, image classification and advanced maths, are becoming outdated, necessitating the creation of new standards. This reflects the fast-moving nature of AI progress. For example, look at the success of AlphaFold, an AI-driven algorithm that accurately predicts protein structures.
Some see this as one of the most important achievements in AI’s short history and underscores AI’s transformative impact on science, particularly in fields like biology and healthcare. This is the Good. Then there is the 165-page paper titled "Situational Awareness" by Aschenbrenner which has predicted that by 2030, AI will achieve superintelligence and create a $1 trillion industry.
Also, a positive, but will consume 20 per cent of the U.S. power supply. These incredible predictions emphasise the enormous scale of AI and the impact it will have on industry, infrastructure and people. The latest Google study found that generative AI could significantly improve workforce productivity.
The study suggests that roughly 80 per cent of jobs could see at least 10 per cent of tasks completed twice as fast due to AI, which has implications for industries such as call centres, coding, and professional writing. This highlights AI's capacity to streamline tasks and enhance efficiency across various fields. However it also raises the massive concern around job security, job satisfaction and the socio-economic divide as the majority of those affected by AI ‘productivity’ are in mid to low scales.
Then we come to Elon Musk’s new AI startup, xAI, which raised $6 billion at a valuation of $24 billion this year. The company is planning to build the world’s largest supercomputer in Tennessee to support AI training and inference. This all sounds economically and financially exciting but it has a darker side.
These are the kinds of AI ventures that have seen ‘deep-fake’ creations. For example Musk himself shared a deep-fake video of Vice President Kamala Harris. This is the ugly side of AI and reflects the broader cultural and ethical issues surrounding AI-generated content.
Furthermore – we should always be forecasting both the good and the bad for investment opportunities. These issues are already attracting regulations and compliance responses. How impactful will these be?
And will it halt the AI driven share price appreciation? It is a very real and present issue. Where does this leave us?
The share price future of Nvidia and Co is clearly dependent on the longer-term achievement of the AI revolution. As shown, the supersonic players in technology and venture capital are betting big on AI, with predictions that it will reshape the global economy, industries, and even basic societal structures. However, there is still uncertainty about the exact timeline for these changes and how accurately the market is pricing in AI's potential.
The AI ecosystem is moving at breakneck speed, with new developments outpacing benchmarks and productivity gains reshaping jobs, but whether all these projections that range from trillion-dollar economies to superintelligence materialises remains to be seen. Thus – for now – Nvidia and Co’s recent roller-coaster trading looks set to continue.
Pasar memasuki pekan yang dimulai 16 Februari dengan campuran besar data ekonomi dan momentum pendapatan yang berkelanjutan, yang akan memberi makan gambaran pertumbuhan yang lebih luas.
Flash PMI (Jumat)Survei bisnis AS, Zona Euro, Inggris dan Jepang memberikan pembacaan awal tentang momentum pertumbuhan Februari.
AI di luar teknologiKomentar semakin berfokus pada bagaimana AI dapat memengaruhi model bisnis di seluruh industri, meskipun pergerakan sektor dapat mencerminkan banyak pendorong.
Rotasi ekuitas: Kinerja teknologi baru-baru ini beragam, dan partisipasi yang lebih luas terlihat kurang konsisten daripada rotasi yang dikonfirmasi.
PenghasilanDengan sebagian besar mega cap AS yang dilaporkan, nama ritel dan konsumen menjadi fokus minggu ini, dan musim pelaporan Australia tetap sibuk.
Bitcoin (BTC): Ditarik kembali setelah upaya rebound dan tetap sangat sensitif terhadap perubahan sentimen.
Flash PMI
Pembacaan PMI kilat Jumat di seluruh ekonomi utama dapat memberikan pembacaan tepat waktu tentang kondisi bisnis dan tren permintaan.
Jika jasa tetap tangguh sementara manufaktur tetap lunak, pasar dapat menafsirkan ini sebagai pertumbuhan yang stabil tetapi tidak merata. Jika keduanya melemah, kekhawatiran pertumbuhan bisa kembali lebih cepat.
Awal pekan ini, PDB Jepang, data tenaga kerja Inggris, CPI Inggris, ketenagakerjaan Australia, dan data perdagangan AS membantu mengatur nada sebelum rilis flash PMI Jumat dari berbagai negara.
Tanggal utama
Flash PMI (AS, Zona Euro dan Inggris): Jumat, 20 Februari
Memantau
Volatilitas mata uang di sekitar rilis PMI.
Reaksi imbal hasil obligasi terhadap kejutan atau kekecewaan pertumbuhan.
Pergeseran kinerja sektor dan komoditas yang mungkin terkait dengan perubahan ekspektasi permintaan.
Gangguan AI
Beberapa komentar pasar telah menyoroti potensi implikasi kompetitif jangka panjang AI di berbagai industri, meskipun kinerja perusahaan dan sektor masih dapat didorong oleh kondisi makro, suku bunga, dan ekspektasi pendapatan.
KeuanganBeberapa diskusi berfokus pada apakah alat AI dapat mengubah bagian dari manajemen kekayaan dan pemberian saran dari waktu ke waktu, meskipun pergerakan harga saham dapat mencerminkan banyak pengaruh.
Logistik dan pengirimanBeberapa diskusi pasar berpusat pada apakah otomatisasi yang lebih besar dapat mempengaruhi biaya dan dinamika harga dari waktu ke waktu, bersama dengan pendorong siklus lainnya.
Perangkat lunakReaksi tetap beragam, dengan beberapa perusahaan mendapat manfaat dari integrasi AI sementara yang lain menghadapi pertanyaan tentang diferensiasi dan kekuatan penetapan harga.
Pergeseran ini berarti tema AI semakin dapat mengekspresikan dirinya melalui kinerja dan dispersi relatif, daripada tawaran “risiko” yang luas.
Memantau
Panduan pendapatan yang mereferensikan otomatisasi, investasi AI, atau tekanan kompetitif terkait AI.
Peningkatan dispersi antar sektor dan di dalam sektor.
Reaksi yang lebih besar terhadap komentar berwawasan ke depan daripada ketukan atau ketinggalan judul.
Rotasi ekuitas
Rebound dalam saham teknologi yang terlihat awal pekan lalu telah kehilangan momentum. Daripada kondisi risiko-off yang jelas, pasar menunjukkan partisipasi yang beragam.
Sektor keuangan, industri, dan defensif terkadang menarik arus, tetapi tidak cukup konsisten untuk mengkonfirmasi rotasi yang tahan lama.
Partisipasi tetap tidak merata, dan bukti pola arus uang yang lebih konsisten masih terbatas pada tahap ini.
Memantau
Kekuatan relatif berkelanjutan di sektor non-teknologi.
Pergerakan imbal hasil dan pengaruhnya terhadap ekuitas yang peka terhadap pertumbuhan
Partisipasi sektor yang lebih luas versus kepemimpinan teknologi yang sempit
Grafik 1 hari NASDAQ | TradingView
Fokus pendapatan
Sebagai Musim pendapatan AS bergerak menuju backend-nya, perhatian beralih ke nama ritel minggu ini.
Hasil ritel dapat memberikan sinyal tentang kekuatan konsumen, tren belanja diskresioner dan ketahanan margin, terutama di tengah persepsi yang beragam tentang keadaan ekonomi.
Di Australia, musim pelaporan berlanjut, mendukung volatilitas spesifik saham di seluruh ASX.
Memantau
Komentar margin ritel dan tren diskon
Pernyataan prospek permintaan konsumen dan nada panduan
Saham tunggal besar bergerak bahkan ketika arah indeks dibisukan
Bitcoin sensitif terhadap sentimen
Bitcoin telah diperdagangkan lebih rendah selama sesi terakhir dan tetap sangat fluktuatif. Pergerakan kembali ke level terendah 5 Februari dimungkinkan, tetapi harga dapat berubah dengan cepat di kedua arah.
Beberapa pelaku pasar memandang Bitcoin sebagai salah satu indikator sentimen spekulatif, meskipun pembacaan “selera risiko” yang lebih luas tidak pasti dan dapat dipengaruhi oleh beberapa pendorong di seluruh pasar kripto.
Peristiwa global besar seperti Olimpiade dapat menarik perhatian dari pasar, mengalihkan partisipasi, dan menipiskan volume di kantong.
Ketika itu terjadi, likuiditas dapat tampak lebih ringan, spread bisa kurang konsisten, dan aksi harga jangka pendek bisa menjadi lebih berisik, bahkan jika volatilitas tingkat indeks yang lebih luas tidak berubah secara material.
Jadi alih-alih bertanya “Apakah Olimpiade menciptakan volatilitas?” , lensa yang lebih praktis adalah bertanya “Apa peristiwa volatilitas dapat muncul selama Olimpiade?”
Fakta singkat
Bukti umumnya lemah bahwa Olimpiade sendiri adalah pendorong langsung volatilitas pasar yang konsisten.
Lonjakan volatilitas yang terjadi selama jendela Olimpiade sering bertepatan dengan yang lebih besar kekuatan yang sudah bergerak, termasuk stres makro, kejutan kebijakan, dan geopolitik.
Dampak terkait Olimpiade yang lebih berulang cenderung berada di sekitar kondisi eksekusi, bukan rezim pasar fundamental baru.
“Bingo volatilitas” Olimpiade, cara kerjanya
Anggap saja sebagai daftar pemicu volatilitas umum yang dapat mendarat saat dunia menonton.
Beberapa kotak “bingo volatilitas” tidak lekang oleh waktu, seperti bank sentral dan geopolitik. Lainnya lebih modern, seperti risiko gangguan dunia maya, aktivisme iklim, dan titik panas sosial di sekitar logistik kota tuan rumah.
Ketika ekspektasi kebijakan bergeser, pasar dapat bergerak terlepas dari kalender.
London 2012 adalah pengingat bahwa cerita itu bukan olahraga. Itu adalah zona euro. Pada akhir Juli 2012, Presiden ECB Mario Draghi menyampaikan pernyataan “apapun yang diperlukan” di London, pada saat tekanan kedaulatan adalah tema volatilitas yang dominan.
Stres makro sudah berlangsung
Beijing 2008 terjadi pada tahun yang ditentukan oleh krisis keuangan global, dengan volatilitas terkait dengan tekanan kredit dan repricing selera risiko, bukan dengan peristiwa itu sendiri. Olimpiade berlangsung dari 8 Agustus 2008 hingga 24 Agustus 2008.
S&P500 turun hampir 50% selama 6 bulan di tahun 2008 | TradingView
Geopolitik dan keamanan
Waktu konflik regional
Selama Beijing 2008, konflik Rusia-Georgia meningkat pada awal Agustus 2008, tumpang tindih dengan periode Olimpiade. Pelajaran pasar adalah bahwa penetapan harga geopolitik tidak berhenti untuk siaran besar.
Risiko “Setelah upacara penutupan”
Beijing 2022 berakhir pada 20 Februari 2022. Invasi skala penuh Rusia ke Ukraina dimulai pada 24 Februari 2022, hanya beberapa hari kemudian.
Ini adalah “kotak bingo” klasik karena memperkuat prinsip yang sama. Eskalasi geopolitik dapat mendarat di dekat jendela peristiwa global tanpa harus disebabkan olehnya.
Kejutan utama insiden keamanan
Olimpiade juga telah terkena dampak langsung oleh peristiwa keamanan, bahkan jika peristiwa itu bukan “pendorong pasar” sendiri.
Dua contoh bersejarah yang membentuk latar belakang keamanan yang lebih luas di sekitar peristiwa besar adalah:
Pembantaian Munich selama Olimpiade Musim Panas 1972.
Pengeboman Olimpiade Atlanta 1996 di Centennial Olympic Park.
Langkah-langkah keamanan untuk Paris 2024 termasuk kamera bertenaga AI | Adobe Stock
Iklim kota tuan rumah modern
Protes lingkungan dan anti-Olimpiade
Aktivisme kota tuan rumah bukanlah hal baru, tetapi temanya telah menjadi lebih fokus pada iklim dan infrastruktur.
Paris 2024 menyaksikan protes terorganisir dan acara “pembukaan balik”. Laporan di sekitar Paris juga merujuk upaya protes lingkungan oleh kelompok-kelompok iklim.
Saat ini Olimpiade Musim Dingin 2026 dibuka di tengah protes anti-Olimpiade di Milan, dengan laporan yang mencakup dugaan sabotase kereta api dan demonstrasi yang sebagian difokuskan pada dampak lingkungan dari infrastruktur Olimpiade.
Jenis berita utama ini dapat menjadi penting bagi pasar secara tidak langsung, melalui sentimen risiko, gangguan transportasi, respons kebijakan, dan pembingkaian “ketidakstabilan” yang lebih luas.
Risiko gangguan cyber
“Bingo Square” cyber telah menjadi lebih menonjol dalam Game modern.
Badan keamanan siber nasional Prancis ANSSI melaporkan 548 peristiwa keamanan siber yang mempengaruhi entitas terkait Olimpiade yang dilaporkan ke ANSSI antara 8 Mei 2024 dan 8 September 2024.
Bahkan ketika peristiwa dibatasi, insiden cyber masih dapat menambah kebisingan pada berita utama dan kepercayaan diri.
Logistik dan kontroversi “dapatkah acara berjalan”
Terkadang tautan volatilitas bukanlah Game, tetapi kontroversi seputar pengiriman.
Paris 2024 memiliki pengawasan profil tinggi di sekitar Sungai Seine dan kesiapan acara, di samping pengeluaran publik yang signifikan untuk membersihkan sungai dan perdebatan yang sedang berlangsung tentang risiko kualitas air.
Narasi kesehatan dan gangguan
Masalah kesehatan masyarakat
Rio 2016 adalah pengingat bahwa narasi risiko kesehatan dapat menjadi bagian dari latar belakang Olimpiade, bahkan ketika dampak pasar tidak langsung.
Kekhawatiran Zika dibahas secara luas menjelang Olimpiade, termasuk perdebatan tentang risiko penularan global dan penyebaran terkait perjalanan.
Memori “era penundaan”
Tokyo 2020 ditunda hingga 2021 karena COVID-19, yang menggarisbawahi bahwa peristiwa kejutan global dapat mendominasi yang lainnya, termasuk kalender olahraga utama.
Olimpiade “COVID” Tokyo 2020 | Adobe Stock
Takeaways praktis untuk pedagang
Pergeseran era Olimpiade yang paling berulang seringkali bukan “lebih banyak volatilitas”, tetapi kondisi eksekusi yang berbeda.
Selama peristiwa global besar, beberapa pedagang memilih untuk mengamati spread dan kedalaman untuk tanda-tanda likuiditas menipis, berdagang lebih sedikit ketika kondisi terlihat berombak, dan tetap sadar bahwa berita utama geopolitik, cyber, dan protes dapat muncul kapan saja.
Di pasar global skala besar, olahraga biasanya bukan katalisator. Kotak bingo adalah.
Olimpiade dan Olimpiade Musim Dingin menarik perhatian global selama berminggu-minggu, menarik jutaan pemirsa dan mendominasi berita utama. Bagi para pedagang, perhatian ini sering terasa seperti katalis, namun pendorong pasar sebenarnya tetap sama: ekonomi makro, kebijakan, dan sentimen risiko global, bukan kalender olahraga.
Jadi mengapa beberapa pedagang mengatakan hasil terasa lebih lemah selama acara olahraga besar?
Seringkali terjadi kegagalan untuk beradaptasi dengan kondisi yang dapat bergeser pada margin, terutama likuiditas dan partisipasi.
1. Mengharapkan “volatilitas peristiwa”
Peristiwa global besar dapat menciptakan asumsi bahwa pasar seharusnya bergerak lebih banyak. Beberapa pedagang memposisikan posisi untuk breakout atau meningkatkan risiko untuk mengantisipasi perubahan yang lebih besar, bahkan ketika kondisi tidak mendukungnya.
Driver kunci
Di beberapa pasar dan sesi, penurunan partisipasi dapat melemahkan tindak lanjut tren
Sentimen dapat meningkatkan ekspektasi di luar apa yang diberikan aksi harga
Contoh: Seorang pedagang mengharapkan breakout selama periode upacara pembukaan Olimpiade, tetapi partisipasi regional yang rendah membatasi pergerakan harga, yang mengarah ke start yang salah.
2. Memaksa perdagangan dalam sesi tenang
Ketika aksi harga lebih lambat dan rentang terkompresi, beberapa pedagang merasakan tekanan untuk tetap aktif dan mengambil entri berkualitas rendah.
Driver kunci
Rentang intraday yang sempit dapat meningkatkan sinyal palsu
Keyakinan yang lebih rendah dapat mendukung konsolidasi daripada tren, meningkatkan risiko false-break
“Tetap terlibat” dapat mengurangi selektivitas
Takeaway: Gunakan sesi yang lebih tenang untuk menyempurnakan pengaturan atau meninjau data daripada memaksa perdagangan marjinal.
3. Mengabaikan likuiditas lebih tipis
Partisipasi dapat sedikit mereda selama acara global besar, dan dampaknya sering lebih jelas pada jangka waktu yang lebih pendek. Grafik harian mungkin terlihat normal, sementara aksi harga intraday menjadi lebih mudah dengan lebih banyak sumbu.
Driver kunci
Dalam kondisi kedalaman yang lebih rendah, harga dapat melonjak lebih mudah, dan ukuran sumbu dapat meningkat
Dalam beberapa instrumen dan sesi, likuiditas yang lebih tipis dapat bertepatan dengan spread yang lebih luas dan eksekusi yang lebih bervariasi (bervariasi menurut pasar, tempat, dan kondisi broker)
Sensitivitas jangka waktu terhadap kondisi yang lebih tipis
Tabel di atas hanya ilustratif (bervariasi menurut pasar): Grafik harian mungkin terlihat normal. Grafik lima menit bisa terasa lebih tidak menentu.
Contoh sumbu besar volume rendah
Sumber: MT5
4. Menggunakan ukuran normal dalam kondisi abnormal
Bahkan jika volatilitas keseluruhan terlihat stabil, risiko eksekusi dapat meningkat ketika likuiditas menipis, terutama untuk pendekatan jangka pendek atau gaya scalping.
Driver kunci
Selip dapat meningkat, dan berhenti mungkin “melebihi”
Kondisi tipis dapat memicu berhenti lebih mudah dalam kebisingan
Spread yang lebih luas dapat mengubah hasil masuk/keluar dibandingkan kondisi normal
Penyesuaian: Mempertahankan ukuran tetap dapat mendistorsi efektif risiko. Beberapa trader meninjau biaya transaksi, termasuk spread, dan kondisi eksekusi saat menetapkan parameter risiko seperti stops/limit, terutama dalam sesi yang lebih tipis.
5. Terobosan perdagangan dengan tindak lanjut rendah
Taktik mengikuti tren dapat goyah ketika partisipasi menurun. Momentum dapat menghilang dengan cepat, dan jeda palsu menjadi lebih umum.
Driver kunci
Aliran yang berkurang dapat membatasi gerakan terarah yang berkelanjutan
Beberapa rezim likuiditas rendah mungkin mendukung reversi berarti daripada momentum
Contoh: Terobosan rentang klasik tampak valid intraday tetapi memudar dengan cepat karena volume tindak lanjut gagal terwujud.
Contoh breakout yang gagal
Sumber: MT5
6. Mengabaikan waktu dan risiko gangguan
Tidak ada bukti yang dapat diandalkan bahwa kalender Olimpiade dapat diprediksi mendorong peristiwa geopolitik. Tetapi ketika ketegangan sudah meningkat, peristiwa global besar kadang-kadang dapat bertepatan dengan perhatian yang tersebar di tempat lain, agak mirip dengan hari libur, pemilihan umum atau KTT besar.
Pedagang harus mengidentifikasi kapan kondisinya lebih lambat atau lebih tipis dan menyesuaikannya, menyelaraskan taktik dengan risiko tindak lanjut yang berkurang dan mengkalibrasi ukuran posisi dengan realitas eksekusi. Yang terpenting, hindari memaksa perdagangan ketika tepi terbatas selama periode ini.