A trading edge is a certain approach or special system techniques that, in theory, gives a trader some type of advantage over other market participants, hence making a trader more likely to achieve positive trading results. Many are cynical about the objective of creating a trading edge, despite the plethora of articles and books on various trading techniques. According to them because many traders may learn and apply this same information, the chances of it providing an edge for any individual trader are limited at best, if not non-existent.
Although logically, on the surface, this may seem like a reasonable critique, in much the same way as searching for the “holy grail’, this statement is more than questionable for reasons: a. The assumptions underpinning this thinking are essentially flawed. b. There are traders (although perhaps in the minority) who create positive trading outcomes on a consistent, sustainable basis.
This is indicative of the definition of a trading “edge”. Let’s look at these in more detail. Challenging flawed assumptions Although it is correct that many trading techniques are written about and taught, in reality why most of these do not work are either because: a.
System issues – Most people fail to develop a comprehensive, sufficiently specific system that facilitate consistency in action when entering or more commonly exiting a trade. If this is crucial in order to implement any technique, then it is the absence of this rather than the technique that is a major impacting factor. b. Behavioural issues – Even with the above in place, it is commonly recognised that many traders fail to follow through on such systems.
We have written about this in other articles extensively and it likely most traders have discipline issue when trading in the “heat of the action”. Again, a failure to execute is a major contributing factor rather than any technique. c. A failure to measure and adapt a system as an individual trader – Again this is a common theme in the articles we publish.
Any business, including your “trading business” is best served through formal measurement (e.g., in a journal as well as the “accountancy” information). It is only through this that we can identify: i. How well or otherwise you are following your system ii.
Whether some components of your system would benefit from some amendment to better suit you as an individual trader. So, if most traders suffer from any or all of the above, then the assumptions that all traders have a robust system that as required for an edge is essentially incorrect. And successful traders?
We have suggested previously that in any field, those who succeed do the things that most people do not like/fail to do. The three issues covered in the previous section are more commonly NOT embraced and adhered to by most traders, and it appears as though these are common characteristics by those consistently successful traders that we aspire to be. The reasons for traders not to embrace these are many, but it boils down to a basics e.g., required education or failure to take trading seriously enough, or invest the effort to do the “hard yards” (it is human nature to look for short cuts).
Arguably therefore, even without looking a special trading technique “a” versus technique “b”, if accepting that the three components discussed above are beneficial, is part of what can make a successful trader. Actioning ALL of these is what most traders don’t do and making these happen could give you an advantage over other market participants - this is your possible trading edge. And finally The result of actioning the above in total, and with reference to the third component of trading measurement is you will be able to begin to objectively compare system versus system.
It is quite simple. In summary, Is it possible to create a “trading edge” and give you a potential advantage over other market participants? Well the very fact that most traders don’t do what they need to, as we have discussed above, could theoretically give you that “edge”.
This is your starting point and then take it to the next system versus system testing level.
By
Mike Smith
Mike Smith (MSc, PGdipEd)
Client Education and Training
The information provided is of general nature only and does not take into account your personal objectives, financial situations or needs. Before acting on any information provided, you should consider whether the information is suitable for you and your personal circumstances and if necessary, seek appropriate professional advice. All opinions, conclusions, forecasts or recommendations are reasonably held at the time of compilation but are subject to change without notice. Past performance is not an indication of future performance. Go Markets Pty Ltd, ABN 85 081 864 039, AFSL 254963 is a CFD issuer, and trading carries significant risks and is not suitable for everyone. You do not own or have any interest in the rights to the underlying assets. You should consider the appropriateness by reviewing our TMD, FSG, PDS and other CFD legal documents to ensure you understand the risks before you invest in CFDs. These documents are available here.
免责声明:文章来自 GO Markets 分析师和参与者,基于他们的独立分析或个人经验。表达的观点、意见或交易风格仅代表作者个人,不代表 GO Markets 立场。建议,(如有),具有“普遍”性,并非基于您的个人目标、财务状况或需求。在根据建议采取行动之前,请考虑该建议(如有)对您的目标、财务状况和需求的适用程度。如果建议与购买特定金融产品有关,您应该在做出任何决定之前了解并考虑该产品的产品披露声明 (PDS) 和金融服务指南 (FSG)。
Every trader has had that moment where a seemingly perfect trade goes astray.
You see a clean chart on the screen, showing a textbook candle pattern; it seems as though the market planets have aligned, and so you enthusiastically jump into your trade.
But before you even have time to indulge in a little self-praise at a job well done, the market does the opposite of what you expected, and your stop loss is triggered.
This common scenario, which we have all unfortunately experienced, raises the question: What separates these “almost” trades from the truly higher-probability setups?
The State of Alignment
A high-probability setup isn’t necessarily a single signal or chart pattern. It is the coming together of several factors in a way that can potentially increase the likelihood of a successful trade.
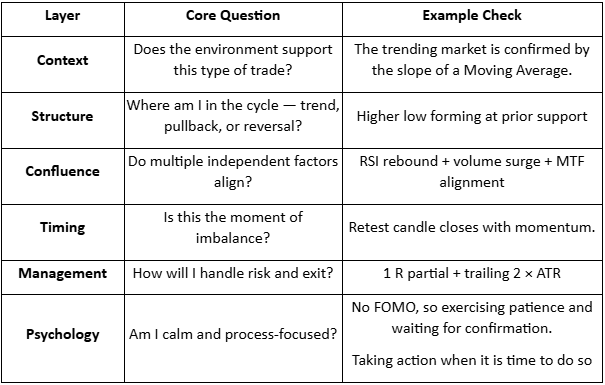
When combined, six interconnected layers can come together to form the full “anatomy” of a higher-probability trading setup:
Context
Structure
Confluence
Timing
Management
Psychology
When more of these factors are in place, the greater the (potential) probability your trade will behave as expected.
Market Context
When we explore market context, we are looking at the underlying background conditions that may help some trading ideas thrive, and contribute to others failing.
Regime Awareness
Every trading strategy you choose to create has a natural set of market circumstances that could be an optimum trading environment for that particular trading approach.
For example:
Trending regimes may favour momentum or breakout setups.
Ranging regimes may suit mean-reversion or bounce systems.
High-volatility regimes create opportunity but demand wider stops and quicker management.
Investing time considering the underlying market regime may help avoid the temptation to force a trending system into a sideways market.
Simply looking at the slope of a 50-period moving average or the width of a Bollinger Band can suggest what type of market is currently in play.
Sentiment Alignment
If risk sentiment shifts towards a specific (or a group) of related assets, the technical picture is more likely to change to match that.
For example, if the USD index is broadly strengthening as an underlying move, then looking for long trades in EURUSD setups may end up fighting headwinds.
Setting yourself some simple rules can help, as trading against a potential tidal wave of opposite price change in a related asset is not usually a strong foundation on which to base a trading decision.
Key Reference Zones
Context also means the location of the current price relative to levels or previous landmarks.
Some examples include:
Weekly highs/lows
Prior session ranges, e.g. the Asian high and low as we move into the European session
Major “round” psychological numbers (e.g., 1.10, 1000)
A long trading setup into these areas of market importance may result in an overhead resistance, or a short trade into a potential area of support may reduce the probability of a continuation of that price move before the trade even starts.
Market Structure
Structure is the visual rhythm of price that you may see on the chart. It involves the sequences of trader impulses and corrections that end up defining the overall direction and the likelihood of continuation:
Uptrend: Higher highs (HH) and higher lows (HL)
Downtrend: Lower highs (LH) and lower lows (LL)
Transition: Break in structure often followed by a retest of previous levels.
A pullback in an uptrend followed by renewed buying pressure over a previous price swing high point may well constitute a higher-probability buy than a random candle pattern in the middle of nowhere.
Compression and Expansion
Markets move through cycles of energy build-up and release. It is a reflection of the repositioning of asset holdings, subtle institutional accumulation, or a response to new information, and may all result in different, albeit temporary, broad price scenarios.
Compression: Evidenced by a tightening range, declining ATR, smaller candles, and so suggesting a period of indecision or exhaustion of a previous price move,
Expansion: Evidenced by a sudden breakout, larger candle bodies, and a volume spike, is suggestive of a move that is now underway.
A breakout that clears a liquidity zone often runs further, as ‘trapped’ traders may further fuel the move as they scramble to reposition.
A setup aligned with such liquidity flows may carry a higher probability than one trading directly into it.
Confluence
Confluence is the art of layering independent evidence to create a whole story. Think of it as a type of “market forensics” — each piece of confirmation evidence may offer a “better hand’ or further positive alignment for your idea.
There are three noteworthy types of confluence:
Technical Confluence – Multiple technical tools agree with your trading idea:
Moving average alignment (e.g., 20 EMA above 50 EMA) for a long trade
A Fibonacci retracement level is lining up with a previously identified support level.
Momentum is increasing on indicators such as the MACD.
Multi-Timeframe Confluence – Where a lower timeframe setup is consistent with a higher timeframe trend. If you have alignment of breakout evidence across multiple timeframes, any move will often be strengthened by different traders trading on different timeframes, all jumping into new trades together.
3. Volume Confluence – Any directional move, if supported by increasing volume, suggests higher levels of market participation. Whereas falling volume may be indicative of a lesser market enthusiasm for a particular price move.
Confluence is not about clutter on your chart. Adding indicators, e.g., three oscillators showing the same thing, may make your chart look like a work of art, but it offers little to your trading decision-making and may dilute action clarity.
Think of it this way: Confluence comes from having different dimensions of evidence and seeing them align. Price, time, momentum, and participation (which is evidenced by volume) can all contribute.
Timing & Execution
An alignment in context and structure can still fail to produce a desired outcome if your timing is not as it should be. Execution is where higher probability traders may separate themselves from hopeful ones.
Entry Timing
Confirmation: Wait for the candle to close beyond the structure or level. Avoid the temptation to try to jump in early on a premature breakout wick before the candle is mature.
Retests: If the price has retested and respected a breakout level, it may filter out some false breaks that we will often see.
Then act: Be patient for the setup to complete. Talking yourself out of a trade for the sake of just one more candle” confirmation may, over time, erode potential as you are repeatedly late into trades.
Session & Liquidity Windows
Markets breathe differently throughout the day as one session rolls into another. Each session's characteristics may suit different strategies.
For example:
London Open: Often has a volatility surge; Range breaks may work well.
New York Overlap: Often, we will see some continuation or reversal of morning trends.
Asian Session: A quieter session where mean-reversion or range trading approaches may do well
Trade Management
Managing the position well after entry can turn probability into realised profit, or if mismanaged, can result in losses compounding or giving back unrealised profit to the market.
Pre-defined Invalidation
Asking yourself before entry: “What would the market have to do to prove me wrong?” could be an approach worth trying.
This facilitates stops to be placed logically rather than emotionally. If a trade idea moves against your original thinking, based on a change to a state of unalignment, then considering exit would seem logical.
Scaling & Partial Exits
High-probability trade entries will still benefit from dynamic exit approaches that may involve partial position closes and adaptive trailing of your initial stop.
Trader Psychology
One of the most important and overlooked components of a higher-probability setup is you.
It is you who makes the choices to adopt these practices, and you who must battle the common trading “demons” of fear, impatience, and distorted expectation.
Let's be real, higher-probability trades are less common than many may lead you to believe.
Many traders destroy their potential to develop any trading edge by taking frequent low-probability setups out of a desire to be “in the market.”
It can take strength to be inactive for periods of time and exercise that patience for every box to be ticked in your plan before acting.
Measure “You” performance
Each trade you take becomes data and can provide invaluable feedback. You can only make a judgment of a planned strategy if you have followed it to the letter.
Discipline in execution can be your greatest ally or enemy in determining whether you ultimately achieve positive trading outcomes.
Bringing It All Together – The Setup Blueprint
Final Thoughts
Higher-probability setups are not found but are constructed methodically.
A trader who understands the “higher-probability anatomy” is less likely to chase trades or feel the need to always be in the market. They will see merit in ticking all the right boxes and then taking decisive action when it is time to do so.
It is now up to you to review what you have in place now, identify gaps that may exist, and commit to taking action!
One of the most impactful books I’ve ever read is “The 7 Habits of Highly Effective People: Powerful Lessons in Personal Change” by Stephen Covey.
When it was first published in 1989, it quickly became one of the most influential works in business and personal development literature, and retained its place on bestseller lists for the next couple of decades.
The compelling, comprehensive, and structured framework for personal growth presented in the book has undoubtedly inspired many to rethink how they organise their lives and priorities, both professionally and personally.
Although its lessons were originally designed for self-improvement and positive structured growth, the underlying principles are universal, making them easily transferable to many areas of life, including trading.
In this article, you will explore how each of Covey’s seven original habits can be reframed within a trading context, in an attempt to offer a structure that may help guide you to becoming the best trader you can be.
1. Be Proactive
Being proactive means recognising that we have the power to choose our responses and to shape outcomes through appropriate preparation with subsequent planned reactions.
In a Trading Context:
For traders, this means anticipating potential problems before they arise and putting measures in place to better mitigate risk.
Rather than waiting for issues to unfold, the proactive trader identifies potential areas of concern and ensures that they have access to the right tools, resources, and people to prepare effectively, whatever the market may throw at them.
What This Means for You:
Being proactive may involve seeking out quality education and services, maintaining access to accurate and timely market information, continually assessing risk and opportunity, and having systems to manage those risks within defined limits.
Consequences of Non-Action:
Inadequate preparation and a lack of defined systems often lead to poor trading decisions and less-than-desired outcomes.
Failing to assess risk properly can result in significant and often avoidable losses.
By contrast, a proactive approach builds resilience and confidence, ensuring that when challenges arise, your response is measured and less emotionally driven by what is happening on the screen in front of you.
2. Begin with the End in Mind
Covey's second habit is about defining purpose. It suggests that effective people are more likely to achieve what is possible if they start with a clear understanding of their destination, so every action aligns with that ultimate vision.
In a Trading Context:
Ask yourself: What is my true purpose for trading?
Many traders may instinctively answer “to make money,” but money is surely only a vehicle to achieve something else in your world for you and those you care about, not a purpose per se.
You need to clarify what trading success really means for you.
Is it a greater degree of financial independence through increased income or capital growth, the freedom of having more time, achieving a personal challenge of becoming an effective trader, or a combination of any of these?
What This Means to You:
Try framing your purpose as, “I must become a better trader so that I can…” and complete a list with your genuine reasons for tackling the market and its challenges.
This helps you establish meaningful short-term development goals that keep you moving toward your vision. Keep that purpose visible, as a note near your trading screen that reminds you why you are doing this.
Consequences of Non-Action:
Traders with a clearly defined purpose are more likely to stay disciplined and consistent.
Those without one often drift, chasing short-term gains without direction. There is ample evidence that formalising your development in whatever context through goal setting can significantly increase the likelihood of success. Why would trading be any different?
Surely the bottom-line question to ask yourself is, “Am I willing to risk my potential by trading without purpose?”
3. Put First Things First
This habit is about time management and prioritisation. This involves focusing your efforts and energy on what truly matters. As part of the exploration of this concept, Covey emphasised distinguishing between what is important and what is merely urgent.
In a Trading Context:
Trading demands commitment, learning, and reflection.
It is not just about screen time but about using that time effectively.
Managing activities to ensure your effort is spent wisely on planning, measuring, journaling and performance evaluation, and refining systems, accordingly, are all critical to sustaining both improvements in results and balance.
What This Means to You:
Traders often believe they need to spend more time trading when what they really need is to focus on better time allocation.
It is logical to suggest that prioritising activities that can often contribute directly to improvement, such as system testing, reviewing performance, analysing results, and refining your strategy, is worthwhile.
These high-value tasks can help traders focus their time more deliberately and systematically.
Consequences of Non-Action:
If you fail to control your trading time effectively, you will be more likely to spend much of it on low-impact activities that produce little progress.
Over time, this not only hurts your results but also reduces the real “hourly value” of your trading effort.
In business terms, and of course, you should be treating your trading as you would any business activity; poor prioritisation can inflate your costs and diminish your potential trading outcomes.
4. Think Win: Win
Covey's fourth habit encouraged an attitude of mutual benefit, where seeking solutions that facilitate positive outcomes for all parties.
In a Trading Context:
In trading, this concept must be adapted to suggest that developing a mindset that recognises every well-executed plan as a win, even when an individual trade results in a loss.
Some trading ideas will simply not work out, and so some losses are inevitable, but if they remain within defined limits, they should not be viewed as failures but rather as a successful adherence to a trading plan. In the aim of developing consistency in action, and the widely held belief that this is one of the cornerstones of effective trading, then it surely is a win to fulfil this.
So, in simple terms, the real “win” lies in a combination of maintaining discipline, following your system, and controlling risk beyond just looking at the P/L of a single trade.
What This Means to You:
Building and trading clear, unambiguous systems that you follow consistently has got to be the goal.
This process produces reliable data that you can later analyse and subsequently use to refine specific strategies and personal performance.
When you do this, every outcome, whether profit or loss, can serve as valuable feedback.
For example, a controlled loss that fits your plan is proof that your system works and that you are protecting your capital.
Alternatively, a trailing stop strategy, which means you exit trades in a timely way and give less profit back to the market, provides positive feedback that your system has merit in achieving outcomes.
Consequences of Non-Action:
Without this mindset shift, traders can become emotionally reactive, interpreting normal drawdowns as personal defeats.
This fosters loss aversion and other biases that can erode decision-making quality if left unchecked. Through the process of redefining “winning,” you are potentially safeguarding both your capital and, importantly, your trading confidence (a key component of trading discipline).
5. Seek First to Understand and Then Take Action
Covey's fifth habit emphasises empathy, the act of listening and aiming to fully understand before responding. In trading, this principle translates to understanding the market environment before taking any action.
In a Trading Context:
Many traders act impulsively, driven by excitement or fear, which often results in entering trades without taking into account the full context of what is happening in the market, and/or the potential short-term influences on sentiment that may increase risk.
This “minimalisation bias,” defined as acting on limited information, will rarely produce consistent results. Instead, adopt a process that begins with observation and comprehension.
What This Means to You:
Establishing a daily pre-trading routine is critical. This may include a review of key markets, sentiment indicators, and potential catalysts for change, such as imminent key data releases. Understanding what the market is telling you before you decide what to do is the aim of having this sort of daily agenda.
This approach may not only improve trade selection but also enable you to get into a state of psychological readiness that can facilitate decision-making quality throughout the session.
Consequences of Non-Action:
Failing to prepare for the trading day ahead can mean not only exposing yourself to unnecessary risk but also arguably being more likely to miss potential opportunities.
A trader who acts without understanding is vulnerable both psychologically and financially. Conversely, being forewarned is being forearmed. When you aim to understand markets first before any type of trading activity, your actions are more likely to be deliberate, grounded, and more effective.
6. Synergise
Synergy in Covey's model means valuing differences and combining the strengths of those around you to create outcomes greater than the sum of their parts.
In a Trading Context:
In trading, synergy refers to the integration of multiple systems and disciplines that work together. This includes your plan, your record keeping and performance management processes, your time management, and your emotional balance.
No single system is enough; success comes from the synergy of elements that support and inform one another.
What This Means to You:
Integrating learning and measurement is an integral part of your trading development process. Journaling, for example, allows you to assess not only your technical performance but also your behavioural consistency.
This self-awareness allows you to refine your plan and so helps you operate with greater confidence.
The synergy between rational analysis and emotional composure is what is more likely to lead to consistently sound trading decisions.
Consequences of Non-Action:
When logic and emotion are out of balance, decision-making will inevitably suffer.
If your systems are incomplete, ambiguous, or poorly connected to the reality of your current level of understanding, competence and confidence, your results are likely to be inconsistent. Building synergy across all areas of your trading practice, including that of evaluation and development in critical trading areas, will help create cohesion, efficiency, and better performance.
7. Sharpen the Saw
Covey's final habit focuses on continuous learning and refinement, including maintaining and improving the tools at your disposal and skills and knowledge that allow you to perform effectively.
In a Trading Context:
In trading, this translates to creating a plan to achieve ongoing, purposeful learning.
Even small insights can make a large difference in results. Effective traders continually refine their knowledge, ask new questions, and apply lessons from experience.
What This Means to You:
Trading learning can, of course, take many forms. Discovering new indicators that may offer some confluence to price action, testing different strategies, exploring new markets, or simply understanding more about yourself as a trader.
There is little doubt that active participation in learning keeps you engaged, adaptable and sharp. Even making sure you ask at least one question at a seminar or webinar or making a simple list at the end of each session of the "3 things I learned", can be invaluable in developing momentum for your growth as a trader.
Your record-keeping and performance metrics should generate fresh questions that can guide future development.
Consequences of Non-Action:
Without direction in your learning, your progress is likely to slow.
I often reference that when someone talks about trading experience in several years, this is only meaningful if there has been continuous growth, rather than staying in the same place every year (i.e. only one year of meaningful experience)
Passive trading learning, for example, reading an article without applying, watching a webinar without engagement, or measuring without closing the circle through putting an action plan together for your development, can all lead to stagnation.
It is fair to suggest that taking shortcuts in trading learning is likely to translate directly into shortcuts in result success.
Active, focused development is essential for sustained improvement.
Are You Ready for Action?
Stephen Covey’s The 7 Habits of Highly Effective People presented a timeless model for self-development and purposeful living.
When applied to trading, these same habits form a powerful framework for consistency, focus, and growth.
Trading is a pursuit that demands both technical skill and emotional strength. Success is rarely about finding the perfect system, but about developing the right habits that support consistent, rational decision-making over time.
By integrating the principles of Covey’s seven habits into your trading practice, you create a foundation not only for profitability but for continual personal growth.
A market bubble occurs when asset prices rise far beyond any reasonable valuation.
It is driven by speculation, emotion, and the belief that prices will continue rising indefinitely.
For traders, the challenge is more about finding a way to manage a bubble, rather than just identifying that one exists.
By their very nature, bubbles can persist far longer than any logical analysis suggests. There are opportunities as they develop, but timing their peak is virtually impossible.
Understanding their characteristics and having a systematic way of managing bubbles in your trading strategy is worth considering for any trader.
What is a Bubble?
Market bubbles have distinct features that separate them from normal bull markets or even overvalued conditions for a particular asset:
Dramatic Price Appreciation Disconnected From Fundamentals
In a bubble, traditional valuation metrics become meaningless.
Company or asset fundamentals that usually matter to market participants are ignored in the hope of what might be.
Cash flow, profit margins, competitive positioning, and (in some cases) producing revenue may be dismissed.
Widespread Participation And "This Time Is Different" Narratives
Bubbles require mass market participation.
When every headline you see or article you read references "this time is different," or "the old rules don't apply anymore," it is a sign that the collective psychology has shifted from normal caution.
Social media may begin to explode with ever more frequent success stories, and for the individual trader, the fear of missing out becomes increasingly overwhelming.
Credit and Leverage Fuelling Demand
Bubbles are typically accompanied by easier credit conditions.
When interest rates are lowered and investors are confident in general economic conditions, any spare cash is put to work.
In stock or other market bubbles, you may see retail traders maxing out credit cards to buy call options, with the put/call ratio becoming increasingly distorted.
This leverage often amplifies the rise and the eventual fall, making the risk even more acute and potentially damaging to trader capital.
Vertical Price Charts in Final Stages
One of the telltale signs of a bubble's final phase is a parabolic price chart.
Prices seem to go up daily, and every minor pullback is short-lived (creating more buying pressure).
This is the euphoria stage. It is where the greatest danger is.
The fear of missing out on further moves is at its highest, and a logical willingness to take profit off the table diminishes in the minds of ever more excited traders.
New participants may continue to enter solely for the way the price is appreciating. Entering into the move only understanding that what they are buying is going up, so they want to join in too.
Bubble vs. Overvalued: Key Differences
Not every expensive market is a bubble. Several characteristics distinguish a bubble from a simpler and far less dangerous overvaluation:
Elevated Valuations With Reasoned Fundamental Justification
An overvalued market has stretched valuations, but can point to real supporting factors (at least to some degree).
Examples include strong earnings growth, low interest rates, disruption in service or productivity, and providing genuine temporary value.
Even if prices respond to less obvious immediate influencing factors, such as international events, policy changes, and supply issues, the fact that some factors justify continued positive sentiment (even if somewhat unfulfilled) is a positive sign.
Linear or Steady Uptrend
Overvalued markets tend to grind higher with a more sustainable trend rather than a vertical spike. There are normal corrections along the way, even if the highs and lows of a fluctuation are higher.
Reasonable Participation Levels
There is evidence of institutional investors buying on any dips, but common retracements last days or even weeks.
Retail participation exists but isn't frenzied and plastered all over social media every day or referenced in mainstream media consistently.
Some Scepticism Still Exists
There will be some legitimate and contrary opinions about valuations. Major financial media will present both bearish and bullish cases when a stock is discussed.
Trading Strategies for Potential Bubble Management
Here is the scenario: You bought early in the up move, you are now in profit, but some of the bubble signs are beginning to show up in your thinking.
Tiered Profit-Taking Strategies
Don't try to pick the top. As an alternative approach, begin to scale out systematically with partial closes. This will alleviate the potential for FOMO creeping in.
You could stage this with set points, e.g. sell 30% when you've doubled, another 30% when you've tripled, 20% when conditions clearly show evidence of entering bubble territory and, having banked a substantial profit already, you keep the final 20% with a trailing stop for the final run if it happens.
Trailing Stops With Wider Bands to Accommodate Volatility
Let’s assume you see the merit in some form of trial stop. In bubble conditions, normal stop distances will get you whipsawed out. Use percentage-based trailing stops or ATR multiples with enough room to accommodate bigger intraday moves.
For example, if your norm is to trail your stop 1.5 x ATR behind price at the end of every candle, then in increasingly volatile conditions during a parabolic move, consider 2,5 x ATR to allow room to move while still offering protection against price collapse.
Reduce Position Sizing and Leverage
The temptation in bubbles is to maximise gains by increasing your margin and entering more and more positions in one asset.
High leverage and significant single asset exposure in bubble conditions is a potential death sentence to trading capital.
Recognising the added risks you are contemplating before entry is critical. Combining this with an approach that reduces position sizing and increases margin requirements is consistent with good trading practice as risk increases.
Planned and Rigid Exits
Before buying, you should have already made decisions on what exit approaches you should take and the parameters at which they will be executed,
Having the exit plan as you enter can limit the chance of getting trapped by greed. Neglecting this and focusing on the opportunity alone can be disastrous.
Never Assume You Can Time the Top
It is usually a big mistake if you believe you will recognise the exact top and exit perfectly. Let’s be frank, even if you hit it lucky once, you won't be able to every time — no one does.
Recognise Behavioural Biases That May Affect Your Judgment
Bubbles can create powerful psychological forces.
Anchoring bias may mean that you fixate on peak prices. Confirmation bias makes you seek information supporting your bullish view and ignore opposing evidence. Recency bias makes you believe the recent trend will continue indefinitely.
The indisputable key to any bias management is awareness and honesty that some markets may just not be for you (or if they are, to proceed with extreme and continuous caution).
Psychological Preparation for Rapid Reversals
Mentally rehearse the worst scenario and clarity of planned action, e.g., “if it drops 10% in three days, I will ….”.
Having thought through your response and armed with unambiguous exits in advance will make execution easier when emotions run high and begin to dominate.
Final Thoughts
Extreme valuations, little fundamental underpinning, parabolic price action, and universal bullishness should be part of your bubble identification checklist and flag that your bubble action plan should be implemented.
If you are already in, or tempted to be so, then approach bubbles with honesty, awareness of your trading self and extraordinary discipline to follow through, as predicting what and when things may dramatically turn is close to impossible.
Never forget you are not smarter than the market, but you can (potentially) be smarter than many traders by planning and doing the right thing.
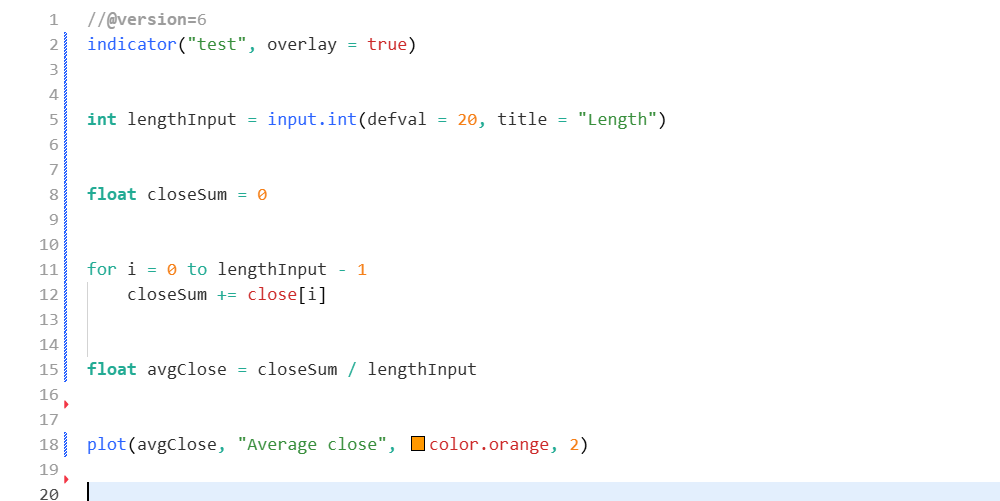
当用户将一个 Pine 脚本添加到图表中时,脚本会在一个等同于“大循环”的环境中运行:它会在可用数据中的每一根历史 K 线以及每一个实时 tick 上各执行一次代码。脚本可以通过历史引用运算符(history-referencing operator)访问之前 K 线上的执行结果;而通过使用 var 或 varip 关键字声明的变量,其计算结果可以在多次执行之间保持不变。这些特性使脚本能够通过逐 K 线(bar-by-bar)的计算来完成各种任务,而无需依赖显式的循环。
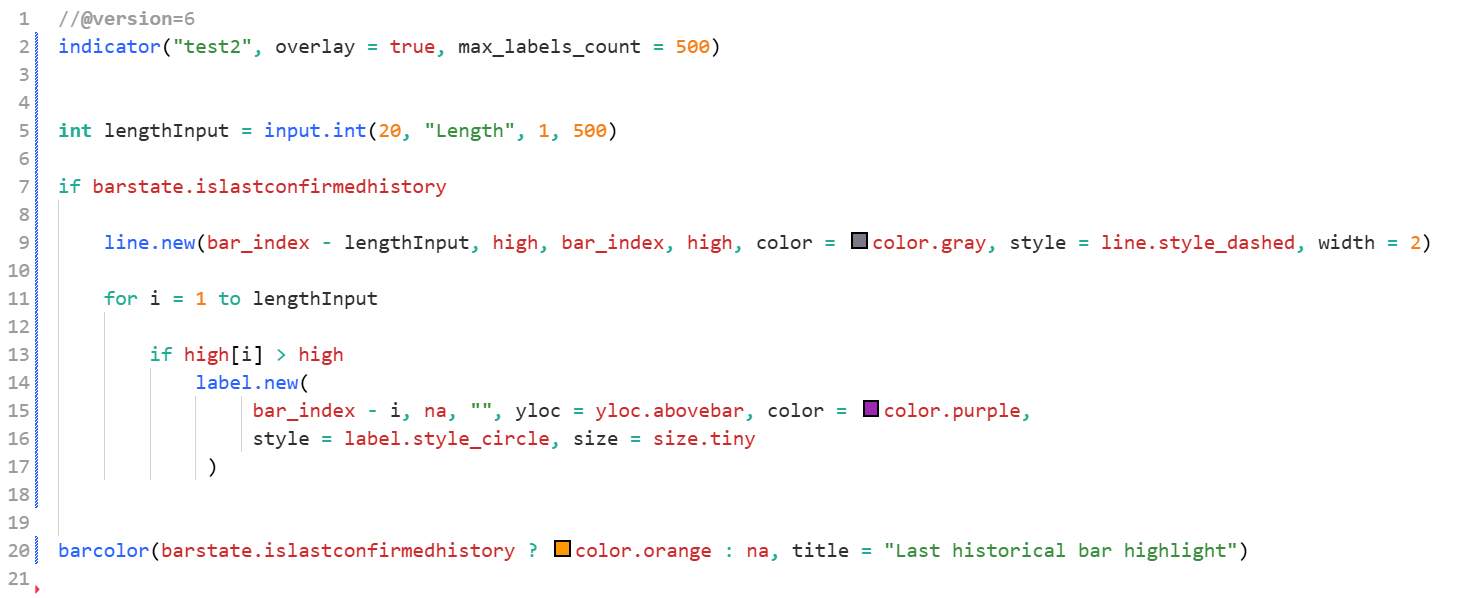
接下来进入For循环,首先判断过去某根 K 线的最高价 > 当前(最后历史)K 线的最高价,如果高于,则紫色圆形标签自动绘制在 K 线柱的上方。
最后一行代码,使用三元运算符判断给最后一根历史 K 线上色高亮。如果是最后一根历史 K 线,则为橙色,否则不改变颜色。
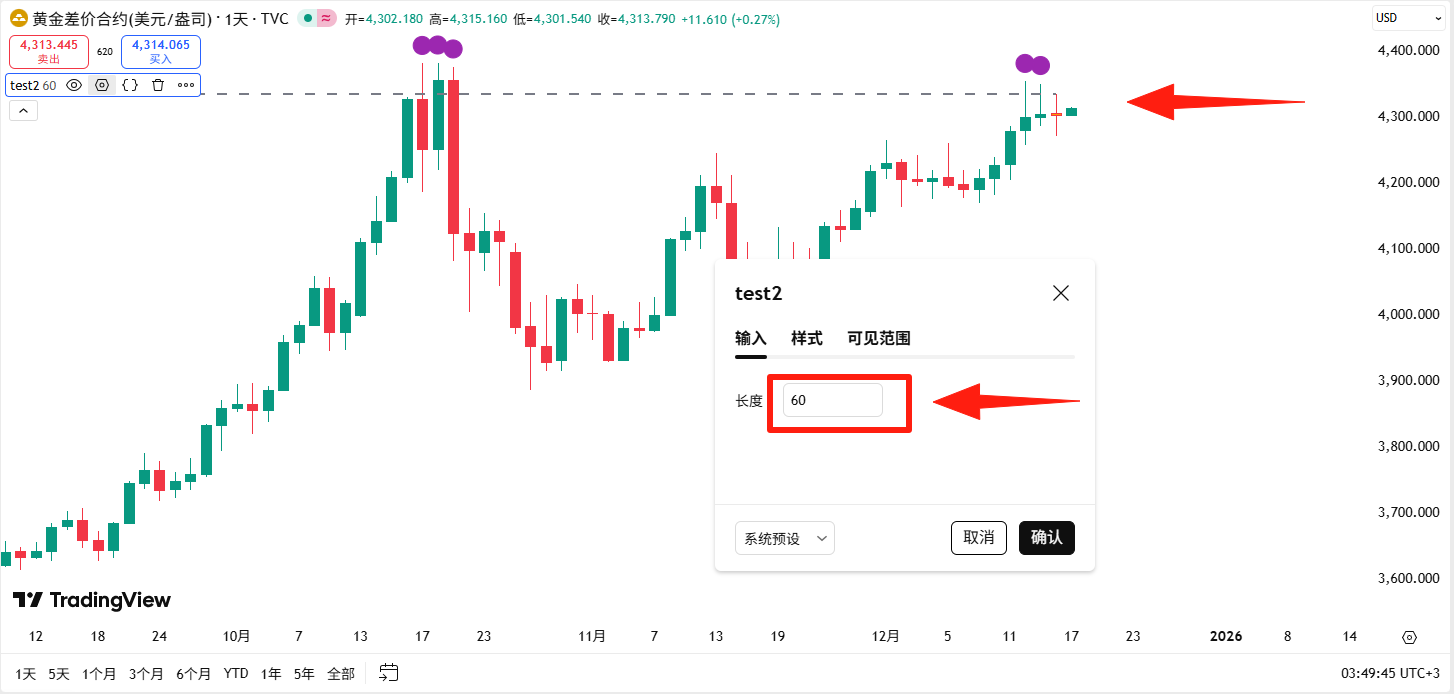
可以看到,当我们将长度参数设置为 60 后,图表中会在最高价高于当前 K 线最高价的历史 K 线上方显示紫色圆点,同时还会绘制一条表示当前 K 线最高价的水平虚线,用于直观地标示该参考价位。
综上所述,本文通过示例对比说明了 Pine Script 中“不必要循环”和“必须使用循环”的典型场景。合理理解 Pine 的执行模型,优先使用内置函数,可以提升脚本的简洁性与性能;而在需要基于当前 K 线回溯并分析历史数据时,循环则不可或缺。掌握循环的正确使用方式,有助于编写更高效、清晰且功能强大的 Pine Script 脚本。
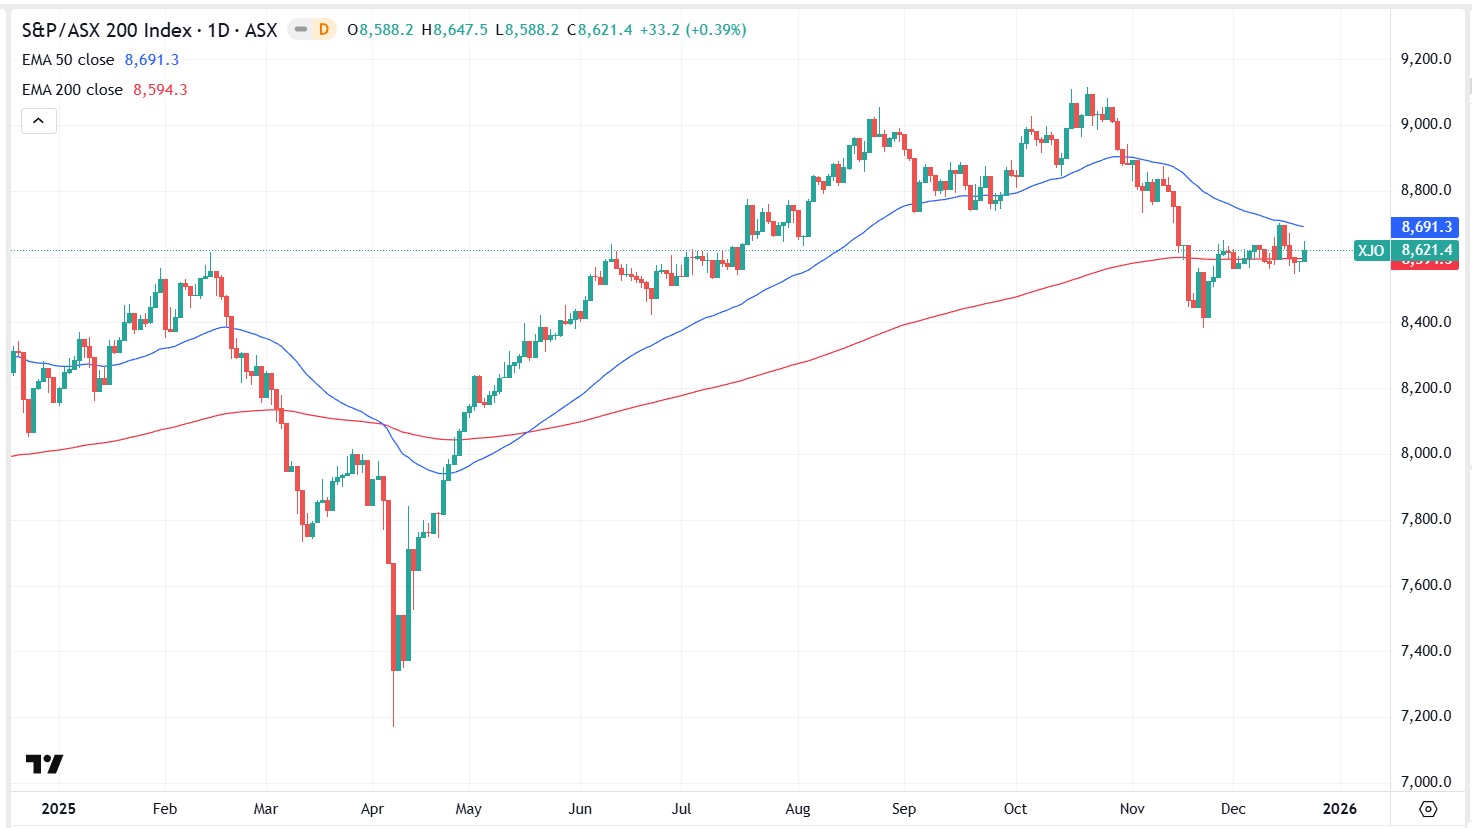
In 2025, the ASX 200 closed around 8,621 points and was up approximately 6% year to date (YTD) as of 19 December close. Market direction was most sensitive to Reserve Bank of Australia (RBA) expectations, commodity prices and China-linked demand, and (to a lesser extent) moves in the Australian dollar (AUD). The index recovered from November’s pullback, but remained below October’s record close.
Key 2025 drivers included:
RBA policy expectations: Sentiment was shaped by shifting views on the timing and extent of rate moves. The November pullback reflected repricing towards a longer pause and higher uncertainty around whether the next move could be a hike rather than a cut, particularly as jobs and inflation data surprised.
Resources and China sensitivity: With a meaningful resources weight, the index responded to iron ore stability, strong gold prices and relative firmness in base metals. China data and any perceived policy support (including signals from the People’s Bank of China (PBOC)) remained important for the export backdrop. A relatively stable AUD also reduced currency-related noise for exporters.
Index composition and market structure: The ASX 200’s heavier tilt to materials and banks, and lower exposure to high-growth technology, meant it often lagged tech-led global rallies, but tended to hold up better when AI and growth valuations were questioned.
Corporate earnings: Reporting season outcomes influenced valuation support. In September’s half-year reporting season, around 33% of ASX 200 companies beat expectations, which helped underpin pricing around current levels.
Current state
The ASX 200 was roughly 5% below its late-October record high close of 9,094 points. After the November retracement, support around 8,400 appeared to hold and buying interest improved. The 50-day EMA near 8,730 (a prior consolidation area) was a commonly watched near-term reference, noting technical indicators can be unreliable.
What to watch in January
China and commodity demand: Growth, trade and any fresh stimulus inference from the PBOC may affect sentiment.
Domestic inflation and labour data: CPI and jobs prints are key inputs into RBA expectations.
Key levels and follow-through: The post-November rebound may need continued demand to sustain momentum.
Source: Trading View
What moved the Nikkei 225 in 2025?
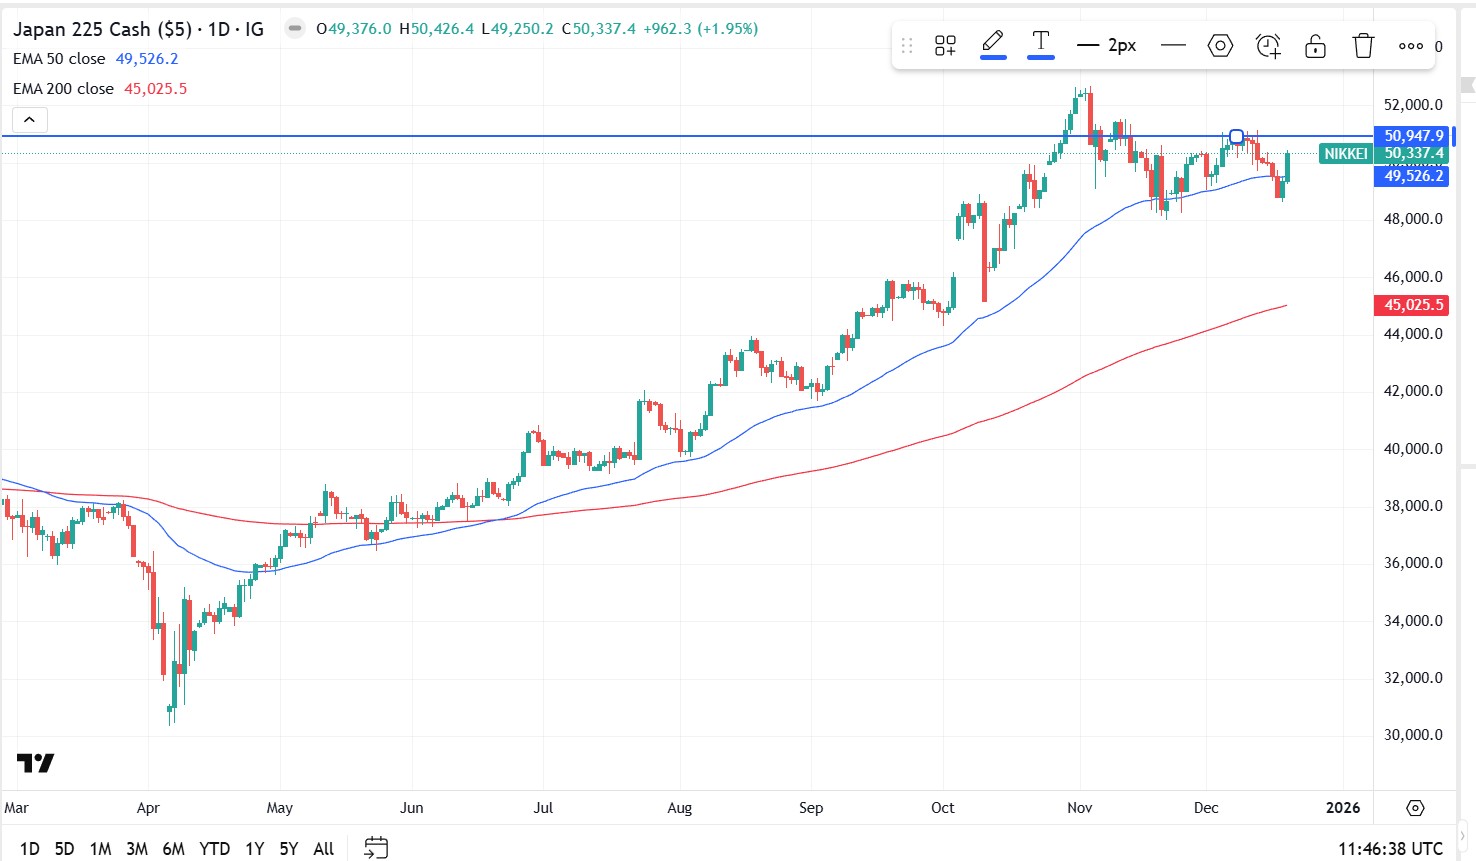
In 2025, the Nikkei 225 traded around 39,200 points and was up approximately 21% year to date (YTD). Market direction was most sensitive to moves in the Japanese yen (JPY) and Bank of Japan (BOJ) communication, with the index consolidating after multi-decade highs. While broader signals remained constructive, consolidation can resolve either higher or lower.
Key influences included:
JPY movements and earnings translation: A weaker JPY can boost the reported value of overseas earnings for some exporters, although it may also increase input and import costs. The net impact often depends on company hedging practices and varies by sector, with effects most evident in export-heavy industries such as automotive, industrials and parts of technology manufacturing.
Gradual BOJ policy transition: The BOJ continued to step away from ultra-easy settings, but tightening was generally cautious. Markets largely priced a slow, conditional normalisation, which helped limit downside, even as policy headlines created bouts of volatility.
Corporate governance reforms: Ongoing improvements in capital efficiency and shareholder returns supported interest from overseas investors. Share buybacks, stronger balance-sheet discipline and improved return on equity (ROE) contributed to re-rating in parts of the market.
Global cyclical exposure: The Nikkei moved with shifts in global manufacturing sentiment and expectations for US growth, particularly during risk-on phases associated with AI-related capital spending.
Current state
After pushing to multi-decade highs earlier in the year, the Nikkei spent time consolidating but has remained structurally strong. Price sits above key long-term moving averages, and some technicians watch the 50-day exponential moving average (EMA) as a potential reference level (noting these indicators can be unreliable). Currency swings and shifting BOJ expectations were commonly cited as contributors to much of the second-half volatility, although pullbacks were generally met with buying interest.
What to watch in January for Japan
JPY volatility: Sharper yen moves, especially if driven by BOJ or Federal Reserve expectations, could quickly change exporter earnings assumptions.
BOJ communication: Small changes in language on inflation persistence or bond market operations may move sentiment.
Global growth data: US and China manufacturing and trade prints remain key inputs for an externally focused economy.


.jpg)
.jpg)


.jpg)
.jpg)