
%20(1).jpg)
震荡中的信号,港股能否迎来真正的底部?
10月,恒生指数延续回调格局,全月累计下跌948点,月初触及27,381点高位后快速回落至25,145点,跌幅达到61.8%的黄金比率水平,随后虽反弹至26,588点,但未能持续突破,显示短期受均线压制,向上动力有限。内地9月制造业PMI创半年低位且低于预期,加上全球宏观因素如美元走强、通胀压力持续,使恒指多次受挫,市场情绪谨慎。
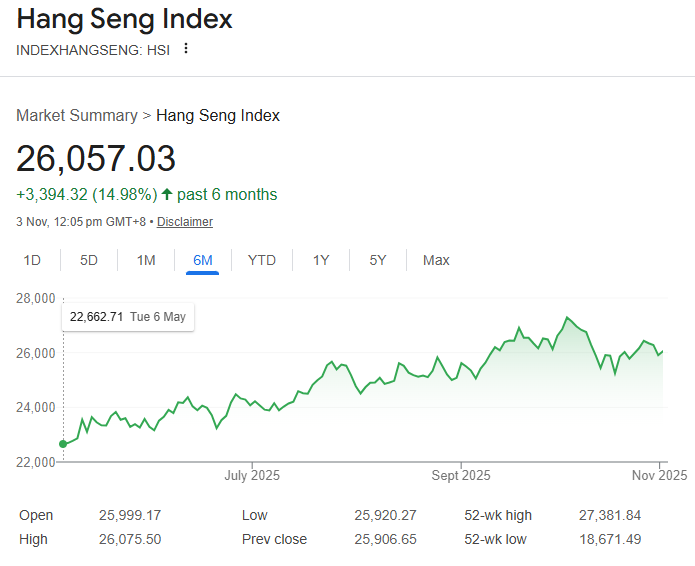
进入11月,恒指夜期先行反弹69点,显示短期市场情绪略有回暖。此前美联储降息预期和中美贸易谈判利好消息已陆续落地,提供有限支撑,但短期缺乏新利好刺激,恒指重返高位可能性有限。若A股走势改善或科技股业绩超预期,恒指未来两个月仍有机会向今年高位27300点挑战。
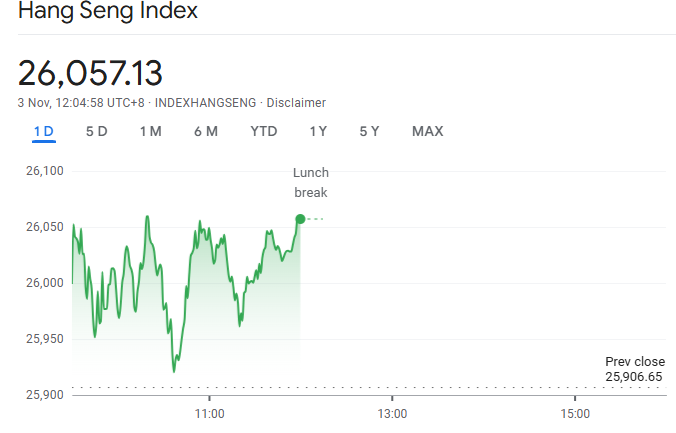
本周一盘中,恒指回到26,000点附近震荡,显示市场仍在观望。技术面上,强势股指数微升,弱势股指数下降,优质板块仍具一定抗跌能力。整体来看,港股短期延续震荡整固格局,预计仍在25,300至26,300点区间震荡整理。
市场个股表现
从板块来看,科技股受业绩不及预期及全球芯片需求疲软影响出现回调;高股息蓝筹如银行、公用事业等抗跌板块成为资金避险首选;部分资源类个股受金属价格反弹支撑出现阶段性上涨;房地产板块风险仍存,部分开发商财务困境对市场情绪形成压制。总体而言,港股呈现“震荡筑底”态势,反映出市场在基本面、政策面及宏观因素间的博弈。
主要影响因素
- 美联储政策预期主导资金流向
多位美联储官员暗示降息窗口可能在明年上半年开启,短期推高风险资产包括港股和A股的资金流入。然而,美国通胀仍保持黏性,政策宽松节奏不确定,使市场短线资金频繁进出,缺乏持续上涨动力。对于港股而言,这意味着短期资金流入可能只是“阶段性反弹”,而非趋势性上涨。 - 内地经济复苏分化,港股估值修复受限
中国10月制造业PMI略低于荣枯线,显示复苏力度仍不足。尽管政策持续宽松,如专项债加速发行、房地产融资边际放松,但企业盈利恢复仍需时间。港股估值虽处历史低位,但市场仍在等待更强的基本面催化。投资者可关注政策落地力度及企业盈利改善的信号,这将决定港股后续的估值修复空间。 - 地缘局势与全球风险偏好
中东紧张局势持续,提升全球避险情绪,推动黄金、原油价格上行,部分风险资产承压。港股短期可能面临外资重新配置至美元或避险产品的压力,削弱流入力度。同时,人民币汇率波动也让南向资金趋于保守,进一步增加市场的不确定性。 - 宏观经济数据与市场情绪
美国通胀压力仍存,市场对降息预期降温,加息预期增强可能导致资金流出香港,从而对港股形成下行压力。中国经济数据虽显示复苏,但房地产市场调整拖累整体增长,使市场短期内难以形成强劲上涨动力。 - 行业特定新闻
中国科技行业监管政策仍是市场关注焦点。虽然监管有所缓和,但未来可能出台的新规仍对科技股产生压力,导致板块短期承压。投资者应关注科技股业绩发布及政策变化,以判断其中长期投资价值。 - 地缘政治因素
中美关系紧张、贸易摩擦及技术竞争仍在,对市场情绪形成影响。国际贸易环境的变化可能影响港企盈利前景,从而影响港股表现,尤其是出口导向型及高科技板块。
结构性机会与市场影响
尽管港股整体震荡,但结构性机会逐渐显现:高股息、现金流稳定的金融与公用事业板块受机构青睐;科技股短期承压,但AI、半导体及互联网龙头中长期前景仍被看好;新能源与资源板块受能源转型及金属价格上涨支撑;内地消费和旅游板块若政策落地,有望迎来补涨。
如果政策与市场流动性同步改善,恒指有望逐步筑底并展开估值修复;反之,若全球通胀回升或地缘风险加剧,市场可能继续维持震荡格局。短期来看,恒指预计将在25,300至26,300点区间震荡整固,投资者应关注内地经济数据、科技股业绩及全球宏观因素对市场的影响。
总体而言,港股正处筑底期,中长期投资价值逐步显现。投资者应保持审慎,密切关注市场动态,并结合板块机会进行合理配置,以应对潜在不确定性。
免责声明:GO Markets 分析师或外部发言人提供的信息基于其独立分析或个人经验。所表达的观点或交易风格仅代表其个人;并不代表 GO Markets 的观点或立场。
联系方式:
墨尔本 03 8658 0603
悉尼 02 9188 0418
中国地区(中文) 400 120 8537中国地区(英文) +248 4 671 903
作者:
Alena Wang | GO Markets 墨尔本中文部

The information provided is of general nature only and does not take into account your personal objectives, financial situations or needs. Before acting on any information provided, you should consider whether the information is suitable for you and your personal circumstances and if necessary, seek appropriate professional advice. All opinions, conclusions, forecasts or recommendations are reasonably held at the time of compilation but are subject to change without notice. Past performance is not an indication of future performance. Go Markets Pty Ltd, ABN 85 081 864 039, AFSL 254963 is a CFD issuer, and trading carries significant risks and is not suitable for everyone. You do not own or have any interest in the rights to the underlying assets. You should consider the appropriateness by reviewing our TMD, FSG, PDS and other CFD legal documents to ensure you understand the risks before you invest in CFDs. 免责声明:文章来自 GO Markets 分析师和参与者,基于他们的独立分析或个人经验。表达的观点、意见或交易风格仅代表作者个人,不代表 GO Markets 立场。建议,(如有),具有“普遍”性,并非基于您的个人目标、财务状况或需求。在根据建议采取行动之前,请考虑该建议(如有)对您的目标、财务状况和需求的适用程度。如果建议与购买特定金融产品有关,您应该在做出任何决定之前了解并考虑该产品的产品披露声明 (PDS) 和金融服务指南 (FSG)。
.jpg)
.jpg)
.jpg)

.jpeg)
.jpeg)