

奥运会和冬季奥运会吸引了数周的全球关注,吸引了数百万观众,成为头条新闻。对于交易者来说,这种关注通常就像催化剂,但真正的市场驱动因素保持不变:宏观经济、政策和全球风险情绪,而不是体育日历。
那么,为什么一些交易员说在重大体育赛事期间业绩疲软呢?
这通常归结为未能适应利润率可能发生变化的条件,尤其是流动性和参与度。
1。预期 “事件波动”
一个重大的全球事件可以假设市场 应该 多移动。即使条件不支持,一些交易者也认为会出现更大的波动,因此设定了突破或增加风险的立场。
关键驱动因素
- 在某些市场和交易日中,参与度的减少会削弱趋势的跟进度
- 情绪可能会夸大预期,超出价格走势的水平
示例:交易者预计奥运会开幕式期间会出现突破,但低区域参与度限制了价格变动,导致开局不合理。
2。在平静的交易时段强行交易
当价格走势较慢且区间压缩时,一些交易者会感到压力,要求他们保持活跃并接受较低质量的入场机会。
关键驱动因素
- 狭窄的盘中区间会增加虚假信号
- 较低的信念可能有利于盘整而不是趋势,从而增加虚假突破的风险
- “保持参与” 会降低选择性
要点:使用更安静的会话来完善设置或查看数据,而不是强制进行边际交易。
3.忽略较少的流动性
在重大全球事件期间,参与度可能会略有缓解,而且在较短的时间范围内,这种影响通常更为明显。日线图可能看起来很正常,而盘中价格走势随着走势的增加而变得更加波动。
关键驱动因素
- 在深度较低的条件下,价格更容易上涨,灯芯尺寸可能会增加
- 在某些工具和交易时段中,流动性变弱可能伴随着更大的点差和更大的执行变动(因市场、场地和经纪商条件而异)
时间框架对较薄条件的敏感度
上表仅供参考(因市场而异):日线图可能看起来正常。五分钟的图表可能会让人感觉更不稳定。
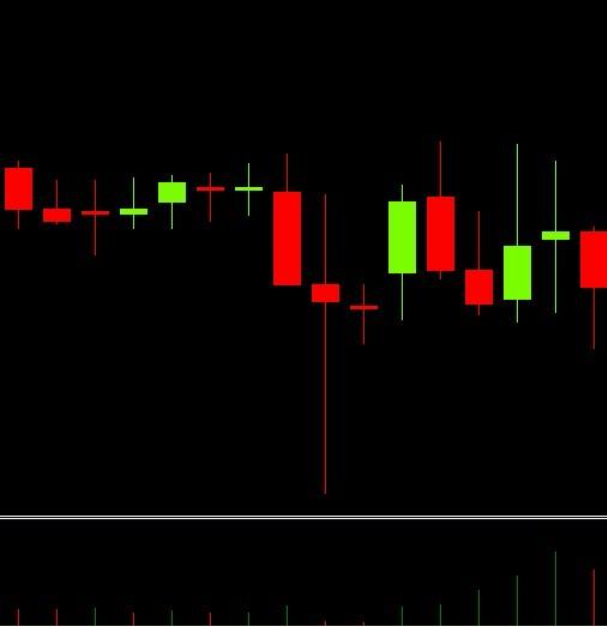
低音量大灯芯示例
4。在异常情况下使用正常尺寸
即使整体波动率看起来稳定,当流动性减少时,执行风险也会增加,尤其是对于短期或超短线交易式的方法而言。
关键驱动因素
- 滑点可能会增加,止损可能会 “过冲”
- 薄弱的条件可以更容易地在噪音中触发停机
- 与正常情况相比,更大的利差可以改变进入/退出结果
调整:保持固定尺寸可能会失真 有效 风险。一些交易者在设置止损/限额等风险参数时,特别是在较短的交易时段中,会审查交易成本,包括点差和执行条件。
5。跟进度低的交易突破
当参与度下降时,趋势跟踪策略可能会步履蹒跚。动量可能会迅速消散,虚假的中断变得更加普遍。
关键驱动因素
- 流量减少会限制持续的定向移动
- 一些低流动性机制可能倾向于均值回归而不是动量
示例:经典的区间突破似乎在盘中有效,但由于后续交易量未能实现,该突破会迅速消失。
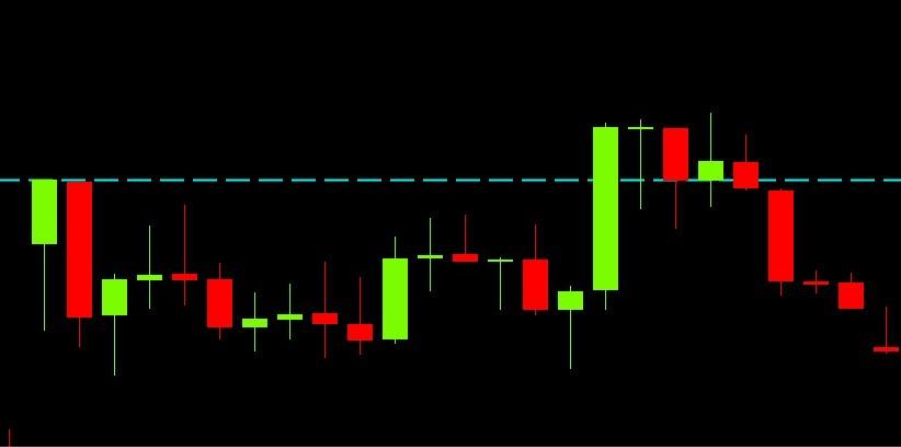
突围失败示例
6。忽视时机和分散注意力的风险
没有可靠的证据表明奥运会日历可以预见地推动地缘政治事件。但是,当紧张局势已经加剧时,重大的全球事件有时可能与注意力转移到其他地方同时发生,有点类似于节日、选举或重大峰会。
交易者应确定条件何时变慢或变弱,并进行相应的调整,调整策略以降低跟进风险,并根据执行现实调整头寸规模。最重要的是,在这段时间内,当优势有限时,避免强行交易。
即将发生的经济事件

Reportingdates and release times are based on company investor relations calendars whereconfirmed. Where dates or times are not marked confirmed, they are GO Marketsestimates. Consensus EPS, revenue and analyst-range data are sourced fromBloomberg and Earnings Whispers, as at 09 July 2026 (AEST). Company guidance,backlog and operating metrics are sourced from the latest company filings orresults presentations, unless stated otherwise. Any scenario analysis reflectsGO Markets analysis. Figures and schedules may change without notice.
The information provided is of general nature only and does not take into account your personal objectives, financial situations or needs. Before acting on any information provided, you should consider whether the information is suitable for you and your personal circumstances and if necessary, seek appropriate professional advice. All opinions, conclusions, forecasts or recommendations are reasonably held at the time of compilation but are subject to change without notice. Past performance is not an indication of future performance. Go Markets Pty Ltd, ABN 85 081 864 039, AFSL 254963 is a CFD issuer, and trading carries significant risks and is not suitable for everyone. You do not own or have any interest in the rights to the underlying assets. You should consider the appropriateness by reviewing our TMD, FSG, PDS and other CFD legal documents to ensure you understand the risks before you invest in CFDs. 免责声明:文章来自 GO Markets 分析师和参与者,基于他们的独立分析或个人经验。表达的观点、意见或交易风格仅代表作者个人,不代表 GO Markets 立场。建议,(如有),具有“普遍”性,并非基于您的个人目标、财务状况或需求。在根据建议采取行动之前,请考虑该建议(如有)对您的目标、财务状况和需求的适用程度。如果建议与购买特定金融产品有关,您应该在做出任何决定之前了解并考虑该产品的产品披露声明 (PDS) 和金融服务指南 (FSG)。


.jpeg)
