
Go further with GO Markets
Trade smarter with a trusted global broker. Low spreads, fast execution, powerful platforms, and award-winning customer support.
20 Years Strong
Celebrating 20 years of trading excellence.
Built for traders since 2006.
For beginners
Just getting
started?
Explore the basics and build your confidence.
For intermediate traders
Take your
strategy further
Access advanced tools for deeper insights than ever before.
Professionals
For professional
traders
Discover our dedicated offering for high-volume traders and sophisticated investors.
Get more out of every trade
Explore our limited-time special offers

Get Started with GO Markets
Whether you’re new to markets or trading full time, GO Markets has an
account tailored to your needs.

Trusted by traders worldwide
Since 2006, GO Markets has helped hundreds of thousands of traders to pursue their trading goals with confidence and precision, supported by robust regulation, client-first service, and award-winning education.
*Trustpilot reviews are provided for the GO Markets group of companies and not exclusively for GO Markets Ltd.


*Awards were awarded to GO Markets group of companies and not exclusively to GO Markets Ltd.
Explore more from GO Markets
CFD markets
Trade CFDs across forex, indices, shares, commodities, metals, ETFs and more.
Platforms & tools
Trading accounts with seamless technology, award-winning client support, and easy access to flexible funding options.
Academy
Learn the skills, strategies, and mindset behind long-term trading success.
Accounts & pricing
Compare account types, view spreads, and choose the option that fits your goals.

Go further with
GO Markets.
Explore thousands of tradable opportunities with institutional-grade tools, seamless execution, and award winning support. Opening an account is quick and easy.
News & insights
Powerful tools for every trading style and preference.
Few institutions shape everyday Australian life as quietly, or as powerfully, as the Reserve Bank of Australia (RBA).
Every time you renew a mortgage, open a savings account, or watch the Australian dollar move, the RBA's decisions are somewhere in the background.
But what actually goes on inside the bank, and what drives the calls that ripple through the entire Australian economy?
Quick facts
- The RBA's cash rate is the single most-watched number in Australian finance.
- Rate decisions are made by a nine-member board, eight times per year.
- The RBA targets inflation of 2–3% on average over time.
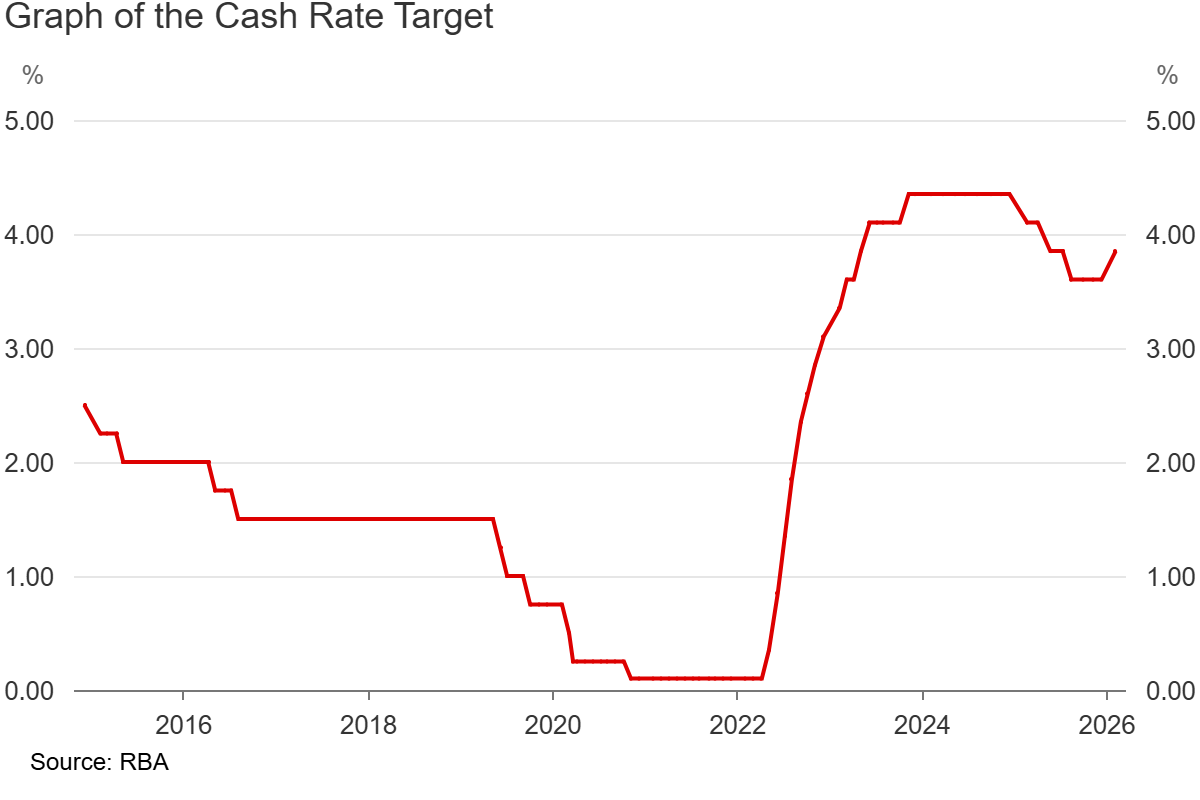
- Australia's cash rate reached a 12-year high of 4.35% in November 2023.
What is the RBA?
The RBA is Australia’s central bank. Unlike commercial banks that lend to individuals and businesses, the RBA lends to financial institutions, issues the nation's currency, and acts as the government's banker.
It also plays a role in overseeing the stability of the broader financial system. It can step in during periods of economic stress to ensure credit keeps flowing.
What is central bank independence, and why does it matter?
For the average Australian, the RBA is most visible through its influence on interest rates. By setting a target for the cash rate, it shapes borrowing and saving costs across the economy.
This influence can filter through to mortgage rates, business lending, and the price of the Australian dollar.
How does the cash rate work?
The cash rate is the interest rate the RBA charges on overnight loans between banks. Banks constantly lend money to each other to manage their daily cash needs, and the RBA sets the floor on what those borrowing costs are.
When the RBA raises the cash rate, banks tend to pass that cost on to borrowers; when it cuts, interest on repayments tends to fall.
This knock-on effect is why the cash rate is such a powerful tool. Banks price their products off the cash rate, so a 0.25% RBA move typically flows through to variable mortgage rates within weeks.
Effects of RBA cash rate moves
A large share of Australian mortgages are on variable rates, so any change in the cash rate tends to pass through to household budgets faster than in countries where fixed-rate lending is more prominent.
How does the RBA make decisions?
The RBA board meets eight times per year to set monetary policy, with meeting dates published in advance.
The Board has nine members: the Governor, the Deputy Governor, the Secretary to the Treasury, and six external members appointed by the Treasurer for five-year terms. Decisions are made by consensus where possible, with the Governor holding a casting vote if needed.
These members make decisions with the intention of maintaining price stability and supporting full employment, with the economic prosperity and welfare of the Australian people as the overarching objective.
Price stability generally means keeping inflation within a 2–3% target band on average over time. The "on average over time" framing is deliberate; the RBA doesn't panic if inflation briefly strays outside the band, but sustained deviation in either direction can prompt the Board to consider a policy response.
Full employment is viewed in terms of the Non-Accelerating Inflation Rate of Unemployment (NAIRU), the lowest unemployment rate the economy can sustain without generating inflationary wage pressure. Estimates vary, but the RBA has historically placed this around 4–4.5%.
The tension between these two goals defines most RBA decisions. A strong labour market is good news for workers, but it can push wages (and therefore inflation) higher. On the other hand, cooling inflation often requires accepting some rise in unemployment.
In the lead-up to each meeting, RBA staff prepare extensive briefing materials covering every major economic indicator. The Board debates the evidence over two days before reaching a decision. The outcome is announced publicly at 2:30 pm AEDT on the meeting day, followed by a detailed statement and a press conference by the Governor.
Key inputs to each decision
The RBA's recent rate cycle
The current rate cycle is one of the most aggressive in the RBA's modern history. After holding the cash rate at a record low of 0.10% through the COVID pandemic, the RBA began hiking in May 2022 and raised rates thirteen times before pausing at 4.35% in November 2023.
A borrower with a $750,000 variable-rate mortgage saw their monthly repayments rise by roughly $1,500 to $1,800 between May 2022 and late 2023, a significant squeeze on household budgets that fed directly into the consumer slowdown the RBA was trying to engineer.
Throughout 2025, the RBA periodically dropped the rate back down, with it now sitting at 3.75% after a recent hike in February 2026.
What should traders watch?
Monthly CPI
Monthly CPI is generally considered the most important single data point for RBA watchers. If the data returns a “quarterly trimmed mean CPI” print above 3%, it can sharpen expectations of a hike or delay cuts (particularly if it surprises to the upside). The “trimmed mean” is the RBA's preferred measure as it tends to reduce data noise from volatility.
Labour force data
The labour force data includes numbers on the unemployment and underemployment rates, and wage growth. The RBA watches these numbers closely for any signs that wages may be rising at a pace inconsistent with the inflation target.
Governor's speeches and appearances
Between formal meetings, the Governor testifies before the House Economics Committee and delivers public speeches. These are closely scrutinised for sentiment signals of the board. Simple shifts in language, from "patient" to "vigilant", for example, can often be perceived as a change in tone that could influence the rate decision in upcoming meetings.
Neutral rate
The “neutral rate” is the cash rate range the RBA believes will neither speed the economy up nor slow it down. The current neutral cash rate is estimated at around 3.0–3.5%, which is below the actual rate of 3.75%, a sign that the RBA is still pumping the brakes on the economy. As the rate gets closer to the neutral zone, it can signal less urgency for the RBA to keep cutting. However, surprise data can always upend this assumption.
Global central banks
The RBA doesn't operate in isolation. If the US Federal Reserve holds rates higher for longer, it limits the RBA's room to cut without weakening the AUD and importing inflation through higher import prices.
Bottom line
The RBA's job is to keep the Australian economy on an even keel, and the cash rate is its main tool for doing so. Its decisions touch almost every corner of Australian financial life, from what you pay on your mortgage to how the Aussie dollar trades.
For traders, understanding how the RBA thinks and what it is watching goes a long way toward making sense of the broader Australian economic environment.

Before the charts start talking, the region does. Over the weekend, the Middle East moved from tense to kinetic. Joint US and Israeli strikes hit targets inside Iran, and multiple outlets reported Iran’s Supreme Leader Ayatollah Ali Khamenei was killed. That single fact changes the whole market sentence structure and it is not just geopolitics, it is risk premia being re-priced in real time, across energy, volatility and the global growth outlook.
Markets do not trade tragedy, rather they trade uncertainty. When the uncertainty sits on top of global energy arteries, price discovery gets loud.
At a glance
- What happened: Multiple major outlets reported that Iran’s Supreme Leader Ayatollah Ali Khamenei was killed following joint US and Israeli strikes inside Iran, with Iranian state media cited as confirming his death.
- What markets may focus on now: A fast-moving repricing of geopolitical risk premia, led by crude and refined products, plus cross-asset volatility as headlines drive liquidity, correlations and intraday ranges.
- What is not happening yet: Markets may be pricing more of a headline risk premium than a fully evidenced, sustained physical supply disruption.
- Next 24 to 72 hours: Focus is likely to stay on escalation signals and second-order constraints, including any impact on Gulf shipping routes and the policy and diplomatic track, including any UN Security Council dynamics.
- Australia and Asia hook: Flight and airspace disruptions are already spilling beyond the region. For markets, Asia-facing sensitivities can show up through refinery margins and shipping and insurance costs, while AUD can behave as a risk barometer when global risk appetite is unstable.
Oil is the transmission mechanism
Brent crude spiked by as much as 13% in early trade on Monday 2 March, touching around US$82 per barrel in reporting, as the Strait of Hormuz risk moved from theoretical to immediate. The Strait matters because roughly one-fifth of global oil and gas shipments pass through it and when tankers hesitate, insurers re-price, and routes get re-written, energy becomes a volatility product.
Base case: partial disruption and higher “risk premium” in crude, with big intraday swings.
Upside risk: a sustained shipping slowdown or direct infrastructurehits, which some analysts warn could push crude materially higher.
Downside risk: de-escalation headlines, emergency supply responses, orclearer shipping protection that compresses the risk premium.
Read More: Where the world’s oil supply depth actually sits.
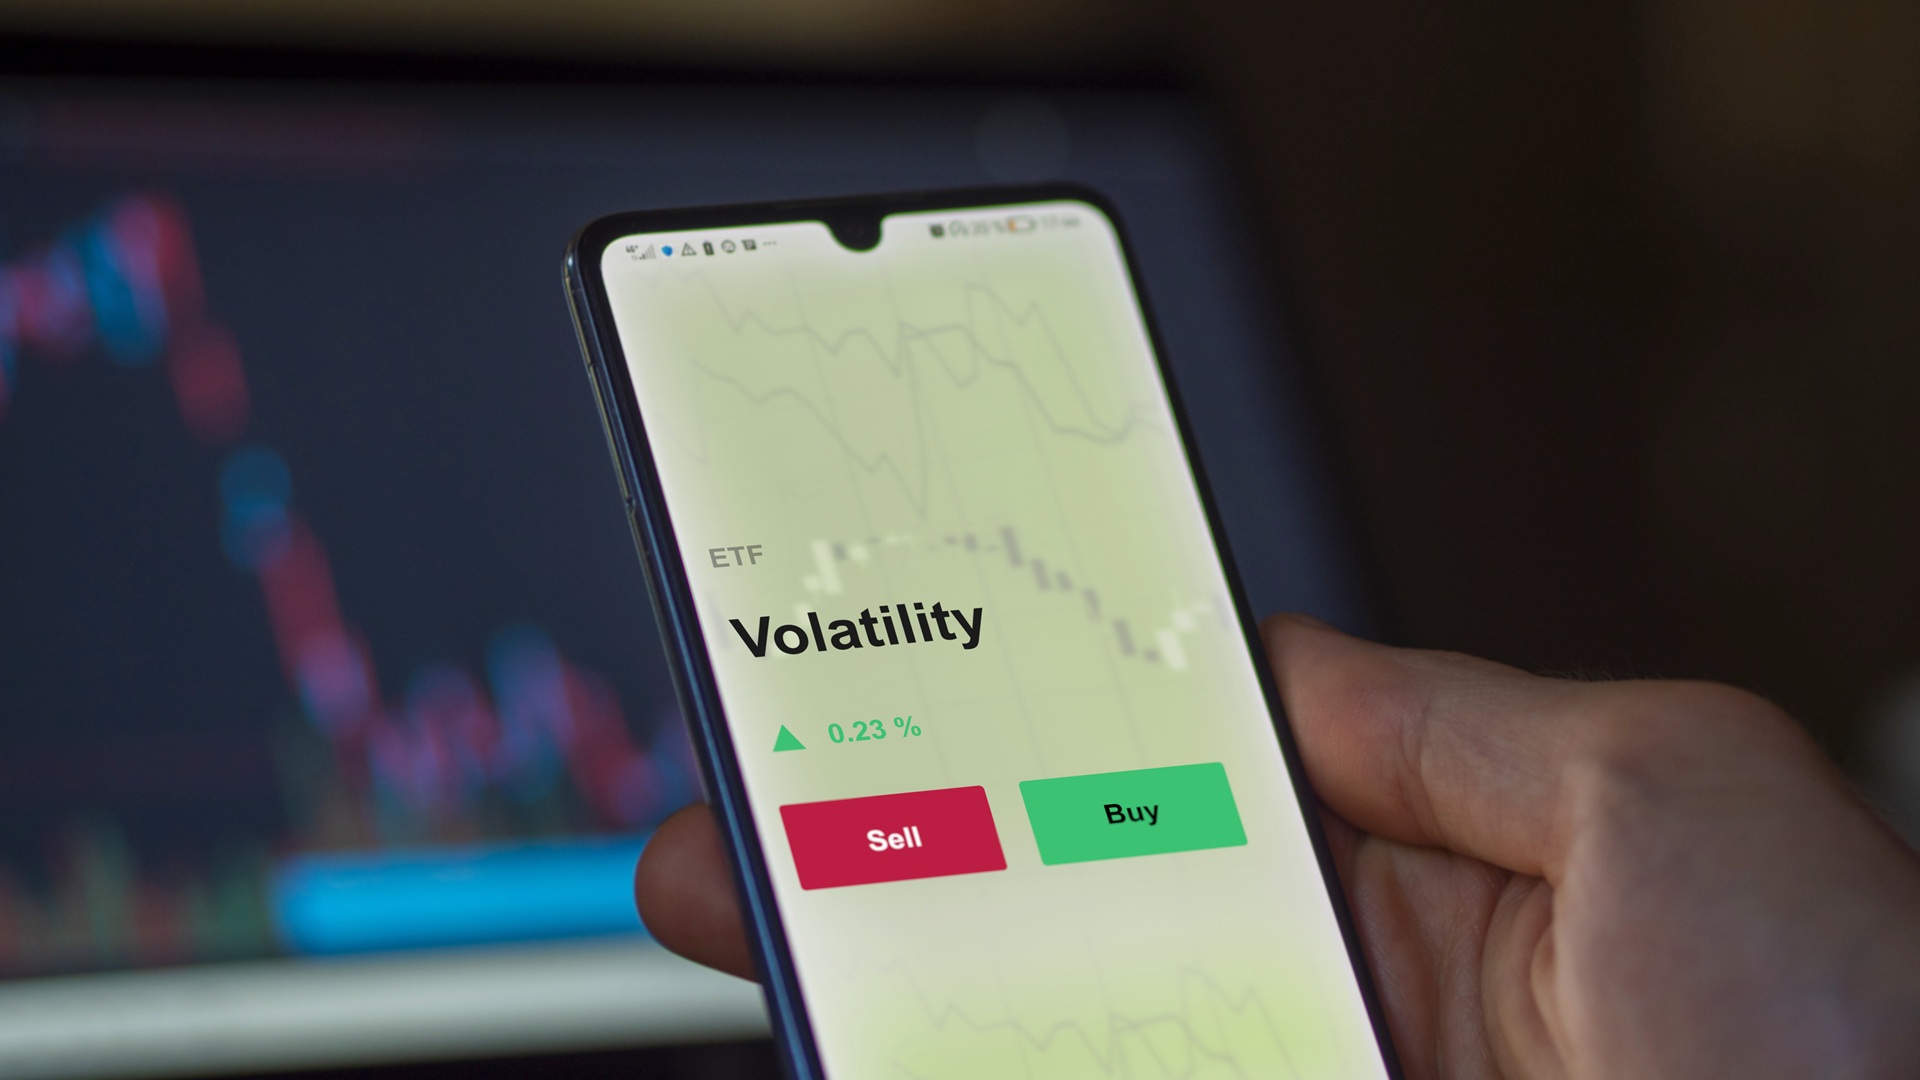
Volatility and equities
The VIX does not move in a vacuum, and this spike in uncertainty is already spilling into other asset classes in a fairly ‘textbook’ way. As volatility reprices, the market’s first instinct has been a flight to safety, alongside a scramble for commodities most exposed to the conflict.
Monday saw Asia opened with that tone: Japan’s Nikkei 225 was reported down around 2.4%, and Australia’s ASX 200 dipped before stabilising. At the same time, defensive positioning showed up in classic safe havens. Gold futures gapped higher by roughly 3% over the weekend, while traditional refuge currencies, led by the Swiss franc, attracted immediate inflows against both the euro and the US dollar.
Equity risk, by contrast, took the hit. US index futures, including the Dow and S&P 500, opened lower as desks moved to price in the twin threat of a wider regional conflict and the inflationary drag that can follow a sharp jump in energy costs.
Read More: Understanding volatility (and what it can mean for CFD trading conditions).
Safe havens do what they do
Gold rallied as the market reached for insurance. Reporting had gold up close to 3% in the same Monday session that oil surged. Worth noting for Aussie and Asia traders: when oil jumps and gold jumps together, the market is often telling you it is worried about both inflation and growth. That is a messy mix for central banks, including the RBA, because petrol-driven inflation can rise even as demand softens.
What this could mean for CFD risk management
Focus 1: map the event risk calendar
In headline-driven markets, prices can move faster than liquidity. The risk is not just being wrong; it can also be timing and execution risk in volatile conditions.
Some traders monitor which developments might change market sentiment (for example, official statements or verified operational updates). If you choose to trade, it may be worth understanding how price gaps and volatility could affect your position, including around session opens and major announcements.
Markets can gap or move quickly, and order execution (including stop orders, if used) may not occur at expected levels, especially in fast conditions or low liquidity. Features and outcomes depend on the product terms and market conditions.
Focus 2: watch the energy to inflation pathway
If crude remains elevated, markets may watch whether inflation expectations shift. If that occurs, it could influence rates, equities and FX and although outcomes depend on multiple factors and can change quickly.
That may be reflected in:
- Global bond yields, as rates markets adjust.
- Equity valuation sensitivity, particularly in long-duration and growth-heavy areas.
- FX moves, including across the Australian dollar, Japanese yen, and some commodity-linked currencies.
Want a comparable risk-premium setup? Look at Venezuela.
What to watch next
For general market context (not as a recommendation to trade), some observers monitor:
- Key headlines and official statements that point to escalation or de-escalation.
- Brent and WTI price action, including whether elevated levels persist beyond an initial spike.
- Inflation expectations and rates pricing, including moves in bond yields and market-based inflation measures.
- Risk-sentiment signals, including volatility levels and equity index futures behaviour around major sessions.
Volatility headlines can encourage rushed decisions and for leveraged products like CFDs, acting without a plan can increase the risk of losses. During times like this, a pattern does emerge.
News shock → Emotional reaction → Impulsive trade → Higher risk of avoidable losses
This isn’t about being “wrong” so much as it’s about skipping the emotional reaction between headline and trade idea.
Translation: The headline isn’t your signal. Your process is.
Middle East flare-ups, sanctions, shipping disruptions, regional security shocks? This is your general checklist for assessing how geopolitical developments may affect markets.
Note: This article provides general information only and is not financial advice. It does not take into account your objectives, financial situation or needs. CFDs are complex, leveraged products and carry a high risk of loss. Consider whether trading CFDs is appropriate for you and refer to the relevant disclosure documents before trading.
Step 1. Identify the driver
Here’s the trap: “Iran” is not the driver. “Conflict” is not the driver. Those are categories useful for cable news but too broad for a risk-defined CFD trade. What moves markets is the mechanism that got worse today than it was yesterday. Separate the headline from the specific mechanism.

Driver A: Energy risk
This is the Strait of Hormuz, shipping lanes, insurance and rerouting story. In Iran flare-ups, markets care because the threat isn’t just “war,” it’s friction in oil logistics including tankers avoiding routes, insurance premiums surging and temporarily suspended transits. When Hormuz risk gets priced, oil prices may react quickly where markets perceive increased shipping or supply risk, which can influence inflation expectations.
Driver B: Supply risk
This is not “ships are nervous.” This is about production outages, infrastructure hits, refinery disruptions and export constraints. This driver tends to matter more when the headline implies physical damage or credible near-term capacity loss.
Driver C: Funding stress
This is the under-discussed engine of ugly CFD outcomes: the “who needs dollars right now?” problem. This is not “risk-off vibes,” this is liquidity tightening, the kind that makes markets move together and can coincide with wider spreads, slippage and faster price moves, which may affect execution.
In an Iran flare-up, funding stress shows up when participants stop debating the headline and start doing the mechanical work of de-risking: broad USD demand, carry trades unwinding and correlated selling across risk assets. And here’s the key filter that stops you from overreacting: the USD tends to strengthen persistently and broadly mainly during severe funding stress, not every routine fear spike.
Driver D: Policy amplification
This is not about tensions rising so much as the rules changing, the kind of change that outlives the headline cycle and forces real repricing because it alters incentives, access, or flows. The Iran conflict headlines won’t stay local if policy escalates them through sanctions (supply, payments, shipping, insurance), changes to retaliation rules, or shifts in central bank reaction functions as oil risk feeds into inflation risk. That can harden rate expectations.
This is where “geopolitics” stops being narrative and becomes policy constraint and policy constraints tend to create follow-through because they change what market participants can do, not just what they think.
Before acting on a headline
If you choose to monitor breaking news, consider pausing before trading and checking whether the development is new, whether there are observable real-world constraints, and how markets are reacting. Don’t ask ‘is this bullish for gold?’. Instead, consider:
- Is this a flow story, a barrel story, a funding story, or a policy story?
- Is it new information or a remix of what markets already knew?
- Is there evidence of real-world constraint (shipping behaviour, insurance, official measures), or just rhetoric?”
Step 2. Identify the key markets
Some traders stick to a small set of markets they know well, especially when headlines hit. Liquidity and spreads can change fast. If you try to watch everything, you may end up trading your own adrenaline rather than the market.
1) Oil (WTI or Brent proxy)
If the driver is energy flow risk or supply risk, oil is usually the first and cleanest repricing channel—risk premium, inflation impulse, and global growth expectations all run through here.
2) USD conditions (DXY proxy or your most tradable USD pairs)
Not because the USD is always “safe haven,” but because it’s the funding layer under everything. In true stress, you’ll see broad USD strength; in “headline stress,” you often won’t.
3) Gold
Gold is not “up on fear” by default, its fear filtered through USD and real yields. If USD funding stress ramps up, gold can be pulled in different directions and this is why traders get whipsawed: they trade the story, not the cross-currents.
4) A volatility gauge (execution risk, not ideology)
This can help gauge whether conditions may lead to wider spreads, slippage or faster moves.
5) The instrument you actually trade
For a lot of CFD traders, this is where the Iran shock becomes your problem in the form of local markets and local positioning and USD pairs.
Don’t map by habit, map by driver
- Energy flow risk? Oil first, then risk indices, then FX linked to risk/commodities.
- Funding stress? USD conditions first, then JPY crosses, then equities.
- Policy shock? Watch oil + USD together—policy can tighten both simultaneously.
Translation: For some traders, focus comes from watching fewer markets that are most relevant to the driver they’re assessing.
Step 3. Check the charts that matter
Before considering any trade setup, some traders do a quick ‘triage’ check. The aim isn’t prediction, it’s checking whether fast markets could mean wider spreads, slippage or sharper moves in leveraged products like CFDs.
Chart A: Oil
What you’re checking: Is the market pricing real disruption risk, or just reacting? In Iran-related flare-ups, “Hormuz risk” narratives tend to show up as a risk premium conversation in oil, often faster than it shows up in equities or FX.
Examples of chart features some traders look at include
- Is price breaking and holding above a prior structure level? (Not just spiking).
- Did it gap and then fill? (Often means headline heat > real constraint).
- Is the move continuing during liquid sessions, or only during thin hours? (Thin-hours moves are where CFD spreads can punish you the most).
Translation: Oil indicates whether the Iran story may become an inflation/flow story or just a screen-flash.
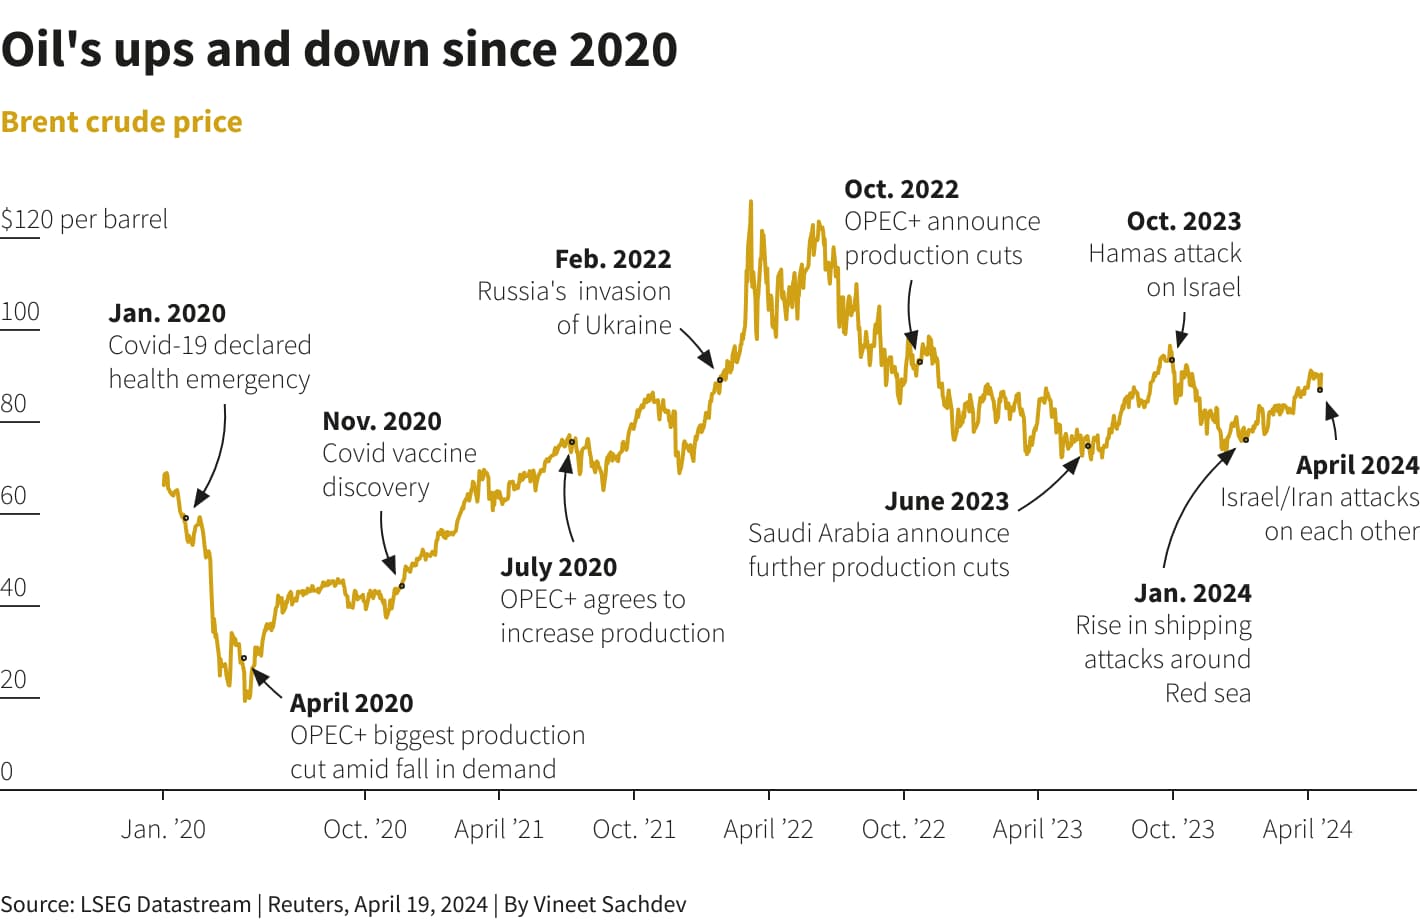
Chart B: USD
What you’re checking: Is this turning into a funding event? The USD doesn’t “safe-haven” on schedule. In some episodes of severe global funding stress, the USD has strengthened broadly and persistently, although this isn’t consistent across all headline-driven spikes.
Practical CFD filters:
- Broad USD strength across multiple pairs (not just one cross doing something weird).
- Commodity FX vs USD (AUD, CAD proxies) behaving like risk is truly tightening.
- JPY crosses as a stress indicator (carry unwind tells the truth quickly).
If USD is not confirming, that’s information. It often means: headline risk is loud, but global liquidity isn’t actually panicking.
Translation: USD indicates whether the Iran headline is “market stress”… or “market noise with wider spreads and higher execution risk.”
Chart C: Volatility
What you’re checking: How dangerous normal sizing has become.
Use a sizing governor that forces honesty:
- Normal ranges → normal size
- ~1.5× typical range expansion → consider half size
- ~2× range expansion → quarter size or stand aside
Some traders reduce position size or choose not to trade when ranges expand materially versus usual conditions. Any sizing approach depends on individual circumstances and risk tolerance.
Because in CFDs, volatility doesn’t just change directionality, it changes execution quality, stop distance, and how fast a loss becomes a margin problem.
Translation: Volatility is your permission slip or your stop sign.

Step 4. Choose a setup type
Geopolitics creates volatility but it doesm't guarantee trend.
Pick structure, not opinion
- Breakout: after the market forms a post-headline range.
- Pullback: once trend is established and liquidity steadies.
- Mean reversion: only if the spike stalls and structure confirms.
Common mistake: picking direction first, then hunting confirmation.
Translation: The setup is the response to price behaviour, not your worldview.
Step 5. Define risk
From a general risk-management perspective, traders often define that a trade idea is not complete until it has
- Entry condition: what must happen for you to participate
- Invalidation: where you are wrong
- Position size: based on dollars-at-risk, not conviction
- Session max loss: daily or weekly cap (protects you from spiral trading)
For CFDs specifically, regulators emphasise how leverage can accelerate losses, and why protections such as margin close-out arrangements, leverage limits and negative balance protection (where applicable) exist.