
GO Markets,让交易更进一步
智慧交易,从选择值得信赖的全球券商开始。低点差、快速成交、零入金手续费、功能强大的交易平台,以及屡获殊荣的客户支持,让您的交易更进一步
二十年稳健实力,成就值得信赖。
二十年专注打造极致交易体验。
自2006年起,致力缔造卓越的交易环境。
初学者
新手上路?
从基础知识入手,循序渐进,逐步建立交易信心。
中级交易者
让策略更进一步
使用先进的交易工具,获取更深入的市场洞察。
专业交易者
专业交易者专区
为专业投资者与高净值客户提供量身定制的专属服务。
每笔交易,尽享超值回馈
即刻查看我们的限时优惠

开始使用 GO Markets
无论你是市场新手还是全职交易,GO Markets 都有一个
根据您的需求量身定制的账户。

全球交易者共同的选择
自 2006 年起,GO Markets 已帮助全球数十万交易者实现他们的投资目标。凭借严格监管、以客户为本的服务,以及屡获殊荣的教育资源,我们始终是交易者值得信赖的合作伙伴。
*Trustpilot reviews are provided for the GO Markets group of companies and not exclusively for GO Markets Ltd.


*Awards were awarded to GO Markets group of companies and not exclusively to GO Markets Ltd.
探索更多 GO Markets 的产品与服务
差价合约市场
外汇、指数、股票、商品、贵金属、数字货币、ETF 等全品类交易,一站式管理。
交易平台与工具
尖端技术支持、优质客服团队、灵活资金管理,让您的交易更轻松。
学习中心
系统化学习交易技能与策略,培养稳健投资心态,助力长期稳健交易。
账户与定价
对比账户类型、查看点差,选择最适合您交易目标的方案。

GO Markets
让交易更进一步
探索上千种交易机会,享受专业机构水准的交易工具、流畅稳定的交易体验,以及屡获殊荣的客户支持。开户流程简单快捷,让您轻松开启交易之旅。
市场新闻与分析
用专业工具和市场分析助力您的每一步交易决策
波动性不分青红皂白。但它可以惩罚没有做好准备的人。
在几分钟内反向移动时停止被击中。短期期权的溢价攀升。而且日元不再像以前那样作为可靠的对冲工具。
对于亚洲各地的交易者来说,驾驭这种环境意味着就风险、时机以及为市场平静而制定的策略中包含的假设提出更棘手的问题。
1。在地缘政治冲击期间如何交易VIX差价合约?
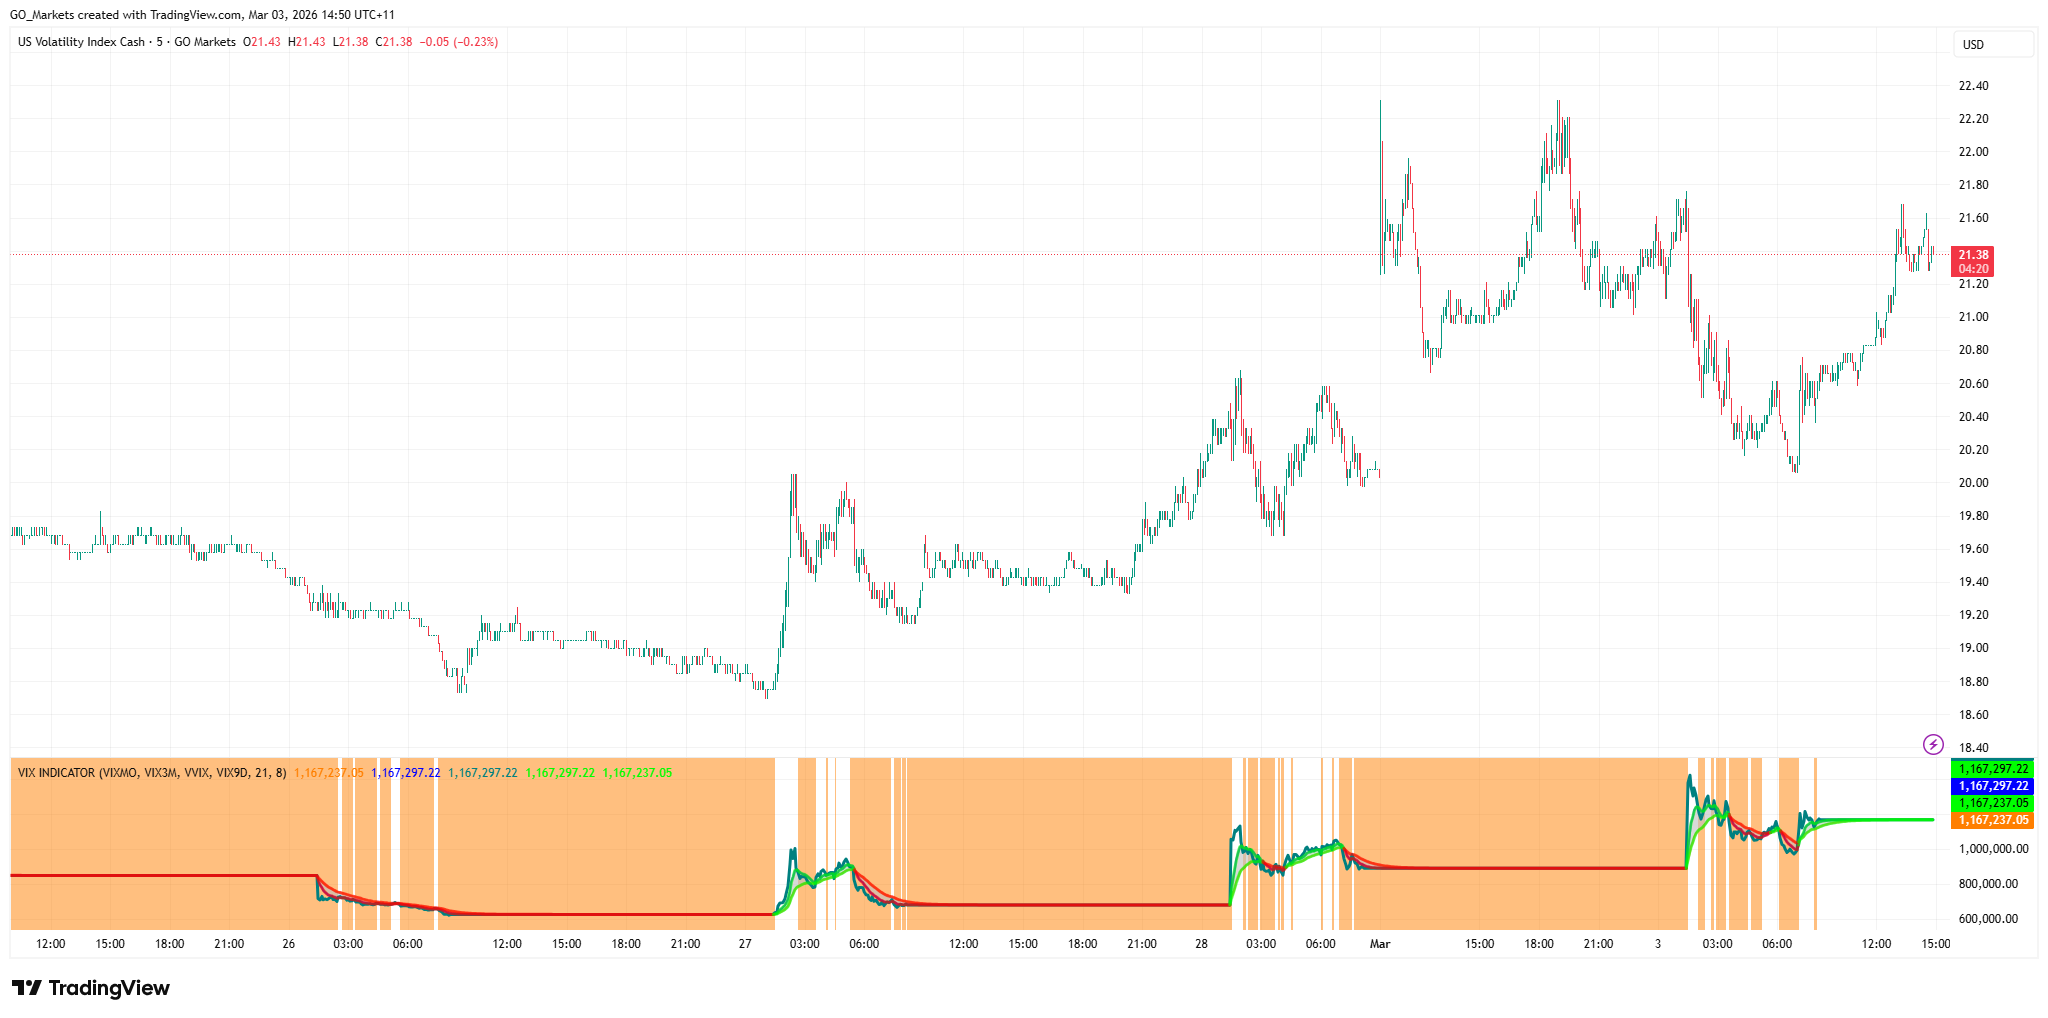
芝加哥期权交易所波动率指数(VIX)衡量了市场对标准普尔500指数30天隐含波动率的预期。它通常被称为 “恐惧指标”。在地缘政治冲击中,例如当前的伊朗升级、制裁公告和央行出人意料的行动,VIX可能会急剧而迅速地飙升。
是什么让 VIX 差价合约在震惊中与众不同
VIX 本身不可直接交易。VIX差价合约通常按VIX期货定价,这意味着它们在正常条件下具有同价拖累。
在地缘政治冲击期间,可能会同时发生几件事
- 现货VIX可能会立即飙升,而短期期货滞后,从而造成脱节。
- 随着流动性的减少,VIX差价合约的点差可能会显著扩大。
- 随着经纪商风险模型的调整,保证金要求可能会在盘中发生变化。
- VIX 在峰值之后往往会恢复均值,因此时机和持续时间至关重要。
这对亚洲时段交易者意味着什么
亚洲市场交易时间意味着许多地缘政治事件可能会在当地交易者活跃或刚刚开始交易时爆发。
在悉尼开盘之前,东京时段发生的冲击可能已经定价到VIX期货中。
一些交易者使用VIX差价合约头寸作为股票投资组合的短期对冲工具,而不是定向交易。其他人则交易回归(一旦最初的飙升消退,就会回到历史平均水平)。两种方法都有不同的风险,都不能保证特定的结果。
2。为什么我现在的0DTE期权保费这么贵?
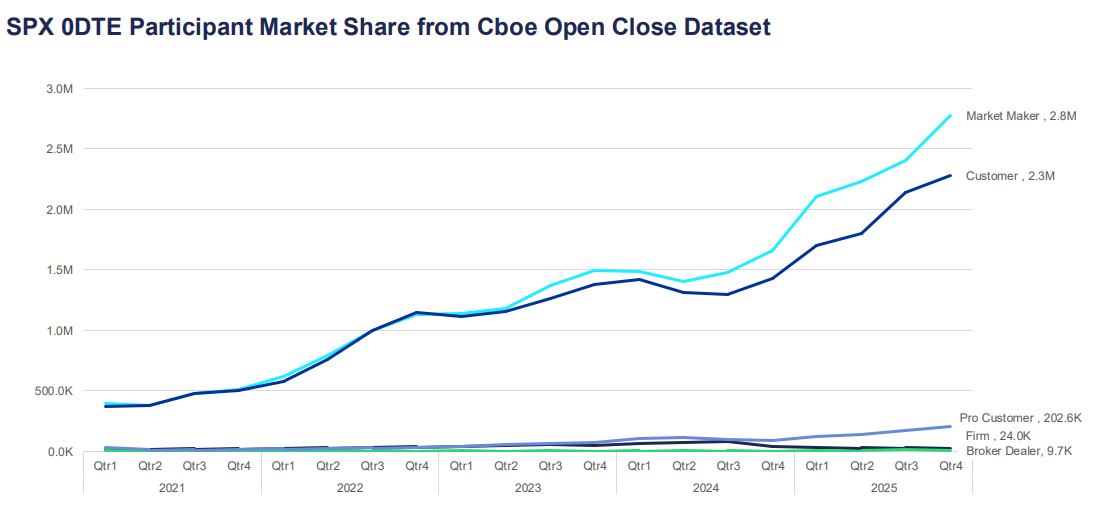
零天到期(0DTE)期权在交易当天到期。根据芝加哥期权交易所全球市场数据,它们已成为期权市场增长最快的细分市场之一,目前占标准普尔500指数期权每日交易量的57%以上。
对于进入美国期权市场的亚洲参与者来说,波动时期的溢价上涨可能感觉像是定价错误,但通常反映了结构性定价因素。
为什么保费飙升
期权定价由内在价值和时间价值驱动。对于0DTE期权,几乎没有剩余的时间价值,这可能表明它们应该便宜,但隐含波动率部分可以弥补这一点。
当不确定性增加时,卖方可能会要求为盘中急剧波动的风险提供更多补偿。
这可以反映在
- 更高的隐含波动率输入。
- 更宽的买卖价差。
- 在 delta 和 gamma 对冲方面进行更快的调整。
在更高的VIX环境中,套期保值流量可能导致标的指数的短期反馈循环。这可能会放大价格波动,尤其是在关键水平附近。
这对亚洲时段交易者意味着什么
许多0DTE期权合约在美国交易时段的定价和套期保值流量最为活跃。在亚洲时段入仓可能意味着面临过时的定价或更大的利差。
如果您看到昂贵的保费,这可能反映出市场对当日大幅波动风险的准确定价。该保费是否值得支付取决于您对可能的盘中区间和风险承受能力的看法,而不仅仅是绝对的美元数字。
3.如何针对高 VIX 环境调整算法交易机器人?
许多算法交易系统都建立在低波动率模式下校准的参数之上。当 VIX 达到峰值时,这些参数很快就会过时。
政权不匹配问题
大多数交易算法使用历史数据来设置头寸规模、止损距离和入场阈值。该数据反映了测试系统的条件。如果 VIX 从 15 升至 35,则支撑这些设置的统计假设可能不再成立。
高 VIX 环境中的常见故障模式包括
- 在预期的定向运动发生之前,由噪声反复触发停止。
- 基于固定美元风险的头寸规模,与实际盘中区间相比,固定美元风险变得相对较小。
- 分解资产之间的相关性假设。
- 执行失误会削弱优势。
一些算法交易者考虑的方法
有些系统没有运行一组固定的参数,而是采用了波动率机制过滤器。这是对VIX或ATR的实时检查,当条件发生变化时,它会触发切换到不同的设置。
一些交易者在高VIX环境中审查的方法调整
- 与 ATR 成比例地扩大停车距离,以减少噪音驱动的出口。
- 缩小头寸规模,以保持相对于更大预期区间的恒定美元风险。
- 添加 VIX 阈值,超过该阈值系统将暂停或进入模拟交易模式。
- 减少同时持仓的数量,因为在市场压力下,相关性往往会上升。
任何调整都无法消除风险。尽管过去的情况并不能作为未来结果的可靠指导,但对历史High-VIX周期的新参数进行回溯测试可以为可能的表现提供一定的指示。
4。日元(JPY)仍然是可靠的避险交易吗?
在全球避险情绪期间,随着投资者放松套利交易并寻求波动率较低的持股,资本历来流入日元。但是,这种动态的可靠性已变得更加有条件了。
为什么日元历来是避风港?
日本历史最低的利率使日元成为套利交易的首选融资货币,当避险情绪来袭时,这些交易会迅速平仓,从而创造对日元的需求。
此外,日本庞大的外国净资产头寸意味着日本投资者倾向于在危机期间汇回资本,进一步支撑日元。
发生了什么变化
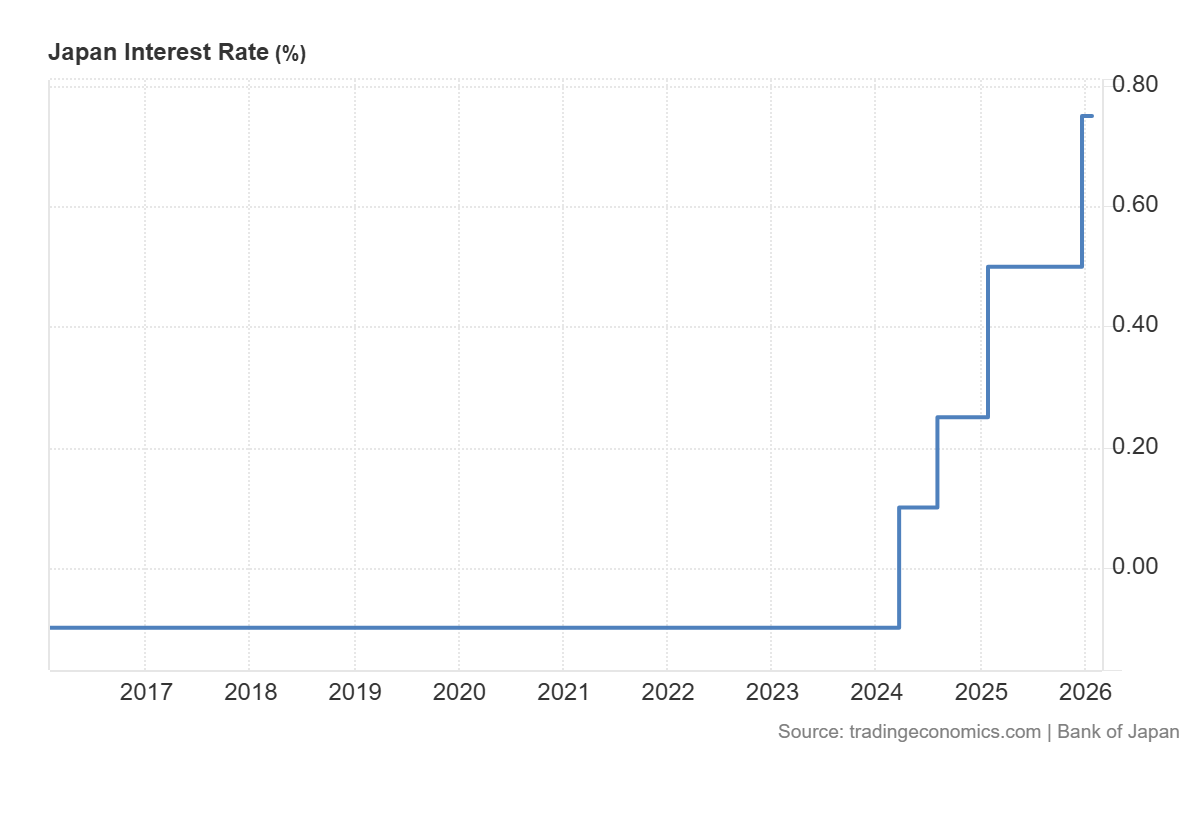
日本央行近年来放弃超宽松的货币政策,这使传统的避险动态变得复杂。
随着日本利率的上升:
- 套利交易头寸的规模可能会发生变化。
- 美元/日元可能对利率利差变得更加敏感。
- 日本央行的通讯和国内通胀数据可能会影响日元,与全球风险偏好无关。
日元仍然可以充当避风港,尤其是在股票大幅抛售期间。但是,与日本与世界其他地区之间的政策分歧更为极端的早期周期相比,它的反应可能更慢或不一致。
要看什么
对于将日元视为避险信号的交易者来说,日本央行的会议日期、日本消费者价格指数的发布以及美日实时利差数据已成为比几年前更重要的输入。
5。如何避免 “炒股” 能源差价合约?
Whipsawing描述了向一个方向进入交易,在价格反转时被强制平仓,然后看着价格向原始方向回移的经历。
能源差价合约,尤其是原油,在动荡的市场中尤其容易出现这种情况。对于亚洲的交易者来说,当地时间流动性薄弱以及对地缘政治头条的敏感性相结合,可能使这变得特别具有挑战性。
为什么能源差价合约大放异彩
原油对各种主要驱动因素很敏感:欧佩克+的生产决策、美国库存数据、地缘政治供应中断和货币走势。
在高波动性的环境中,市场可以对每个标题做出强烈反应,然后在下一个标题到来时逆转。
- 标题价格飙升,空头头寸触发止损。
- 交易者重新进入多头,预计会继续。
- 第二个头条新闻或获利回吐可以逆转这一走势。
- 长途停靠点被击中。循环重复。
交易者可以考虑采用的方法来管理鞭子风险
一些交易者选择在波动条件下更改风险控制(例如,审查与波动率指标相关的止损设置)。但是,这可能会增加损失;在快速市场中,执行和滑点风险可能会急剧上升
一些交易者审查的其他方法:
- 避免在主要预定数据发布前后的30分钟内交易原油差价合约。
- 在进入较短的时间范围之前,使用较长的时间框架图表来确定当前趋势,从而减少与更大的机构资金流进行交易的机会。
- 分阶段扩大仓位,而不是在初次进入时全额投入。
- 监控未平仓合约和交易量,以区分真实参与的走势和低流动性假货。
在动荡的能源市场中,不可能完全消除 Whipsawing。在这种情况下,风险管理的目标不是预测哪些走势将保持不变,而是确保虚假走势的损失小于真正的定向走势时的收益。
亚洲市场波动的实际注意事项
亚洲市场具有结构性特征,与波动的相互作用与美国或欧洲市场不同:
- 当地时段的流动性减少会夸大交易量的波动,尤其是能源和外汇差价合约的走势。
- 中国的事件,包括采购经理人指数的发布、贸易数据和中国人民银行的政策信号,可能会影响区域指数。
- 近年来,日本央行的政策决策已成为日元和日经指数波动的更积极的驱动力。
- 对于无法全天候监控头寸的交易者来说,美国交易日走势产生的隔夜缺口是一种持续的结构性风险。
- 在高VIX时期,杠杆产品的保证金要求可能会在短时间内发生变化。
有关亚洲市场波动的常见问题
高VIX读数对亚洲股票指数意味着什么?
VIX衡量标准普尔500指数的预期波动率,但读数上升通常反映了市场上普遍存在的全球避险情绪。日经225指数、恒生指数和澳大利亚证券交易所200指数等亚洲指数的波动性通常会增加,并且与VIX的急剧上涨呈负相关性。
0DTE 期权可以在亚洲时段交易吗?
访问权限取决于平台和特定工具。美国股票指数0DTE期权在美国交易时段的定价最为活跃。在这些时间以外,亚洲交易者可能会面临更大的点差和更不具代表性的定价。
在高波动性条件下,算法交易策略本质上是否更具风险?
在低波动率时期校准的策略在高 VIX 环境中的表现可能会有所不同。对于任何系统性方法,定期根据当前市场条件审查参数都是明智之举。
日元的避险交易是否发生了永久性变化?
日本央行的政策正常化带来了新的动力,但在一些避险时期,日元继续走强。这可能更多地取决于冲击的性质和日本央行的同步立场。
在高波动性条件下设置能源差价合约止损的最佳方法是什么?
没有普遍的最佳方法。许多交易者参考ATR来根据当前条件调整止损距离,而不是使用固定水平。这并不能保证以期望的价格退出,也不能消除鞭打风险。

波动性有一种不请自来的方式。
有一天,澳大利亚证券交易所正在悄然波动... 第二天,保证金要求上升,止损未达到预期,投资组合开盘时出现令人不安的隔夜缺口。
如果您一直在寻找答案,那么您并不孤单。澳大利亚交易者中一些最常搜索的有关波动性的问题与追加保证金、滑点、隔夜缺口、杠杆交易所交易基金(ETF)以及平均真实区间(ATR)等工具有关。
以下是正在发生的事情。
为什么现在这很重要
全球市场对利率、通货膨胀数据、地缘政治和技术驱动的流动变得更加敏感。当流动性减少和不确定性增加时,价格波动就会扩大。那就是波动性。
波动性不仅会影响价格方向,还会改变交易的执行方式、需要多少资本以及表面之下的风险表现。
翻译:波动性不仅仅是更大的波动,而是更快的走势和更少的流动性——那是交易机制最重要的时候。
想要真实世界的波动率案例研究吗?
为什么我的经纪人提高了保证金要求?
关于波动率的搜索最多的问题之一是为什么保证金要求在没有警告的情况下增加。
当市场变得不稳定时,经纪商可能会提高差价合约(CFD)和其他杠杆产品的保证金要求。较大的价格波动会增加账户转为负资产的风险,因此提高保证金要求会降低可用杠杆率,并有助于在极端条件下管理风险敞口。
这在实践中可能意味着什么
-即使价格没有显著变动,也可能会出现追加保证金的情况。
-有效杠杆率可能会迅速下降。
-可能需要在短时间内减少职位。
保证金调整通常是对不断变化的市场风险的回应,而不是随机决定。在高度波动的市场中,谨慎的做法是假设保证金设置可以迅速变化,因此,许多交易者选择根据这种风险来审查头寸规模和可用缓冲区。
什么是滑点?为什么我的止损没有按我的价格成交?
另一个经常搜索的话题是滑点。
当止损单触发并以下一个可用价格执行时,可能会发生滑点,结果可能取决于订单类型、市场流动性和缺口。在平静的市场中,差异可能很小,而在快速市场中,价格可能会跳出止损水平。
常见的驱动程序包括
-主要经济或财报发布。
-流动性薄弱。
-拥挤的停车位。
-通宵会议。
止损订单通常优先执行而不是价格确定性,在高波动时期,这种区别变得很重要。根据典型的价格走势调整头寸规模和设置止损可能比在不稳定条件下简单地收紧止损更有效。
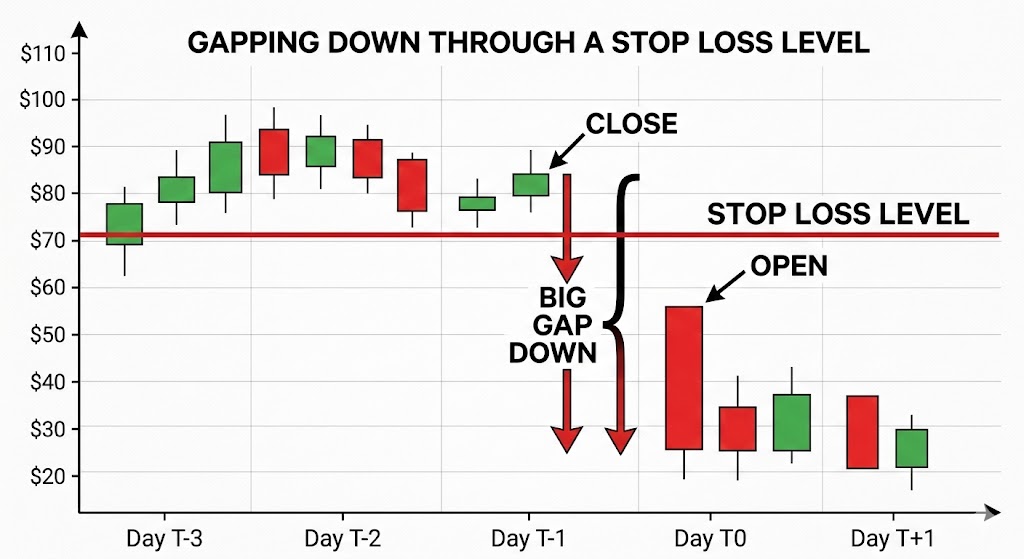
如何管理澳大利亚证券交易所的隔夜差距?
澳大利亚在美国沉睡的时候进行贸易,反之亦然。遗憾的是,这种时区差异是澳大利亚交易者经常寻找隔夜缺口风险的原因之一。如果美国市场大幅下跌,澳大利亚证券交易所可能会在第二天早上开盘走低,在收盘和开盘之间没有机会退出。
市场交易者可能使用的风险管理方法的示例包括
-使用澳大利亚证券交易所200指数期货或差价合约*进行指数套期保值。
-在高风险事件期间进行部分对冲。
-在重大宏观公告发布之前减少风险敞口。
套期保值可以抵消部分走势,但会带来基础风险,因为个别股票的走势可能与整体指数不一致。
没有完美的保护,只有在成本、复杂性和风险降低之间进行权衡。
*差价合约是复杂的工具,由于杠杆作用,存在很高的亏损风险。
在波动的市场中,杠杆或反向ETF的主要风险是什么?
在波动性加剧的时期,通常会搜索杠杆和反向ETF。
虽然这些产品通常每天重置,但它们的目标是提供该指数每日回报的倍数,而不是其长期回报。在波动的横盘行情中,即使指数收盘价接近起始水平,每日复利也可能侵蚀价值。
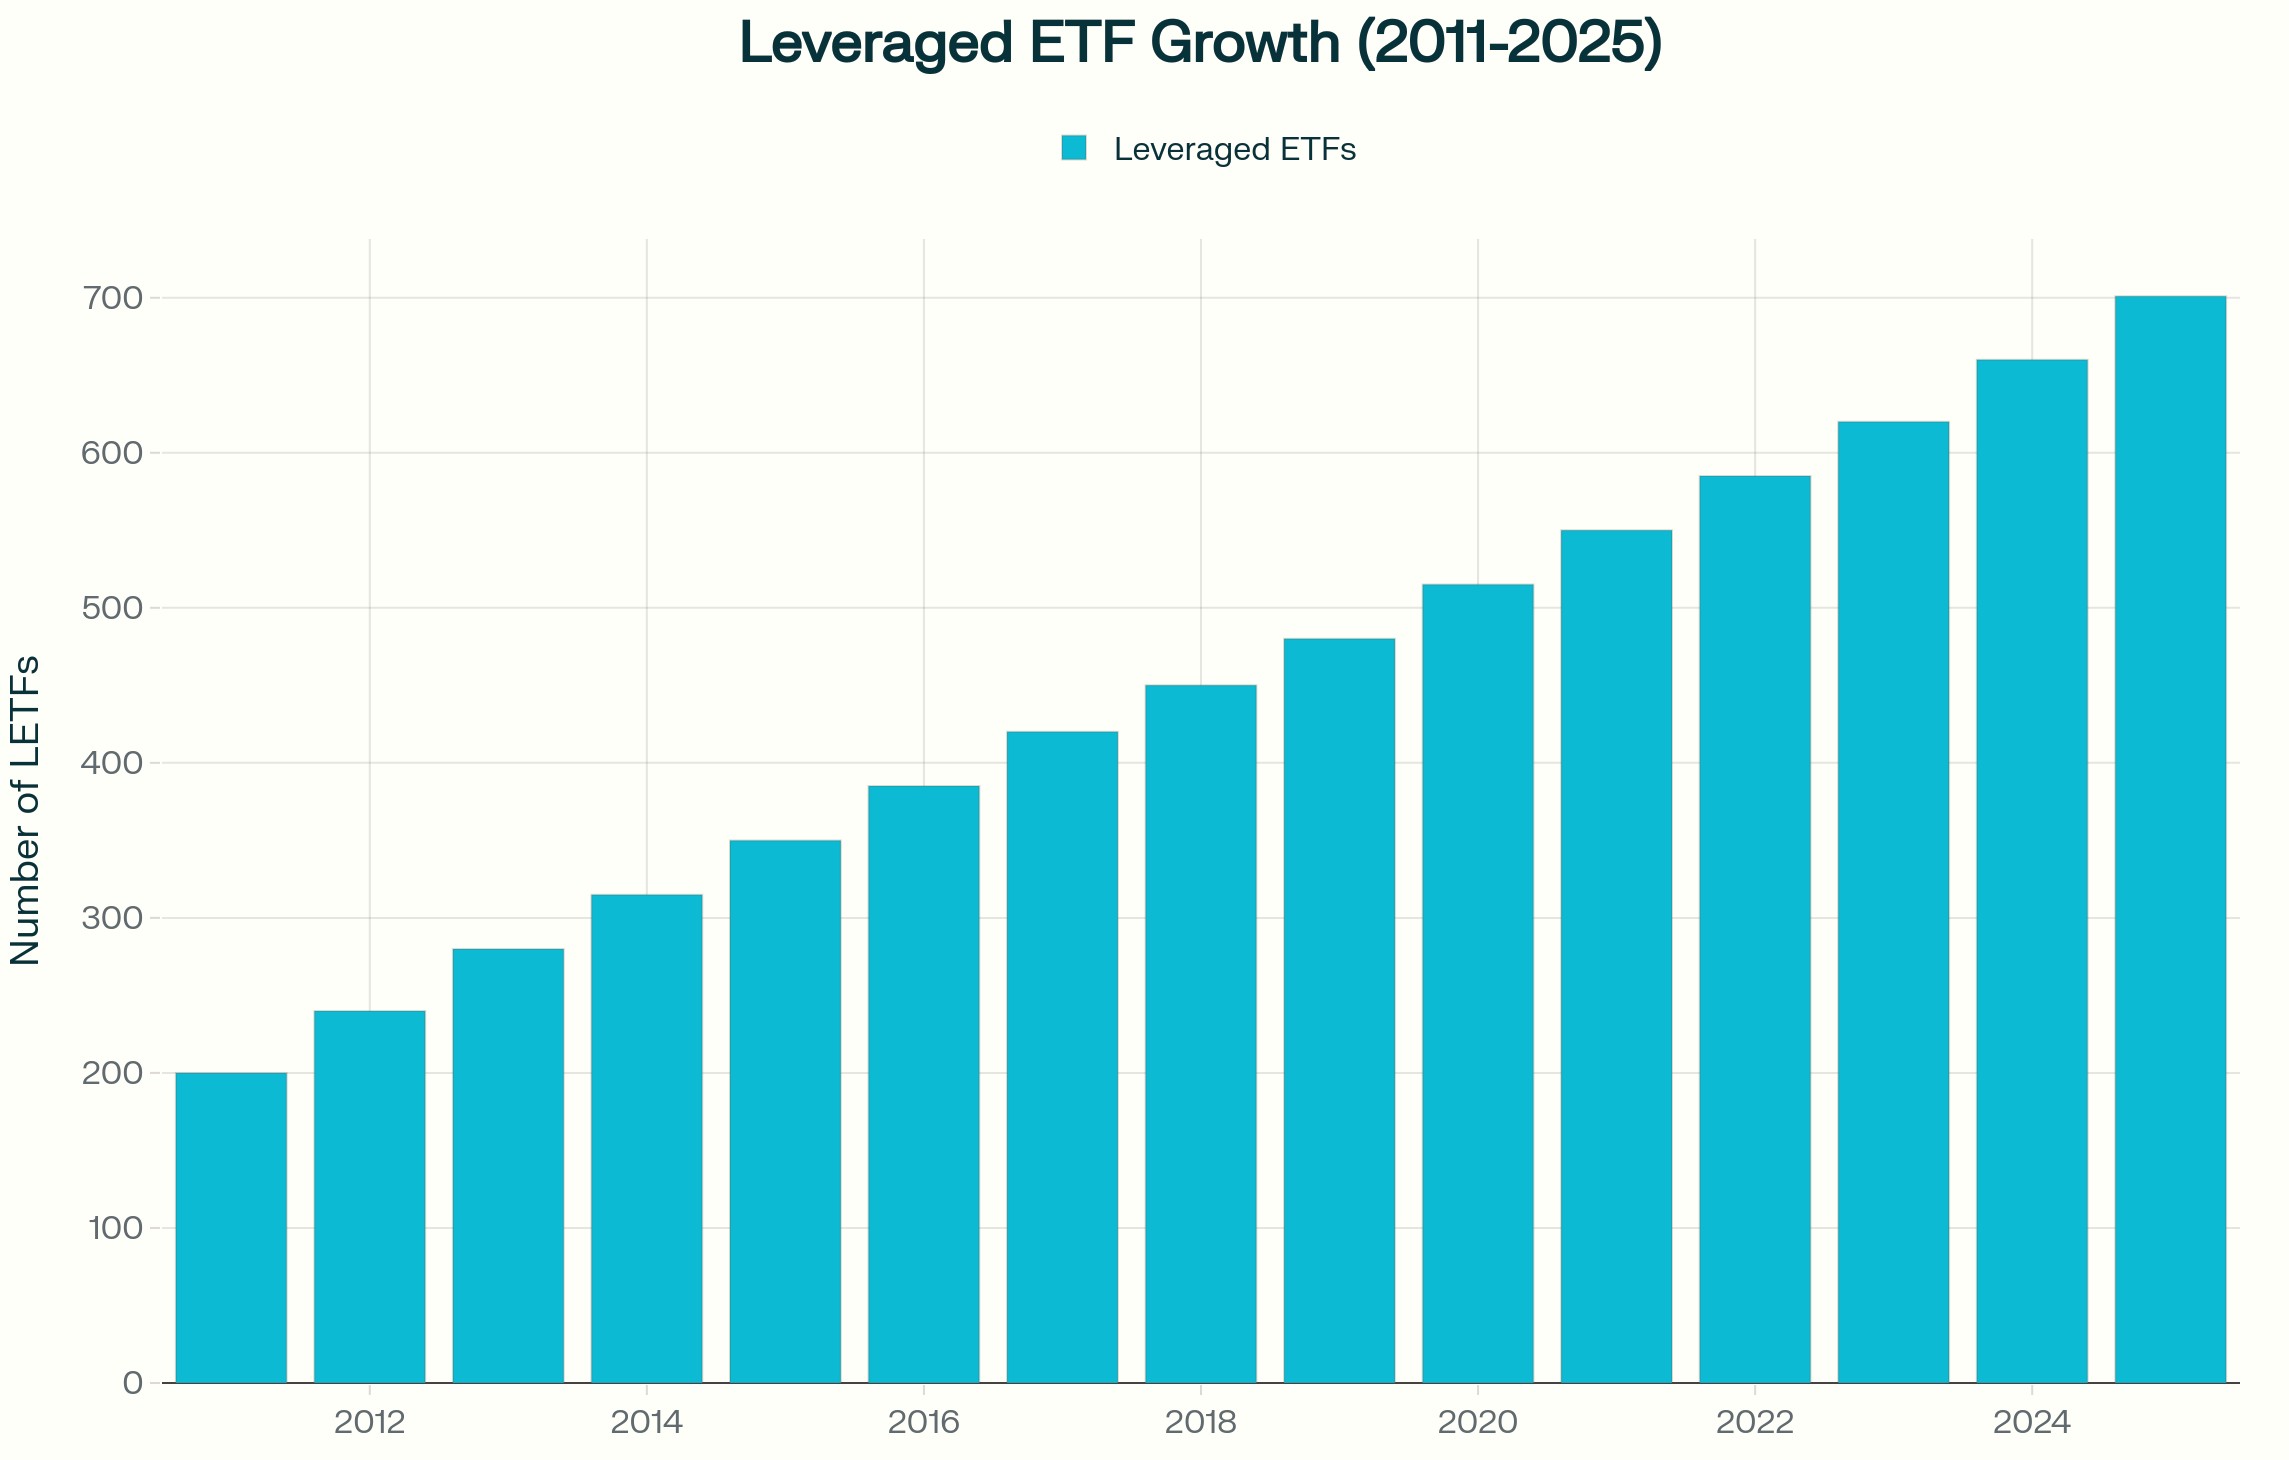
之所以发生这种情况,是因为收益和损失不对称地复合。下降10%需要超过10%的收益才能恢复。当这种影响每天成倍增长时,随着时间的推移,结果可能会与基础指数出现重大差异。
一些市场参与者可能会在战术上使用此类工具。它们通常不是作为长期对冲工具设计的,在将它们用于策略之前,了解它们的结构至关重要。
如何使用 ATR 为止损位置提供信息?
平均真实波动范围(ATR)是衡量波动率的常用指标。
ATR 估算资产在给定时期内通常会有多少波动,包括缺口。一些交易者没有将止损设置为任意百分比,而是参考ATR并将止损设置为倍数,例如ATR的两到三倍,以反映当前情况。
当波动率上升时,ATR 会扩大,如果要保持总体风险不变,这可能意味着更大的止损或更小的头寸规模。这种转变不是问:“我愿意输多远?”改为问:“在当前条件下,正常的举动是什么?”
波动市场中的实际注意事项
在波动性加剧的时期,交易者可以考虑
- 考虑到保证金变动的可能性
- 如果波动率增加,则保守地调整头寸
- 认识到止损单并不能保证特定的退出价格
- 在重大经济事件发生之前审查风险敞口
- 了解杠杆ETF的每日重置机制
- 使用诸如ATR之类的波动率指标来为止损设置提供信息
- 保持足够的现金缓冲区
波动率并不能仅奖励预测。准备和风险意识可以帮助交易者了解潜在的风险,但结果仍然不可预测。
阅读:全球波动性以及如何交易差价合约
这对澳大利亚交易者意味着什么
与亚洲和美国市场相比,澳大利亚市场面临着特定的结构性考虑。隔夜缺口风险受美国交易时间的影响,澳大利亚证券交易所等资源密集型指数可以快速应对大宗商品价格走势和来自中国的数据。货币敞口,包括澳元和美元(USD)的走势,可能会增加另一层波动性。
各地区的波动性并不均匀。根据市场结构和流动性深度,它的行为会有所不同。
有关波动率的常见问题
是什么原因导致市场波动突然飙升?
利率决定、通货膨胀数据、地缘政治发展、盈利意外和流动性限制是常见的触发因素。
为什么经纪人在动荡的市场中增加利润?
减少杠杆风险敞口并在价格波动扩大时管理风险。
在波动期间,止损订单会失败吗?
如果市场跳空超过止损水平,他们可能会出现下滑,这意味着执行的价格可能低于预期。在快速或流动性不足的市场中,这种差异可能很大。
杠杆ETF适合长期对冲吗?
由于每日重置,它们通常是针对短期风险敞口而设计的。它们是否合适取决于您的目标、财务状况和风险承受能力。
在进行交易之前如何衡量波动率?
ATR、隐含波动率指标和历史区间分析等工具可以帮助量化当前状况。
风险警告:波动加剧的时期可能导致价格快速变动、利润率变化以及以不同于预期的价格执行。止损订单和波动率指标等风险管理工具可能有助于评估市场状况,但不能消除损失风险,尤其是在使用杠杆产品时。

很少有机构能像澳大利亚储备银行(RBA)那样安静或有力地塑造澳大利亚的日常生活。
每当你续订抵押贷款、开立储蓄账户或观察澳元走势时,澳洲联储的决定都在后台。
但是,银行内部到底发生了什么,是什么推动了席卷整个澳大利亚经济的呼声?
事实速览
- 澳洲联储的现金利率是澳大利亚金融界最受关注的数字。
- 费率决定 由九名成员组成的董事会每年八次制定。
- 澳洲联储的目标是随着时间的推移平均通货膨胀率为2-3%。
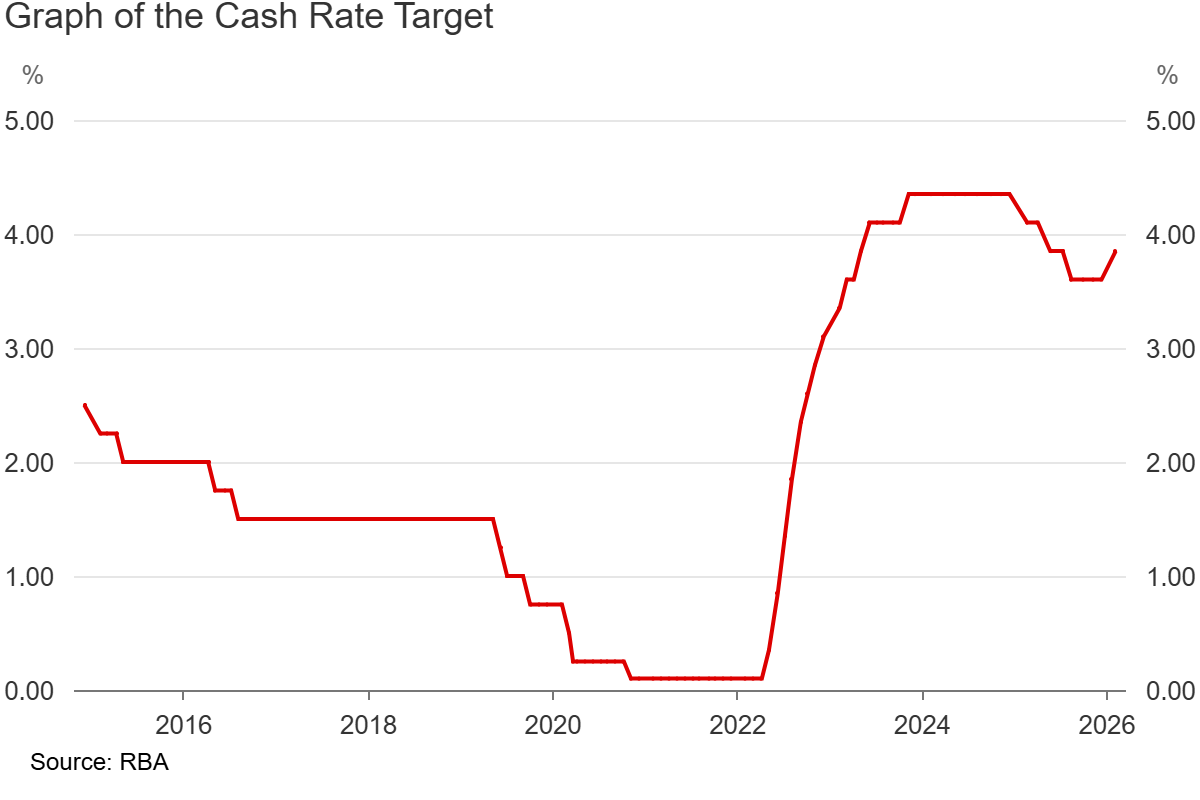
- 2023年11月,澳大利亚的现金利率达到了 4.35% 的12年高点。
什么是澳洲联储?
澳大利亚央行是澳大利亚的中央银行。与向个人和企业贷款的商业银行不同,澳大利亚央行向金融机构贷款,发行国家货币并充当政府的银行家。
它还在监督更广泛的金融体系的稳定方面发挥着作用。它可以在经济压力时期介入,确保信贷持续流动。
对于普通澳大利亚人来说,澳洲联储对利率的影响最为明显。通过设定现金利率目标,它可以塑造整个经济的借贷和储蓄成本。
这种影响可以渗透到抵押贷款利率、商业贷款和澳元的价格。
现金利率如何运作?
现金利率是澳大利亚央行对银行间隔夜贷款收取的利率。银行不断相互借钱以管理其日常现金需求,而澳洲联储则为这些借贷成本设定了下限。
当澳洲联储提高现金利率时,银行往往会将成本转嫁给借款人;当它降低现金利率时,还款利息往往会下降。
这种连锁反应是现金利率如此强大的工具的原因。银行根据现金利率为产品定价,因此澳大利亚央行0.25%的变动通常会在几周内流向浮动抵押贷款利率。
澳洲联储现金利率变动的影响
澳大利亚抵押贷款中有很大一部分是浮动利率的,因此,与固定利率贷款更为突出的国家相比,现金利率的任何变化往往更快地转移到家庭预算。
澳洲联储如何做出决定?
澳大利亚央行董事会每年举行八次会议,制定货币政策,会议日期提前公布。
该委员会有九名成员:总督、副总督、财政部长和六名外部成员,由财务部长任命,任期五年。决定尽可能以协商一致方式作出,必要时由总督进行决定性投票。
这些成员作出决定的目的是维持物价稳定和支持充分就业,将澳大利亚人民的经济繁荣和福利作为首要目标。
价格稳定通常意味着随着时间的推移,平均通货膨胀率保持在2-3%的目标区间内。“一段时间内的平均值” 框架是经过深思熟虑的;如果通货膨胀率短暂偏离区间外,澳洲联储不会感到恐慌,但任一方向的持续偏差都可能促使董事会考虑政策应对措施。
充分就业是从非加速通货膨胀失业率(NAIRU)的角度来看待充分就业,这是经济在不产生通货膨胀工资压力的情况下可以维持的最低失业率。估计各不相同,但澳大利亚央行历来将其定为4-4.5%左右。
这两个目标之间的紧张关系决定了澳大利亚央行的大多数决策。强劲的劳动力市场对工人来说是个好消息,但它可以推高工资(进而推高通货膨胀)。另一方面,降温通货膨胀通常需要接受失业率的上升。
在每次会议之前,澳洲联储的工作人员准备了涵盖所有主要经济指标的大量简报材料。在做出决定之前,董事会对证据进行了为期两天的辩论。结果将在会议当天澳大利亚东部夏令时间下午 2:30 公开宣布,随后由州长发表详细声明和新闻发布会。
每项决策的关键输入
澳洲联储最近的利率周期
当前的利率周期是澳洲联储现代历史上最激进的周期之一。在COVID疫情期间将现金利率维持在0.10%的历史最低水平之后,澳大利亚央行于2022年5月开始加息,并十三次加息,然后在2023年11月暂停在4.35%。
在2022年5月至2023年底期间,拥有75万美元浮动利率抵押贷款的借款人的每月还款额增加了约1,500美元,至1800美元,这是家庭预算的严重紧缩,直接加剧了澳大利亚央行试图策划的消费者放缓。
在整个2025年,澳洲联储定期将利率下调,在最近于2026年2月加息之后,利率目前为3.75%。
交易者应该注意什么?
每月消费物价指数
对于澳洲联储观察者来说,月度消费者价格指数通常被认为是最重要的单一数据点。如果数据显示 “季度调整后的平均消费者价格指数” 超过3%,则可能会提高人们对加息或推迟削减的预期(尤其是在意外向上行的情况下)。“调整后的均值” 是澳洲联储的首选衡量标准,因为它倾向于减少波动造成的数据噪音。
劳动力数据
劳动力数据包括失业率和就业不足率以及工资增长的数字。澳大利亚央行密切关注这些数字,看是否有任何迹象表明工资的增长速度可能与通货膨胀目标不一致。
州长的讲话和出席
在正式会议之间,州长在众议院经济委员会作证并发表公开演讲。这些都受到严格审查,以了解董事会的情绪信号。例如,简单的语言转变,从 “耐心” 到 “警惕”,通常可以被视为语气的变化,可能会影响即将举行的会议的费率决定。
中性利率
“中性利率” 是澳洲联储认为既不会加速经济增长也不会减缓的现金利率区间。目前的中性现金利率估计约为3.0-3.5%,低于3.75%的实际利率,这表明澳洲联储仍在阻碍经济。随着利率越来越接近中性区域,这可能表明澳洲联储继续削减的紧迫性降低。但是,意外数据总是可以颠覆这一假设。
全球中央银行
澳洲联储不是孤立运作的。如果美联储在更长的时间内维持更高的利率,则在不削弱澳元和通过提高进口价格来导入通货膨胀的情况下,限制了澳洲联储的降息空间。
底线
澳洲联储的工作是保持澳大利亚经济的平衡,而现金利率是其实现这一目标的主要工具。它的决定几乎触及澳大利亚金融生活的每个角落,从抵押贷款的支付到澳元的交易方式。
对于交易者来说,了解澳洲联储的想法和正在关注的事情对于理解更广泛的澳大利亚经济环境大有帮助。