While recent data has shown core inflation moderating, core PCE is on track to average below target at just 1.6% annualised over the past three months.Federal Reserve Chair Jerome Powell made clear that concerns about future inflation, especially from tariffs, remain top of mind.“If you just look backwards at the data, that’s what you would say… but we have to be forward-looking,” Powell said. “We expect a meaningful amount of inflation to arrive in the coming months, and we have to take that into account.”While the economy remains strong enough to buy time, policymakers are closely monitoring how tariff-related costs evolve before shifting policy. Powell also stated that without these forward-looking risks, rates would likely already be closer to the neutral rate, which is a full 100 basis points from current levels.
2. The Unemployment Rate anchor
Powell repeatedly cited the 4.2% unemployment rate during the press conference, mentioning it six times as the primary reason for keeping rates in restrictive territory. At this level, employment is ahead of the neutral rate.“The U.S. economy is in solid shape… job creation is at a healthy level,” Powell added that real wages are rising and participation remains relatively strong. He did, however, acknowledge that uncertainty around tariffs remains a constraint on future employment intentions.If not for a decline in labour force participation in May, the unemployment rate would already be closer to 4.6%. Couple this with the continuing jobless claims ticking up and hiring rates subdued, risks are building around labour market softening.
3. Autumn Meetings are Live
While avoiding firm forward guidance, Powell hinted at a timeline:“It could come quickly. It could not come quickly… We feel like the right thing to do is to be where we are… and just learn more.”This suggests the Fed will remain on hold through the July meeting, using the summer to assess incoming data, particularly whether tariffs meaningfully push inflation higher. If those effects prove limited and unemployment begins to rise, the stage could be set for a rate cut in September.
By
Evan Lucas
Disclaimer: Articles are from GO Markets analysts and contributors and are based on their independent analysis or personal experiences. Views, opinions or trading styles expressed are their own, and should not be taken as either representative of or shared by GO Markets. Advice, if any, is of a ‘general’ nature and not based on your personal objectives, financial situation or needs. Consider how appropriate the advice, if any, is to your objectives, financial situation and needs, before acting on the advice.
For over 110 years, the Federal Reserve (the Fed) has operated at a deliberate distance from the White House and Congress.
It is the only federal agency that doesn’t report to any single branch of government in the way most agencies do, and can implement policy without waiting for political approval.
These policies include interest rate decisions, adjusting the money supply, emergency lending to banks, capital reserve requirements for banks, and determining which financial institutions require heightened oversight.
The Fed can act independently on all these critical economic decisions and more.
But why does the US government enable this? And why is it that nearly every major economy has adopted a similar model for their central bank?
The foundation of Fed independence: the panic of 1907
The Fed was established in 1913 following the Panic of 1907, a major financial crisis. It saw major banks collapse, the stock market drop nearly 50%, and credit markets freeze across the country.
At the time, the US had no central authority to inject liquidity into the banking system during emergencies or to prevent cascading bank failures from toppling the entire economy.
J.P. Morgan personally orchestrated a bailout using his own fortune, highlighting just how fragile the US financial system had become.
The debate that followed revealed that while the US clearly needed a central bank, politicians were objectively seen as poorly positioned to run it.
Previous attempts at central banking had failed partly due to political interference. Presidents and Congress had used monetary policy to serve short-term political goals rather than long-term economic stability.
So it was decided that a stand-alone body responsible for making all major economic decisions would be created. Essentially, the Fed was created because politicians, who face elections and public pressure, couldn’t be relied upon to make unpopular decisions when needed for the long-term economy.
Although the Fed is designed to be an autonomous body, separate from political influence, it still has accountability to the US government (and thereby US voters).
The President is responsible for appointing the Fed Chair and the seven Governors of the Federal Reserve Board, subject to confirmation by the Senate.
Each Governor serves a 14-year term, and the Chair serves a four-year term. The Governors' terms are staggered to prevent any single administration from being able to change the entire board overnight.
Beyond this “main” board, there are twelve regional Federal Reserve Banks that operate across the country. Their presidents are appointed by private-sector boards and approved by the Fed's seven Governors. Five of these presidents vote on interest rates at any given time, alongside the seven Governors.
This creates a decentralised structure where no single person or political party can dictate monetary policy. Changing the Fed's direction requires consensus across multiple appointees from different administrations.
The case for Fed independence: Nixon, Burns, and the inflation hangover
The strongest argument for keeping the Fed independent comes from Nixon’s time as president in the 1970s.
Nixon pressured Fed Chair Arthur Burns to keep interest rates low in the lead-up to the 1972 election. Burns complied, and Nixon won in a landslide. Over the next decade, unemployment and inflation both rose simultaneously (commonly referred to now as “stagflation”).
By the late 1970s, inflation exceeded 13 per cent, Nixon was out of office, and it was time to appoint a new Fed chair.
That new Fed chair was Paul Volcker. And despite public and political pressure to bring down interest rates and reduce unemployment, he pushed the rate up to more than 19 per cent to try to break inflation.
The decision triggered a brutal recession, with unemployment hitting nearly 11 per cent.
But by the mid-1980s, inflation had dropped back into the low single digits.
Pre-Volcker era inflation vs Volcker era inflation | FRED
Volcker stood firm where non-independent politicians would have backflipped in the face of plummeting poll numbers.
The “Volcker era” is now taught as a masterclass in why central banks need independence. The painful medicine worked because the Fed could withstand political backlash that would have broken a less autonomous institution.
Are other central banks independent?
Nearly every major developed economy has an independent central bank. The European Central Bank, Bank of Japan, Bank of England, Bank of Canada, and Reserve Bank of Australia all operate with similar autonomy from their governments as the Fed.
However, there are examples of developed nations that have moved away from independent central banks.
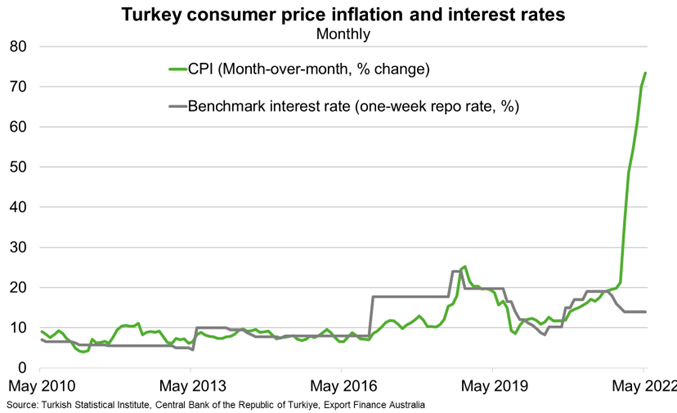
In Turkey, the president forced its central bank to maintain low rates even as inflation soared past 85 per cent. The decision served short-term political goals while devastating the purchasing power of everyday people.
Argentina's recurring economic crises have been exacerbated by monetary policy subordinated to political needs. Venezuela's hyperinflation accelerated after the government asserted greater control over its central bank.
The pattern tends to show that the more control the government has over monetary policy, the more the economy leans toward instability and higher inflation.
Independent central banks may not be perfect, but they have historically outperformed the alternative.
Turkey’s interest rates dropped in 2022 despite inflation skyrocketing
Why do markets care about Fed independence?
Markets generally prefer predictability, and independent central banks make more predictable decisions.
Fed officials often outline how they plan to adjust policy and what their preferred data points are.
Currently, the Consumer Price Index (CPI), Personal Consumption Expenditures (PCE) index, Bureau of Labor Statistics (BLS) monthly jobs reports, and quarterly GDP releases form expectations about the future path of interest rates.
This transparency and predictability help businesses map out investments, banks to set lending rates, and everyday people to plan major financial decisions.
When political influence infiltrates these decisions, it introduces uncertainty. Instead of following predictable patterns based on publicly released data, interest rates can shift based on electoral considerations or political preference, which makes long-term planning more difficult.
The markets react to this uncertainty through stock price volatility, potential bond yield rises, and fluctuating currency values.
The enduring logic
The independence of the Federal Reserve is about recognising that stable money and sustainable growth require institutions capable of making unpopular decisions when economic fundamentals demand them.
Elections will always create pressure for easier monetary conditions. Inflation will always tempt policymakers to delay painful adjustments. And the political calendar will never align perfectly with economic cycles.
Fed independence exists to navigate these eternal tensions, not perfectly, but better than political control has managed throughout history.
That's why this principle, forged in financial panics and refined through successive crises, remains central to how modern economies function. And it's why debates about central bank independence, whenever they arise, touch something fundamental about how democracies can maintain long-term prosperity.
The ASX 200 closed out the 2025 financial year on a high, reaching a new intra-month peak of 8,592 in June and within touching distance of the all-time record. The index delivered a 1.4% total return for the month, rounding off a strong final quarter with a 9.5% return and locking in a full-year gain of 13.8% — its best performance since 2021.This strong finish all came down to the postponement of the Liberation Day tariffs. From the April 7 lows through to the end of the financial year, the ASX followed the rest of the world. Mid-cap stocks were the standout performers, beating both large and small caps as investors sought growth opportunities away from the extremes of the market. Among the sectors, Industrials outperformed Resources, benefiting from more stable earnings and supportive macroeconomic trends tied to infrastructure and logistics.But the clear winner was Financials, which contributed an incredible 921 basis points to the overall index return. CBA was clearly the leader here, dominating everything with 457 basis points on its own. Westpac, NAB, and others also played a role, but nothing even remotely close to CBA. The Industrials and Consumer Discretionary sectors made meaningful contributions, adding 176 and 153 basis points, respectively. While Materials, Healthcare, and Energy all lagged, each detracting around 45 to 49 basis points. Looking at the final quarter of the financial year, Financials were by far the biggest player again, adding 524 basis points — more than half the quarter’s total return of 9.5%. Apart from a slight drag from the Materials sector, all other parts of the market made positive contributions. Real Estate, Technology, and Consumer Discretionary followed behind as key drivers. Once again, CBA was the largest individual contributor, adding 243 basis points in the quarter, while NAB, WBC, and Macquarie Group added a combined 384 basis points. On the other side of the ledger, key underperformers included BHP, CSL, Rio Tinto, Treasury Wine Estates, and IDP Education, which all weighed on quarterly performance.One of the most defining features of the 2025 financial year was the dominance of price momentum as a market driver — something we as traders must be aware of. Momentum strategies far outpaced more traditional, fundamental-based approaches such as Growth, Value, and Quality. The most effective signal was a nine-month momentum measure (less the most recent month), which delivered a 31.2% long-short return. The more commonly used 12-month price momentum factor was also highly effective, returning 23.6%. By contrast, short-term reversals buying last month’s losers and selling last month’s winners was the worst-performing approach, with a negative 16.4% return. Compared to the rest of the world, the Australian market was one of the strongest trades for momentum globally, well ahead of both the US and Europe, despite its relatively slow overall performance.Note: these strategies are prone to reversal, and in the early days of the new financial year, there has been a notable shift away from momentum-based trading to other areas. Now is probably too early to say whether this marks a sustained change, but it cannot be ignored, and caution is always advised.The second big story of FY26 will be CBA. CBA’s growing influence was a key story of FY25. Its weight in the index rose by an average of 2.1 percentage points across the year, reaching an average of 11.5% by June. That helped push the spread between the Financials and Resources sectors to 15.8 percentage points — the widest gap since 2018. Despite the strong cash returns, market valuations are eye-watering; at one point during June, CBA became the world’s most expensive bank on price metrics. The forward price-to-earnings multiple now sits at 18.9 times. This is well above the long-term average of 14.7 and higher than the 10-year benchmark of 16.1. Meanwhile, the dividend yield has slipped to 3.4%, down from the historical average of 4.4%. Earnings momentum remains soft, with FY25 growth estimates still tracking at 1.4%, and FY26 forecast at a moderate 5.4%. This suggests that recent gains have come more from expanding valuation multiples than from actual earnings upgrades, making the August reporting date a catalyst day for it and, by its size, the market as a whole.On the macro front, attention now turns to the Reserve Bank of Australia. The central bank cut the cash rate by 25 basis points to 3.6% at its July meeting. Recent commentary from the RBA has taken on a more dovish tone, with benign inflation data and ongoing global uncertainty expected to outweigh the strength of the labour market. The RBA appears to be steering toward a neutral policy stance, and markets will be watching for further signals on how that shift will be managed. Recent economic data has been mixed. May retail sales were weaker than expected, while broader household spending indicators held up slightly better. Building approvals saw a smaller-than-hoped-for bounce, employment remains strong, but productivity is low. Inflation is now at a 3-year low and falling; all this points to underlying support from the RBA’s easing bias both now and into the first half of FY26.As we move into FY26, the key questions are:
Can fundamentals wrestle back control over momentum?
Will earnings growth catch up to price to justify valuations?
How will policy decisions from the RBA and other central banks shape investor sentiment in an ever-volatile world?
While the early signs suggest a possible rotation, the jury is still out on whether this marks a new phase for the Australian market or just a brief pause in the rally that defined FY25.
While recent data has shown core inflation moderating, core PCE is on track to average below target at just 1.6% annualised over the past three months.Federal Reserve Chair Jerome Powell made clear that concerns about future inflation, especially from tariffs, remain top of mind.“If you just look backwards at the data, that’s what you would say… but we have to be forward-looking,” Powell said. “We expect a meaningful amount of inflation to arrive in the coming months, and we have to take that into account.”While the economy remains strong enough to buy time, policymakers are closely monitoring how tariff-related costs evolve before shifting policy. Powell also stated that without these forward-looking risks, rates would likely already be closer to the neutral rate, which is a full 100 basis points from current levels.
2. The Unemployment Rate anchor
Powell repeatedly cited the 4.2% unemployment rate during the press conference, mentioning it six times as the primary reason for keeping rates in restrictive territory. At this level, employment is ahead of the neutral rate.“The U.S. economy is in solid shape… job creation is at a healthy level,” Powell added that real wages are rising and participation remains relatively strong. He did, however, acknowledge that uncertainty around tariffs remains a constraint on future employment intentions.If not for a decline in labour force participation in May, the unemployment rate would already be closer to 4.6%. Couple this with the continuing jobless claims ticking up and hiring rates subdued, risks are building around labour market softening.
3. Autumn Meetings are Live
While avoiding firm forward guidance, Powell hinted at a timeline:“It could come quickly. It could not come quickly… We feel like the right thing to do is to be where we are… and just learn more.”This suggests the Fed will remain on hold through the July meeting, using the summer to assess incoming data, particularly whether tariffs meaningfully push inflation higher. If those effects prove limited and unemployment begins to rise, the stage could be set for a rate cut in September.
ASX defence stocks are back on more watchlists and according to the Stockholm International Peace Research Institute (SIPRI), global military spending reached approximately US$2.718 trillion in 2024, up 9.4% in real terms.
Australia’s current defence settings are set out in the 2024 National Defence Strategy and related investment planning documents, which outline long-term capability funding priorities. Furthermore, Canberra has pointed to A$330 billion of capability investment through 2034, including added funding for surface combatants, preparedness, long-range strike and autonomous systems.
Here is the part most people miss: not all ASX defence stocks are the same trade. Some sit close to naval shipbuilding. Some are counter-drone names and some are smaller, higher-risk operators where one contract may matter much more than the market assumes.
These five names are not a buy list, rather they are a practical watchlist for investors trying to understand where procurement momentum may actually show up on the ASX.
1) Austal (ASX: ASB)
Austal is one of the ASX-listed companies most directly exposed to Australia’s naval shipbuilding pipeline, although contract execution, margins and delivery timing remain important variables.
They aren't just winning random contracts; they have signed a massive legal agreement (the Strategic Shipbuilding Agreement) that makes them the official partner for building Australia's next generation of mid-sized military ships in Western Australia.
In February 2026, the government gave Austal the green light on a $4 billion project. This isn't for just one ship, it’s for 8 "Landing Craft Heavy" vessels. These are huge transport ships (about 100 metres long) designed to carry heavy tanks and equipment directly onto a beach. But here is the part most people miss, shipbuilding is a marathon, not a sprint.
As you can see in the delivery timeline, while construction starts in 2026, the final ship won't be delivered until 2038. For an investor, this means Austal has a "guaranteed" stream of income for the next 12 years, but they have to be very good at managing their costs over that long period to actually make a profit.
2) DroneShield (ASX: DRO)
If you have seen footage of small drones disrupting modern battlefields, DroneShield is building part of the "off switch". Its focus is counter-drone technology, including systems that detect, disrupt or defeat drones using electronic warfare, sensors and software-led tools, rather than relying only on traditional munitions.
By early 2026, DroneShield had moved beyond the label of a promising start-up and into a much larger commercial phase. It reported FY2025 revenue of A$216.5 million, up 276% from FY2024, and said it started FY2026 with A$103.5 million in committed revenue.
One point the market may overlook is the software layer in the model. DroneShield reported A$11.6 million in Software as a Service (SaaS) revenue in FY2025 and said it is working towards SaaS making up 30% of revenue within five years. Its subscription model includes software updates for deployed systems, which adds a growing stream of recurring revenue alongside hardware sales.
Among ASX defence stocks, DroneShield is one of the most direct ways to follow the counter-UAS theme. It is also one of the names where sentiment can swing quickly, because growth stories can rerate both up and down when order timing changes.
EOS builds both the "brain" and the "muscle" for military platforms. It is best known for remote weapon systems, which allow operators to control armed turrets from inside protected vehicles, and for high-energy laser systems aimed at counter-drone defence. EOS has said its unconditional backlog reached about A$459.1 million in early 2026, following a series of contract wins through 2025. That points to a much larger base of secured work, although delivery timing and revenue conversion still matter.
EOS signed a €71.4 million, about A$125 million, contract with a European customer for a 100-kilowatt high-energy laser weapon system. EOS says the system is designed for a low cost per shot and can engage up to 20 drones a minute. The Australian Government has set aside A$1.3 billion over 10 years for counter-drone capability acquisition, and EOS has disclosed that it was part of a successful LAND 156 bid team. That does not guarantee future revenue, but it does support medium-term visibility in a market the company is already targeting.
EOS reads as a rebound story, but one that still depends on execution. The company has reoriented around remote weapon systems, counter-drone systems and lasers, all areas tied to stronger defence spending. The key question is whether it can keep converting backlog and pipeline into delivered revenue while maintaining balance-sheet discipline.
4) Codan (ASX: CDA)
Codan is sometimes left out of casual defence stock lists because it is more diversified. That may be an oversight. In its H1 FY26 results, Codan said its Communications business designs mission-critical communications for global military and public safety markets. Communications revenue rose 19% to A$221.8 million. The company also said DTC delivered strong growth from defence and unmanned systems demand, with unmanned systems revenue up 68% to A$73 million. Codan said about half of that unmanned revenue was linked to operational defence applications in conflict zones.
This is where the story becomes more nuanced. In a basket of ASX defence stocks, Codan may offer a different profile, with less pure headline sensitivity, broader operating diversification and meaningful exposure to military communications and unmanned systems without being a single-theme name. That diversification may also mean the stock does not always trade like a pure-play defence name.
HighCom sits at the speculative end of this list, and it should be labelled that way. The company says its two continuing businesses are HighCom Armor, which supplies ballistic protection, and HighCom Technology, which supplies and maintains small and medium uncrewed aerial systems, counter-uncrewed aerial systems, and related engineering, integration, maintenance and logistics support for the ADF and other aligned regional militaries.
In H1 FY26, revenue from continuing operations fell 59% to A$10.9 million, while EBITDA moved to a A$5.4 million loss from a A$1.9 million profit a year earlier. HighCom also disclosed A$5.1 million in HighCom Technology revenue, including A$3.5 million from small uncrewed aerial systems (SUAS) spare parts and A$1.6 million from sustainment services provided to the Australian Department of Defence.
So yes, HighCom is one of the more financially sensitive ASX defence stocks on the board. But it is also the kind of smaller name that can show how procurement filters down into support, sustainment and specialist protection gear.
Key market observations
Track program milestones, not just political headlines. Contract awards, manufacturing starts, delivery schedules and sustainment work often matter more than a single announcement day.
Separate pure-play exposure from diversified exposure. DroneShield and EOS are closer to concentrated defence technology themes, while Codan brings communications exposure within a broader business mix.
Watch sovereign capability themes in Australia. Austal and EOS are tied to local manufacturing, integration and Australian supply chains, which supports the broader sovereign capability theme in this group.
Pay attention to balance sheets and cash conversion. Procurement momentum can be real even when timing gets messy. HighCom's latest half is a reminder of that.
Defence headlines can look immediate. Earnings usually are not. Austal's major naval work stretches into the next decade. EOS contracts are delivered over multiple years. DroneShield's order flow appears strong, but the company still separates committed revenue from broader pipeline opportunity. HighCom shows the other side of the coin. Exposure to procurement does not automatically translate into smooth financial execution.
References to ASX-listed defence stocks are general information only, not a recommendation to buy, sell or hold any security or CFD. These stocks can be highly volatile and are sensitive to contract timing, government policy, geopolitics, execution risk and market conditions. Backlog, pipeline and revenue expectations are not guarantees of future performance.
Three central banks are deciding rates simultaneously, Brent crude is swinging wildly around US$100 a barrel, and a war in the Middle East is rewriting the inflation outlook in real time. Whatever happens this week could set the tone for markets for the rest of 2026.
Quick facts
The Reserve Bank of Australia (RBA) announces its next cash rate decision on Tuesday, with markets now pricing a 66% chance of a second hike to 4.1%.
Some analysts have warned the Iran war could push US inflation to 3.5% by year-end and delay Fed rate cuts until September, making this week's FOMC dot plot the most closely watched in years.
Brent crude is flirting with US$100 a barrel after Iran launched what state media described as its "most intense operation since the beginning of the war."
RBA: Will Australia hike again?
The RBA raised the cash rate for the first time in two years to 3.85% at its February meeting after inflation picked up materially in the second half of 2025.
The question now is whether it moves again before even seeing the next quarterly CPI print, which isn't due until 29 April.
Deputy Governor Andrew Hauser acknowledged ahead of the meeting that policymakers face a genuinely divided decision, shaped by conflicting economic signals at home and growing instability abroad.
Financial markets currently assign around a 66% probability to another hike, with a May increase considered virtually certain regardless of what happens Monday.
The FOMC meets on March 17–18, with the policy statement scheduled for 2:00 pm ET on March 18 and Chair Jerome Powell's press conference at 2:30 pm. CME FedWatch shows a 99% probability that the Fed holds rates at 3.50% to 3.75%.
The real action is in the Summary of Economic Projections (SEP) and dot plot. The current median dot shows one 25-basis-point cut for 2026. If it shifts to two cuts, that is dovish and bullish for risk assets. If it shifts to zero cuts or adds a rate hike into the projection, markets could react in the other direction.
Further complicating matters, Powell's term as Federal Reserve Chair expires on May 23, 2026. Kevin Warsh is the leading candidate to replace him, viewed as more hawkish on monetary policy. Any comment from Powell on this transition could move markets independently of the rate decision itself.
Bank of Japan: Further tightening could be brought forward
The BOJ meets on March 18–19, with the decision expected Thursday morning Tokyo time. The current policy rate sits at 0.75% (a 30-year high), and the January 2026 meeting produced a hold in an 8-1 vote.
Governor Ueda has categorised the March meeting as "live," noting the timeline for further tightening could be "brought forward" if Shunto spring wage negotiations yield stronger-than-expected results.
Those results are due to begin flowing in during the week, making them the critical input for the BOJ's decision. Nomura expects 2026 Shunto wage hikes to come in around 5.0%, including seniority, with base pay growth of approximately 3.4%. If results confirm that trajectory, the case for a March hike strengthens considerably.
The complication is the global backdrop. Japan imports roughly 90% of its energy needs, and oil around US$100 per barrel is pushing up import costs and threatening to add inflationary pressure. A BOJ hike into a global oil shock would be an unusually bold move.
Most market participants still lean toward a hold at this meeting, with April or July seen as the more likely timing for the next move.
Brent crude briefly touched US$119.50 per barrel earlier in the week before dropping 17% to below US$80, then rebounding toward US$95 on mixed signals from Washington about the Strait of Hormuz.
As of Thursday, Brent was back over US$100 as Iran launched fresh attacks on commercial shipping and the IEA reserve release failed to bring meaningful relief.
In the scenario where a longer conflict inflicts damage to energy infrastructure, analysts estimate CPI could rise to 3.5% by the end of 2026, with gasoline prices approaching US$5 per gallon in the second quarter.
For this week, oil acts as a macro meta-variable. Every geopolitical headline, ceasefire signal, tanker attack, reserve release, and Trump comment could move equities, bonds and currencies in real time.
US-Israeli strikes on Iran launched on 28 February sent Brent crude surging past US$119 a barrel, gold above US$5,200, and defence stocks to all-time highs.
Against that backdrop, investors are focusing on a small group of commodity-linked names that may remain sensitive to further moves in oil, LNG and gold. The key question is whether the shock proves sustained, or whether a ceasefire, shipping normalisation, or policy action removes part of the geopolitical risk premium.
1. ExxonMobil (NYSE: XOM)
ExxonMobil has been one of the clearest beneficiaries of the price surge. Shares hit a record high of US$159.60 in early March and are up approximately 28% year-to-date.
The company produces 4.7 million barrels of oil equivalent per day, has a Permian Basin breakeven of around US$35/barrel, and is committed to US$20 billion in buybacks for 2026.
Wells Fargo raised its price target to US$183 from US$156 following the escalation, while broader analyst consensus sits around US$140–$144. However, XOM is already trading above many consensus targets, and disruption to its LNG partner QatarEnergy poses a near-term operational headwind.
Chevron touched a new 52-week high of US$196.76 in early March and has risen approximately 24% year-to-date.
The company's Brent breakeven for dividends and capital expenditure sits around US$50/barrel. This means that at current Oil prices above US$90, it is generating significant free cash flow.
However, Chevron has temporarily halted operations at a gas field off Israel's coast following missile activity in the region, and the stock has since pulled back more than 1% as the conflict directly affects its operations.
What to watch
Direct operational updates from Chevron's Middle East and Israeli assets.
Any further halts that could weigh on near-term production.
With Qatar having halted output after Iranian drone strikes, buyers across Asia and Europe are scrambling for alternative supply. Woodside, as one of Australia's largest LNG producers and exporters, sits outside the conflict zone and is well-positioned to benefit from rerouted demand.
Analysts caution that actual substitution takes time due to shipping and contract constraints, meaning the price uplift may be more durable than a simple spot trade. European TTF benchmark gas prices surged over 50% in a week, amplifying the margin environment for non-Middle Eastern LNG producers.
What to watch
The pace and timeline of any Qatar LNG production restart.
If QatarEnergy remains offline for weeks, Woodside could begin re-contracting European buyers at elevated spot prices.
An Australian dollar move higher could be a headwind worth tracking for USD-denominated earnings.
4. Cheniere Energy (NYSE: LNG)
Alongside Woodside, Cheniere is the most direct US beneficiary of the Qatar LNG disruption. As the largest LNG exporter in the United States, it saw intraday strength at the start of the conflict week.
US domestic energy production has buffered American consumers from the worst of the shock, but the export premium has widened as European and Asian buyers pay up for non-Gulf supply.
The trade is "geopolitically sensitive," and any resolution could reverse upside quickly. But for as long as Hormuz and Gulf gas infrastructure remain compromised, Cheniere is positioned to benefit structurally.
What to watch
Any diplomatic breakthrough that reopens Gulf shipping lanes.
Announcements of new long-term offtake contracts signed at current elevated prices.
Gold surged 5.2% in a single session on 1 March, touching US$5,246/oz, as markets sought safe-haven assets. Newmont, the world's largest gold producer, has seen its reserves effectively revalued at these prices.
It is up alongside gold's 24% year-to-date gain, and its all-in sustaining costs remain largely fixed.
However, Gold miners sold off sharply on 4 March, and Newmont fell nearly 8% in a single session as broader risk-off deleveraging hit precious metals equities.
The stock has recovered since, but volatility remains high. For longer-duration investors, analysts note that "safe" mining jurisdictions such as Canada, Australia, and Nevada are commanding fresh premiums as Middle East instability raises the value of geopolitically secure supply.
What to watch
Whether gold can hold above US$5,000/oz.
A prolonged conflict could accelerate an M&A cycle in junior gold miners.
A ceasefire or broad equity deleveraging event as the primary risk to monitor.
Lockheed Martin reached a new all-time high of US$676.70 on 3 March, up over 4% for the day. Its F-35 fighters, precision-guided munitions, THAAD systems, and HIMARS rocket artillery are central to the ongoing air campaign.
The US Department of Defence is moving to replenish munitions stockpiles, and Trump's stated ambition to raise the US defence budget to US$1.5 trillion by 2027 adds a longer-term structural tailwind beyond the immediate conflict.
Defence stocks are rising amid classic geopolitical risk pricing, but investors should note that actual contract flow takes time to translate into earnings, and valuations already reflect considerable optimism.
What to watch
The pace of US Department of Defence munitions replenishment orders.
How quickly contract wins translate into backlog growth.
Barrick is tracking gold's historic run alongside Newmont, with the stock up sharply year-to-date. It sits at a roughly US$78 billion market capitalisation and is reporting record free cash flow projections as its all-in sustaining costs remain well below current spot prices.
Like Newmont, it experienced a sharp single-session selloff of more than 8% during the broader 4 March deleveraging event, before partially recovering.
Royalty and streaming companies such as Wheaton Precious Metals (WPM) are being favoured by some investors as a more inflation-protected way to access gold upside, given their lower operational cost exposure. But Barrick remains one of the world’s largest listed gold miners, with earnings that are highly sensitive to changes in the gold price
What to watch
Gold's ability to hold above US$5,000/oz.
Any Barrick moves toward junior miner acquisitions.
Energy cost inflation, as rising fuel prices could begin to squeeze miner operating margins.