

The Olympic and Winter Olympic Games capture global attention for weeks, drawing millions of viewers and dominating headlines. For traders, this attention often feels like a catalyst, yet the real market drivers remain the same: macroeconomics, policy, and global risk sentiment, not the sporting calendar.
So why do some traders say results feel weaker during major sporting events?
Often it comes down to a failure to adapt to conditions that can shift at the margin, particularly liquidity and participation.
1. Expecting “event volatility”
A major global event can create an assumption that markets should move more. Some traders position for breakouts or increase risk in anticipation of bigger swings, even when conditions don’t support it.
Key drivers
- In some markets and sessions, reduced participation can weaken trend follow-through
- Sentiment can inflate expectations beyond what price action delivers
Example: A trader expects a breakout during the Olympic opening ceremony period, but low regional participation limits price movement, leading to false starts.
2. Forcing trades in quiet sessions
When price action is slower and ranges compress, some traders feel pressure to stay active and take lower-quality entries.
Key drivers
- Narrow intraday ranges can increase false signals
- Lower conviction can favour consolidation over trend, raising false-break risk
- “Staying engaged” can reduce selectivity
Takeaway: Use quieter sessions to refine setups or review data rather than forcing marginal trades.
3. Ignoring thinner liquidity
Participation can ease slightly during major global events, and the impact is often more pronounced on shorter timeframes. Daily charts may look normal, while intraday price action becomes choppier with more wicks.
Key drivers
- In lower-depth conditions, price can jump more easily, and wick size can increase
- In some instruments and sessions, thinner liquidity can coincide with wider spreads and more variable execution (varies by market, venue and broker conditions)
Timeframe sensitivity to thinner conditions
The above table is illustrative only (varies by market): Daily charts may look normal. Five-minute charts can feel more erratic.
Low volume big wicks example
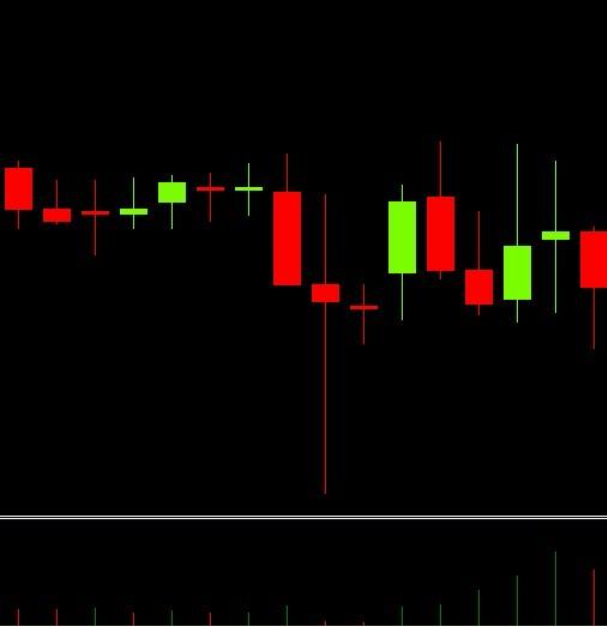
4. Using normal size in abnormal conditions
Even if overall volatility looks stable, execution risk can rise when liquidity thins, especially for short-term or scalping-style approaches.
Key drivers
- Slippage can increase, and stops may “overshoot”
- Thin conditions can trigger stops more easily in noise
- Wider spreads can shift entry/exit outcomes versus normal conditions
Adjustment: Maintaining fixed sizing may distort effective risk. Some traders review transaction costs, including spreads, and execution conditions when setting risk parameters such as stops/limits, particularly in thinner sessions.
5. Trading breakouts with low follow-through
Trend-following tactics can falter when participation declines. Momentum may dissipate quickly, and false breaks become more common.
Key drivers
- Reduced flow can limit sustained directional moves
- Some low-liquidity regimes may favour mean reversion over momentum
Example: A classic range breakout appears valid intraday but fades rapidly as follow-through volume fails to materialise.
Failed breakout example
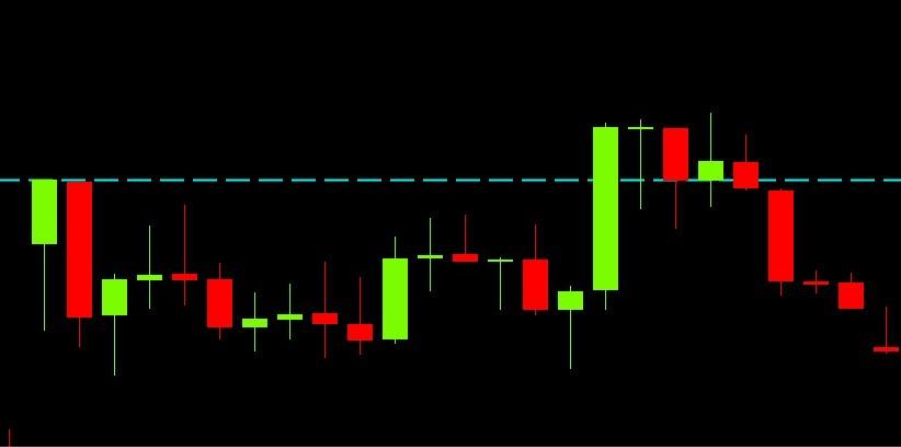
6. Overlooking timing and distraction risk
There is no reliable evidence that the Olympic calendar predictably drives geopolitical events. But when tensions are already elevated, major global events can sometimes coincide with attention being spread elsewhere, somewhat similar to holidays, elections or major summits.
Traders should identify when conditions are slower or thinner and adjust accordingly, aligning tactics with reduced follow-through risk and calibrating position sizes to execution reality. Most importantly, avoid forcing trades when edge is limited during these periods.
Upcming economic events

Disclaimer: Articles are from GO Markets analysts and contributors and are based on their independent analysis or personal experiences. Views, opinions or trading styles expressed are their own, and should not be taken as either representative of or shared by GO Markets. Advice, if any, is of a ‘general’ nature and not based on your personal objectives, financial situation or needs. Consider how appropriate the advice, if any, is to your objectives, financial situation and needs, before acting on the advice. If the advice relates to acquiring a particular financial product, you should obtain our Disclosure Statement (DS) and other legal documents available on our website for that product before making any decisions.


.jpeg)
