Indices Trading – What are Indices and how to use CFDs to trade them
Lachlan Meakin
22/9/2023
•
0 min read
Share this post
Copy URL
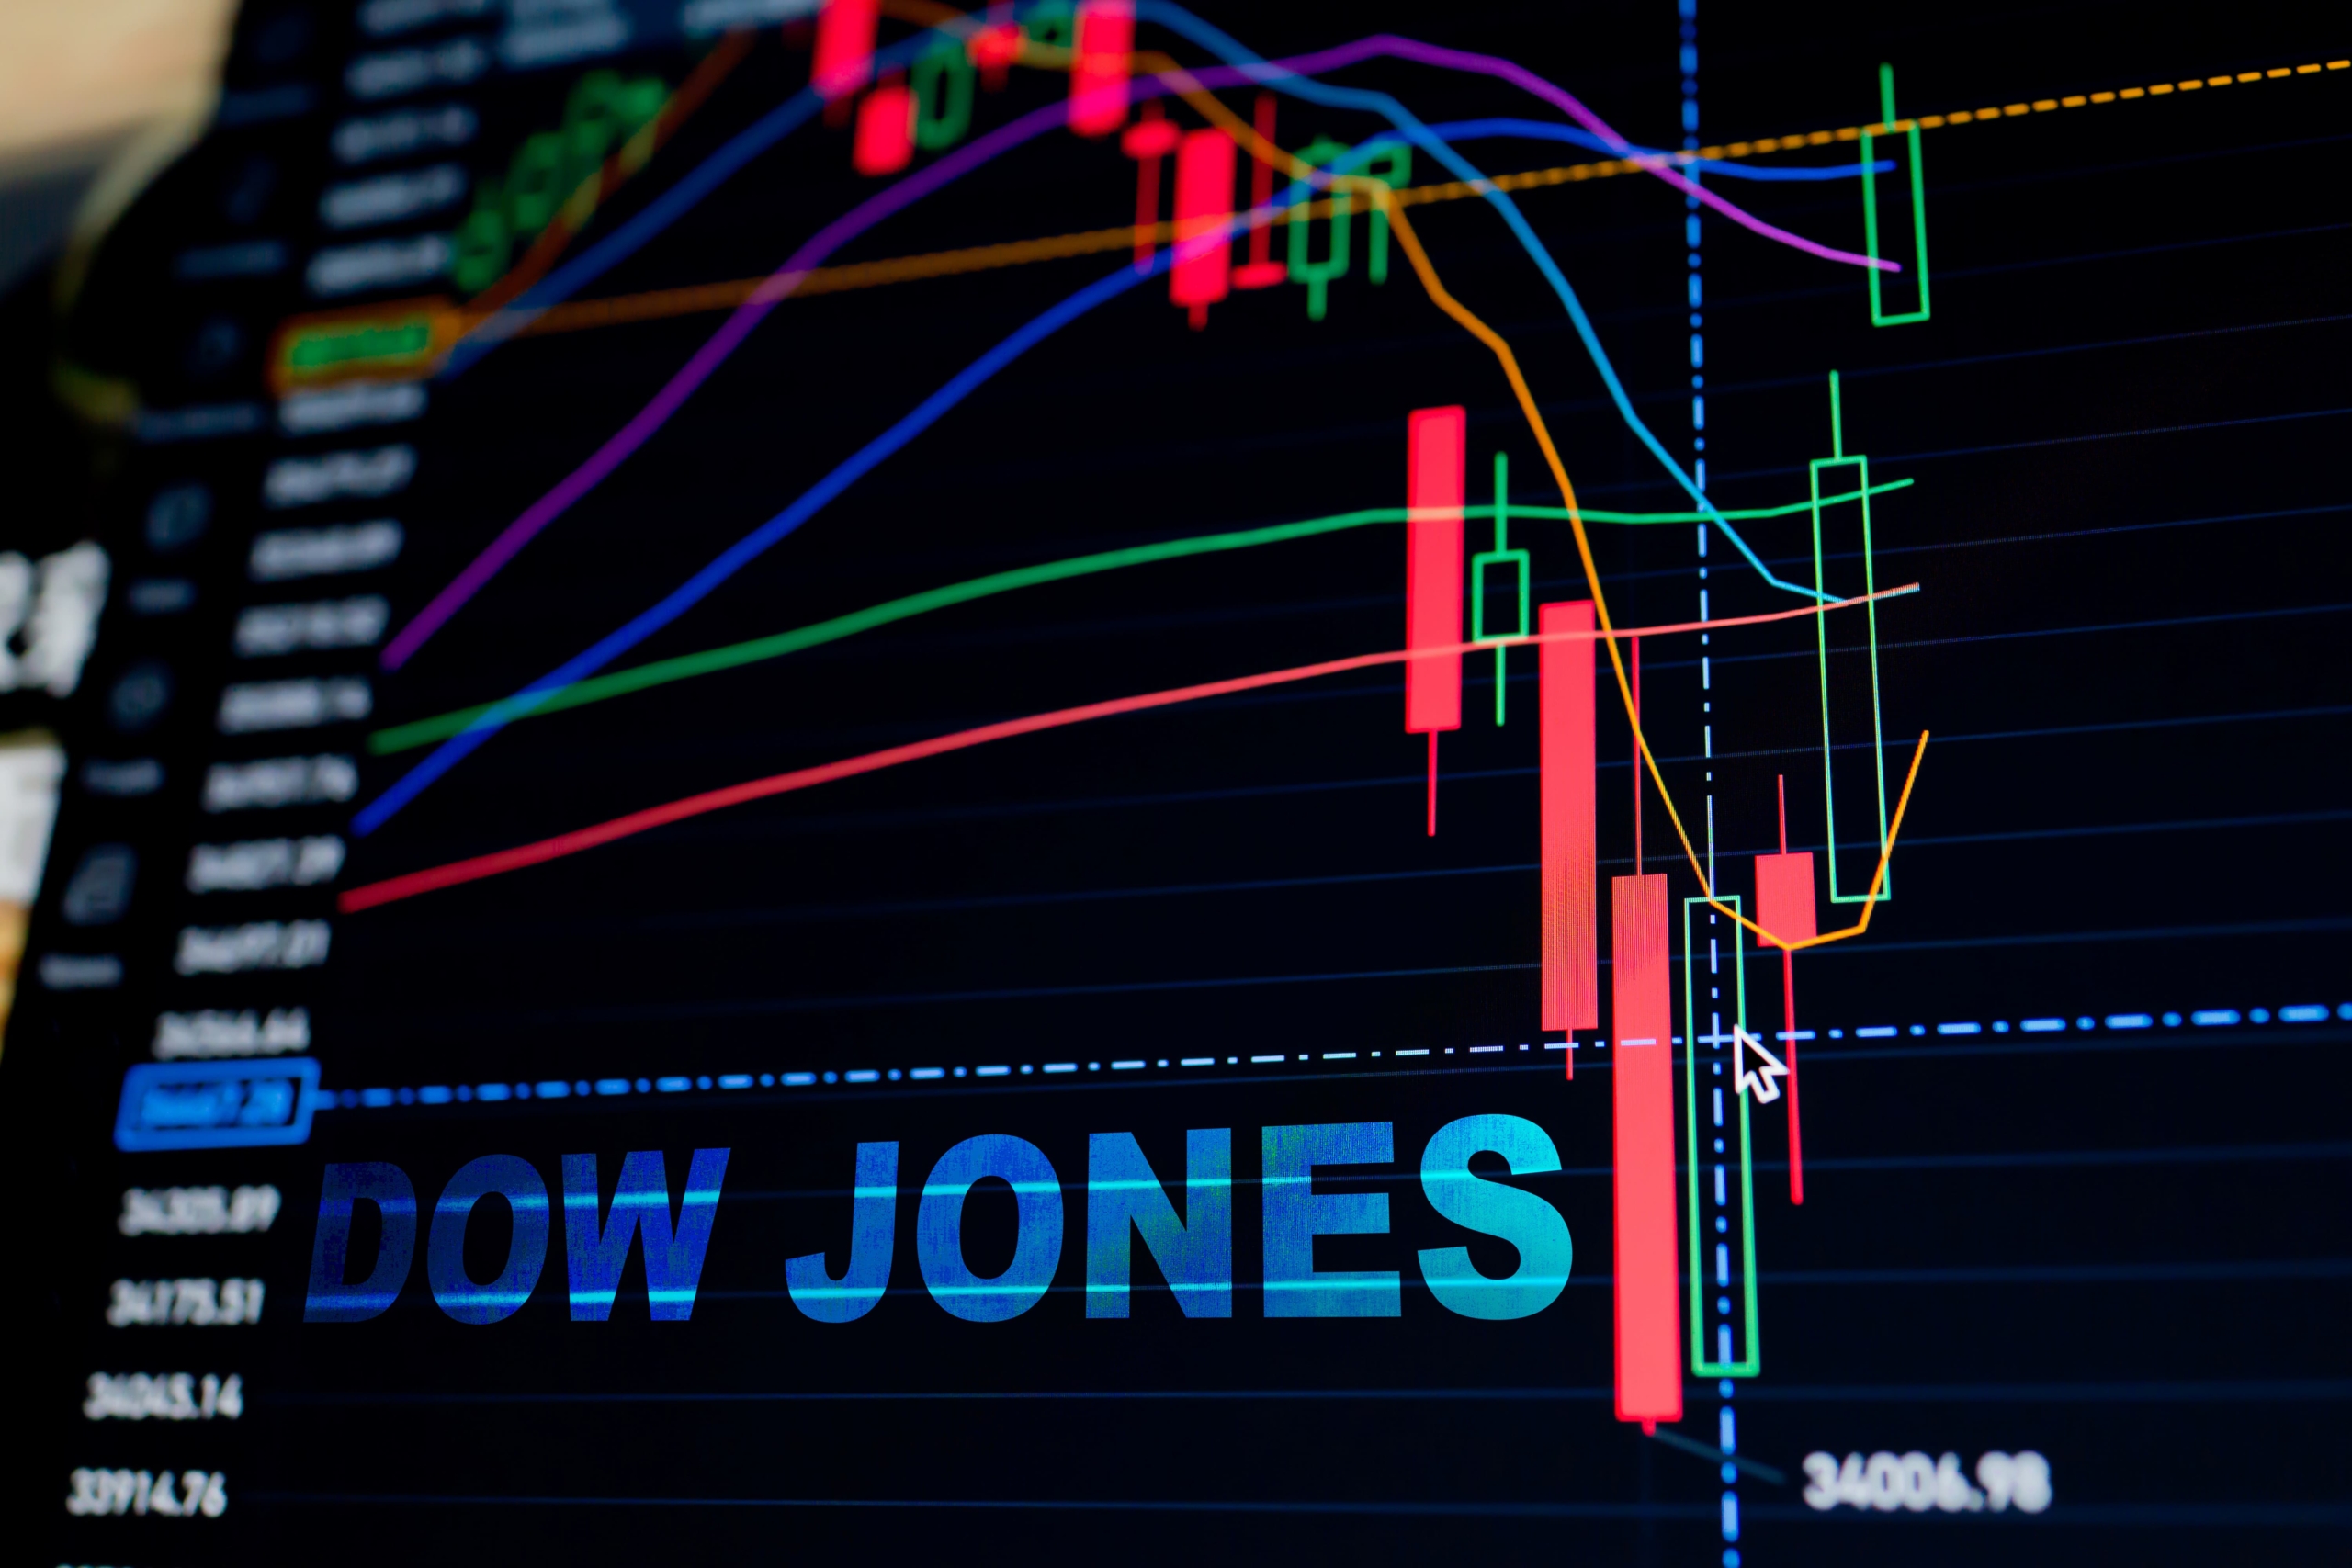
Index trading is one of the most popular class of markets to trade for CFD traders, rivalling major FX pairs in trading volume, but what is indices trading and how does trading them with CFDs work? Most people will be familiar with the names of the major stock indices from financial reports in all forms of media, the most popular stock indices of CFD traders and the stocks they track are below: USA The Dow Jones Industrial average - 30 largest blue-chip companies in the US NASDAQ Composite Index – Top 100 largest non-financial companies in the US (Mostly Tech) S&P 500 Index - 500 large cap companies in the US (Bank heavy) Europe and UK FTSE 100 – Top 100 UK companies CAC 40 – Top 40 French companies DAX 40 – Top 40 German companies (Formerly known as the DAX30 which it may still be labelled as) Asia and Australia ASX 200 – Top 200 Australian companies Hang Seng - A selection of the largest companies in Hong Kong. Nikkei 225 - Consists of 225 stocks in the Prime Market of the Tokyo Stock Exchange Some of the advantages of trading indices: You can take a broad view of the health (or not) of that countries stock market, i.e. rather than take a position in a single stock, take a position in a basket of stocks by buying or selling the index they are components of.
Higher leverage available to trade stock indices, up to 100:1 for qualified Pro clients. Extended trading hours, you can take positions in most indices up to 23 hours a day, far greater hours than the underlying stock exchanges. Take positions long or short with ease to profit from both a rising and falling market.
When you take a Long (Buy) position you profit if the market moves up, a Short (Sell) position will profit when the market moves down. How Indices are priced and understanding your position size Stock Indices are priced in the native currency i.e., the Dow Jones (WS30 on the GO Markets platform) is priced in USD, the FTSE100 in GBP, the ASX200 in AUD etc. This is important to keep in mind when choosing your position size, it also important to know the specifications of the contract you are trading is to make sure you understand the lot sizing before entering a trade.
You can check the specifications of any contract on MT4 and MT5 by right clicking it in the Market Watch Window and selecting “Specification” An example specification of the Dow (WS30) is below (MT4 specs, MT5 is very similar): You can see in the example above that the WS30 contract with GO Markets has a contract size of 1, this means 1 lot will equal $1 USD per point movement in PnL if you take a position. e.g., if you buy 1 lot at a price of 33670 and the price rises to 33680 you are in profit by 10 points, which would equal $10 USD Most indices will have a contract size of 1, though it is advisable to always check as some may have different values, an example in the S&P 500 (US500) which has a contract size of 10. It is important to understand the contract size and base currency of the index you are trading before entering a trade to avoid any nasty surprises. Main drivers of what moves an Index’s price.
In choosing which Index to trade it is also important to understand the drivers of that index and it’s component stocks. All Indexes will have some common drivers, such as global growth concerns, geopolitical events and non-US indices will be affected (fairly or not) by what US markets are doing. Each index will also have its own individual drivers as well though.
Examples The NASDAQ (NDX100) is heavily weighted with mega cap tech stocks, the health of the Tech sector will heavily influence its price. The ASX200 and FTSE100 both have large contingents of miners, meaning commodity prices will be big drivers of these 2 indexes, more so the ASX200. The Russell 2000 has many regional and mid-size banks as its component stocks, which is why during the recent banking crisis it underperformed other US indices.
Understanding these unique drivers for each Index is recommended to make the best trading decisions possible. In Summary, trading Indices opens up some great opportunities to position yourself to profit from market moves, spreads on Indices with GO Markets are some of the best in the CFD industry, with tight spreads in and out of hours( Some brokers will artificially increase spreads on Indices outside the stock market hours of that country) They allow you to seamlessly take long or short positions to speculate for profit, or to headge existing stock positions from an overnight move. You can click the link below to learn more about Index trading with GO Markets. https://www.gomarkets.com/au/index-trading-cfds/
By
Lachlan Meakin
Head of Research, GO Markets Australia.
Los artículos son elaborados por analistas y colaboradores de GO Markets y se basan en su propio análisis independiente o en sus experiencias personales. Las opiniones, puntos de vista o estilos de trading expresados son propios de los autores y no deben considerarse como representativos de, ni compartidos por, GO Markets. Cualquier consejo proporcionado es de carácter “general” y no tiene en cuenta tus objetivos, situación financiera ni necesidades personales. Considera si dicho consejo es adecuado para tus objetivos, situación financiera y necesidades antes de actuar sobre él. Si el consejo se refiere a la adquisición de un producto financiero en particular, debes obtener nuestra Declaración de Divulgación (Disclosure Statement, DS) y otros documentos legales disponibles en nuestro sitio web antes de tomar cualquier decisión.
El 28 de febrero de 2026, cuando comenzó el ataque conjunto de Estados Unidos e Israel, los números en las pantallas comenzaron a moverse de maneras que se sentían clínicas, incluso cuando la realidad sobre el terreno con las trágicas muertes de víctimas civiles en Irán, se sentía todo menos. Los mercados, como dicen, no tienen una brújula moral, más bien tienen una máquina de pesaje y ahora mismo, están sopesando la transición de toda la economía global de un modelo “justo a tiempo” a un ciclo “justo por si acaso”.
Lo que los mercados estaban señalizando
El 2 de marzo, la cinta índice se mantuvo cautelosa mientras que la defensa subió. Históricamente, los conflictos pueden acelerar la reposición y los pedidos, pero su tamaño (y qué tan rápido) aún depende de los presupuestos, las aprobaciones y los cuellos de botella en la entrega.
Los ganadores
1. Hanwha Aerospace (012450.KS)
Hanwha es uno de los nombres comercializados más activamente vinculados al tema “K-Dence”, una empresa que los mercados cada vez más se ve como un proveedor escalable en un ciclo global de artillería y municiones cada vez más estricto. Capacidad y credibilidad de entrega.
Cuando la reposición se vuelve urgente, la capacidad de producir a escala a menudo importa tanto como la plataforma misma. La demanda de exportación vinculada a sistemas como el K9 Thunder y Chunmoo ha reforzado la narrativa del flujo de pedidos duradero incluso cuando los resultados aún giran en torno a presupuestos, aprobaciones y plazos de entrega.
Cosas clave que pueden mover el sentimiento: actualizaciones de libros de pedidos, cadencia de producción y cualquier anuncio de exportación posterior.
2. Northrop Grumman (NOC)
Northrop se centró en la medida en que los inversores revalorizaron la exposición a la modernización estratégica y a los programas grandes y de larga duración. Los mercados de defensa a menudo vistos como de misión crítica pueden persistir a lo largo de los ciclos. Se trata menos de una cuarta parte y más sobre si el impulso se mantiene estable si las prioridades de modernización se mantienen en su lugar (y si los plazos cambian si no lo hacen).
Variables clave que pueden mover el sentimiento: El ritmo de adquisición, el calendario del contrato y el lenguaje de financiación relacionado con el programa.
3. Corporación RTX (RTX)
RTX volvió al centro de la cinta cuando los inversores fijaron el precio de un ciclo de reposición de interceptores y la economía de la defensa aérea de alto tempo. El desgaste es costoso y cuando las tasas de uso aumentan, los gobiernos generalmente tienen que reponer inventarios y, en muchos casos, financiar la expansión de la producción, lo que puede extender la acumulación de trabajo y aumentar la visibilidad de los ingresos.
Variables clave que pueden mover el sentimiento: Pedidos de reabastecimiento, indicadores de expansión de fabricación y rendimiento de entrega.
4. Lockheed Martin (LMT)
Lockheed llamó la atención ya que los mercados se centraron en la demanda de defensa antimisiles y la pregunta a la que se enfrenta cada mesa de compras en un entorno de alto ritmo: ¿qué tan rápido se pueden reconstruir los inventarios? Si la utilización se mantiene elevada, los ganadores tienden a ser los contratistas mejor posicionados para escalar la producción y entregar de manera confiable. La exposición de defensa antimisiles de Lockheed la mantiene estrechamente ligada a esa narrativa de reposición.
Variables clave que pueden mover el sentimiento: señales de rampa de producción, economía unitaria y cadencia de pedidos basada en el presupuesto.
5. Sistemas BAE (BA.L)
Con un atraso de 83.600 millones de libras esterlinas y un papel central en el programa submarino AUKUS, BAE se centró en el enfoque a medida que partes de Europa señalaban mayores ambiciones de gasto en defensa. La acción subió un 6.11% a un máximo de 52 semanas en medio de una rotación de “riesgo”, con los comerciantes observando los hitos de AUKUS y las adquisiciones europeas de defensa aérea y antimisiles, incluido “Sky Shield”.
Variables clave que pueden mover el sentimiento: Un catalizador potencial es cualquier claro aumento en el gasto alemán que eleve el flujo de pedidos en las unidades europeas de BAE, mientras que los riesgos clave incluyen un fuerte aumento en los rendimientos dorados del Reino Unido, una volatilidad renovada de la libra esterlina o una “amenaza de paz” la toma de ganancias.
800
Los perdedores: no todas las 'existencias de guerra' suben
6. AeroEnvironment (AVAV)
AeroVironment se desplomó 18% al aire libre antes de caer 17% intradiaria tras los informes de que la Fuerza Espacial de Estados Unidos estaba reabriendo un contrato de 1.400 millones de dólares. La medida destaca cómo los procesos de adquisición y el riesgo de contratos pueden impulsar la volatilidad, incluso en entornos temáticos de apoyo.
7. Defensa Kratos (KTOS)
Kratos se sienta en el tema de los drones y las municiones que se hacen malograntes que llamó la atención a medida que se intensificaba el conflicto en Oriente Medio. Las acciones aún se vendieron después de las ganancias, lo que destaca un riesgo común del sector de defensa. Kratos anunció una gran oferta de acciones de seguimiento en el rango de US$1.200 millones a US$1.400 millones, la medida fortalece el balance y puede apoyar futuras inversiones en programas.
Para los comerciantes enfocados en narrativas de “prima de conflicto” a corto plazo, la dilución puede cambiar rápidamente la configuración. Incluso cuando las condiciones de demanda parecen favorables, el mercado puede reponer el precio de las acciones si cada accionista finalmente posee una porción más pequeña del negocio.
8. Máquinas intuitivas (LUNR)
Algunos nombres especulativos de tecnología espacial se quedaron rezagados, ya que los inversores parecían favorecer a las empresas con ingresos vinculados a la defensa más establecidos.
9. Boeing (BA)
Boeing bajó alrededor de 2.5% en la sesión. Si bien su división de defensa es significativa, su negocio comercial puede ser más sensible a la demanda de aviación, las interrupciones del espacio aéreo y los movimientos de los precios del petróleo.
10. Spirit AeroSystems (SPR)
Spirit AeroSystems sigue estrechamente ligado al ciclo mundial de producción de aeronaves como importante proveedor de aeroestructuras.Los resultados recientes mostraron pérdidas cada vez mayores a pesar del aumento de las ventas, lo que refleja aumentos en los costos de producción en los principales programas de aeronaves. Estas presiones han pesado sobre la confianza de los inversionistas en las perspectivas a corto plazo. La adquisición planificada por parte de Boeing podría, en última instancia, remodelar la posición de la compañía en la cadena de suministro, pero el riesgo de ejecución y la estabilidad de la producción siguen siendo fundamentales para la forma en que el mercado cotiZA las acciones.
Qué ver a continuación
Escalamiento vs desescalamiento: Un cambio hacia la diplomacia o las discusiones sobre el alto el fuego pueden cambiar rápidamente el sentimiento en torno a las acciones de defensa.
Petróleo y transporte marítimo: Los picos energéticos pueden endurecer las condiciones financieras y presionar a los sectores cíclicos.
Presupuestos y premios: Los movimientos de precios a veces pueden preceder a las decisiones contractuales, y la claridad llega cuando se finalizan las adjudicaciones.
Capacidad de producción: Las empresas con un historial probado de producción y entrega a menudo atraen la mayor atención de los inversores.
Restricciones de la cadena de suministro: Las tierras raras, la propulsión y la electrónica siguen siendo cuellos de botella potenciales que pueden limitar la rapidez con la que la producción escala.
La lente a más largo plazo
El conflicto iraní de 2026 es ante todo una tragedia humana. Para los mercados, también puede representar un cambio en la forma en que se prioriza el gasto en seguridad nacional dentro de los marcos fiscales. Si el gasto en defensa se mantiene elevado en un horizonte multianual, las empresas con capacidad de fabricación escalable y pilas de tecnología integradas podrían atraer la atención sostenida de los inversores. Dicho esto, los mercados se mueven en ciclos. Los temas estructurales pueden persistir, pero también pueden repreciar rápidamente cuando cambian las suposiciones. Mantenerse analítico y consciente de los riesgos sigue siendo fundamental.
Las referencias a empresas, sectores o movimientos del mercado específicos se proporcionan únicamente para comentarios generales del mercado y no constituyen una recomendación, oferta o solicitud para comprar o vender ningún producto financiero.Las reacciones del mercado a eventos geopolíticos o macroeconómicos pueden ser volátiles e impredecibles, y los resultados pueden diferir materialmente de las expectativas.
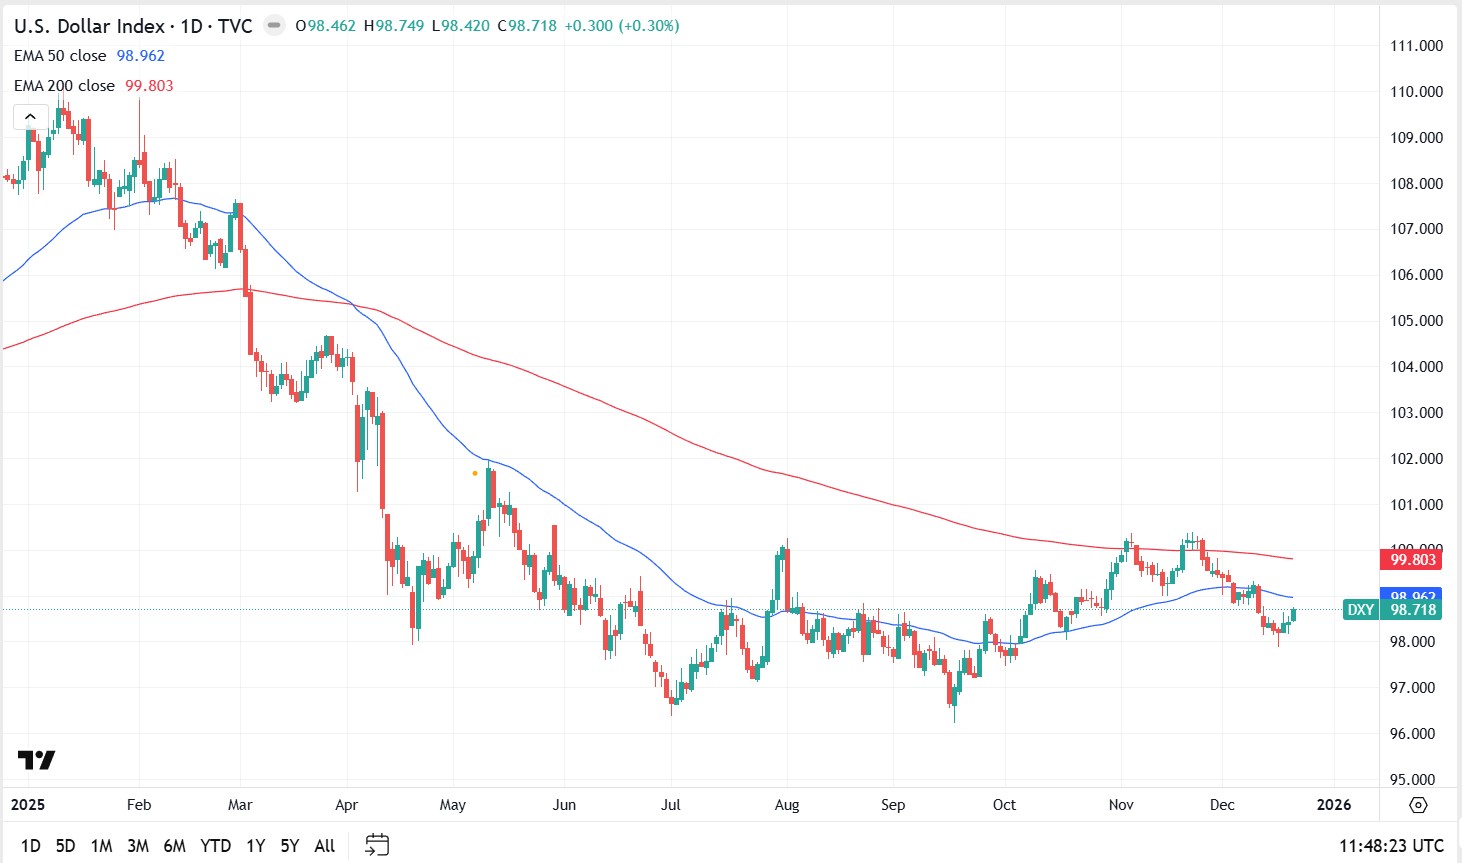
2025 has seen a material decline in the fortunes of the greenback. A technical structure breakdown early in the year was followed by a breach of the 200-day moving average (MA) at the end of Q1. The index then entered correction territory, printing a three-year low at the end of Q2.
Since then, we have seen attempts to build a technical base, including a re-test of the end-of-June lows in mid-September. However, buying pressure has not been strong enough to push price back above the technically critical and psychologically important 100 level.
What the levels suggest from here
As things stand, the index remains more than 10% lower for 2025. On this technical view, the index may revisit the 96 area. However, technical levels can fail and outcomes depend on multiple factors.
US dollar index
Source: TradingView
The key question for 2026
The key question remains: are we likely to see further losses in the early part of next year and beyond, or will current support hold?
We cannot assess the US dollar in isolation and any outlook is shaped by internal and global factors, not least its relative strength versus other major currencies. Many of these drivers are interrelated, but four potential headwinds stand out for any US dollar recovery. Collectively, they may keep downside pressure in play.
Four headwinds for any US dollar recovery
1. The US dollar as a safe-haven trade
One scenario where US dollar support has historically been evident is during major global events, slowdowns and market shocks. However, the more muted response of the US dollar during risk-off episodes this year suggests a shift away from the historical norm, with fewer sustained US dollar rallies.
Instead, throughout 2025, some investors appearedto favour gold, and at other times, FX and even equities, rather than into the US dollar. If this change in behaviour persists through 2026, it could make recovery harder, even if global economic pressure builds over the year ahead.
2. US versus global trade
Trade policy is harder to measure objectively, and outcomes can be difficult to predict. That said, trade battles driven by tariffs on US imports are often viewed as an additional potential drag on the US dollar.
The impact may be twofold if additional strain is placed on the US economy through:
a slowdown in global trade volumes as impacted countries seek alternative trade relationships, with supply chain distortions that may not favour US growth
pressure on US corporate profit margins as tariffs lift costs for importers
3. Removal of quantitative tightening
The Fed formally halted its balance sheet reduction, quantitative tightening (QT), as of 1 December 2025, ending a program that shrank assets by roughly US$2.4 trillion since mid-2022.
Traditionally, ending QT is seen as marginally negative for the US dollar because it stops the withdrawal of liquidity, can ease global funding conditions, and may reduce the scarcity that can support dollar demand. Put simply, more dollars in the system can soften the currency’s support at the margin, although outcomes have varied historically and often depend on broader financial conditions.
4. Interest rate differential
Interest rate differential (IRD) is likely to be a primary driver of US dollar strength, or otherwise, in the months ahead. The latest FOMC meeting delivered the expected 0.25% cut, with attention on guidance for what may come next.
Even after a softer-than-expected CPI print, markets have been reluctant to price aggressive near-term easing. At the time of writing, less than a 20% chance of a January cut is priced in, and it may be March before we see the next move.
The Fed is balancing sticky inflation against a jobs market under pressure, with the headline rate back at levels last seen in 2012. The practical takeaway is that a more accommodative stance may add to downward pressure on the US dollar.
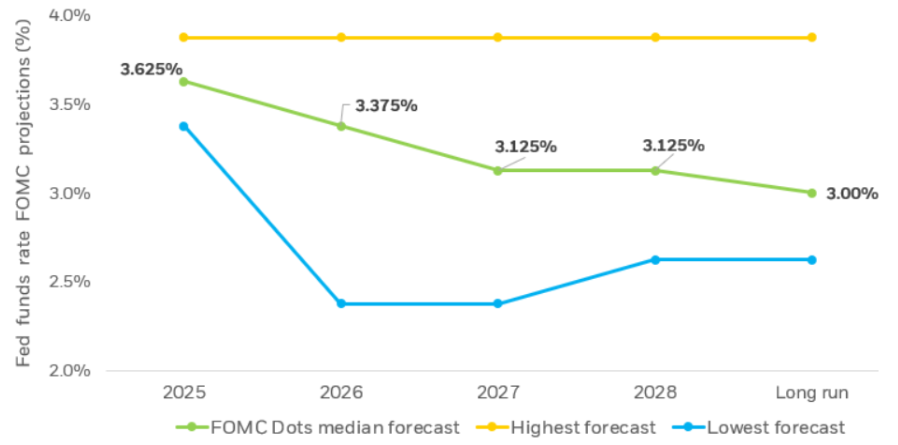
Current expectations imply around two rate cuts through 2026, with the potential for further easing beyond that, broadly consistent with the median projections shown in the chart below. These are forecasts rather than guarantees, and they can shift as economic data and policy guidance evolve.
Source: US Federal Reserve, Summart of Economic Projections
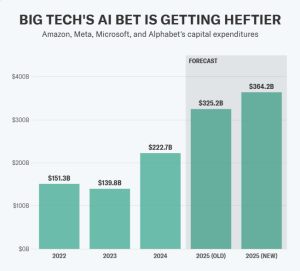
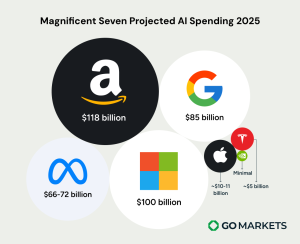
The “Magnificent Seven” technology companies are expected to invest a combined $385 billion into AI by the end of 2025.
Microsoft is positioning itself as the platform leader. Nvidia dominates the underlying AI infra. Google leads in research. Meta is building open-source tech. Amazon – AI agents. Apple — on-device integration. And Tesla pioneering autonomous vehicles and robots.
The “Big 4” tech companies' AI spending alone is forecast at $364 billion.
With such enormous sums pouring into AI, is this a winner-take-all game?
Or will each of the Mag Seven be able to thrive in the AI future?
Microsoft: The AI Everywhere Strategy
Microsoft has made one of the biggest bets on AI out of the Mag Seven — adopting the philosophy that AI should be everywhere.
Through its deep partnership with OpenAI, of which it is a 49% shareholder, the company has integrated GPT-5 across its entire ecosystem.
Key initiatives:
GPT-5 integration across consumer, enterprise, and developer tools through Microsoft 365 Copilot, GitHub Copilot, and Azure AI Foundry
Azure AI Foundry for unified AI development platform with model router technology
Copilot ecosystem spanning productivity, coding, and enterprise applications with real-time model selection
$100 billion projected AI infrastructure spending for 2025
Microsoft’s centrepiece is Copilot, which can now detect whether a prompt requires advanced reasoning and route to GPT-5's deeper reasoning model.
This (theoretically) means high-quality AI outputs become invisible infrastructure rather than a skill users need to learn.
However, this all-in bet on OpenAI does come with some risks. It is putting all its eggs in OpenAI's basket, tying its future success to a single partnership.
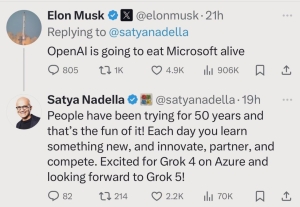
Elon Musk warned that "OpenAI is going to eat Microsoft alive"[/caption]
Google: The Research Strategy
Google’s approach is to fund research to build the most intelligent models possible. This research-first strategy creates a pipeline from scientific discovery to commercial products — what it hopes will give it an edge in the AI race.
Key initiatives:
Over 4 million developers building with Gemini 2.5 Pro and Flash
Ironwood TPU offering 3,600 times better performance compared to Google’s first TPU
AI search overviews reaching 2 billion monthly users across Google Search
DeepMind breakthroughs: AlphaEvolve for algorithm discovery, Aeneas for ancient text interpretation, AlphaQubit for quantum error detection, and AI co-scientist systems
Google’s AI research branch, DeepMind, brings together two of the world's leading AI research labs — Google Brain and DeepMind — the former having invented the Transformer architecture that underpins almost all modern large language models.
The bet is that breakthrough research in areas like quantum computing, protein folding, and mathematical reasoning will translate into a competitive advantage for Google.
Today, we're introducing AlphaEarth Foundations from @GoogleDeepMind , an AI model that functions like a virtual satellite which helps scientists make informed decisions on critical issues like food security, deforestation, and water resources. AlphaEarth Foundations provides a… pic.twitter.com/L1rk2Z5DKk
Meta has made a somewhat contrarian bet in its approach to AI: giving away their tech for free. The company's Llama 4 models, including recently released Scout and Maverick, are the first natively multi-modal open-weight models available.
Key initiatives:
Llama 4 Scout and Maverick - first open-weight natively multi-modal models
AI Studio that enables the creation of hundreds of thousands of AI characters
$65-72 billion projected AI infrastructure spending for 2025
This open-source strategy directly challenges the closed-source big players like GPT and Claude. By making AI models freely available, Meta is essentially commoditizing what competitors are trying to monetize. Meta's bet is that if AI models become commoditized, the real value will be in the infrastructure that sits on top. Meta's social platforms and massive user base give it a natural advantage if this eventuates.
Meta's recent quarter was also "the best example to date of AI having a tangible impact on revenue and earnings growth at scale," according to tech analyst Gene Munster.
H1 relative performance of the Magnificent Seven stocks. Source: KoyFin, Finimize
However, it hasn’t been all smooth sailing for Meta. Their most anticipated release, Llama Behemoth, has all but been scrapped due to performance issues. And Meta is now rumored to be developing a closed-source Behemoth alternative, despite their open-source mantra.
Amazon: The AI Agent Strategy
Amazon’s strategy is to build the infrastructure for AI that can take actions — booking meetings, processing orders, managing workflows, and integrating with enterprise systems.
Rather than building the best AI model, Amazon has focused its efforts on becoming the platform where all AI models live.
Key initiatives:
Amazon Bedrock offering 100+ foundation models from leading AI companies, including OpenAI models.
$100 million additional investment in AWS Generative AI Innovation Center for agentic AI development
Amazon Bedrock AgentCore enabling deployment and scaling of AI agents with enterprise-grade security
$118 billion projected AI infrastructure spending for 2025
The goal is to become the “orchestrator” that lets companies mix and match the best models for different tasks.
Amazon’s AgentCore will provide the underlying memory management, identity controls, and tool integration needed for these companies to deploy AI agents safely at scale.
This approach offers flexibility, but does carry some risks. Amazon is essentially positioning itself as the middleman for AI. If AI models become commoditized or if companies prefer direct relationships with AI providers, Amazon's systems could become redundant.
Nvidia: The Infra Strategy
Nvidia is the one selling the shovels for the AI gold rush. While others in the Mag Seven battle to build the best AI models and applications, Nvidia provides the fundamental computing infrastructure that makes all their efforts possible.
This hardware-first strategy means Nvidia wins regardless of which company ultimately dominates. As AI advances and models get larger, demand for Nvidia's chips only increases.
Key initiatives:
Blackwell architecture achieving $11 billion in Q2 2025 revenue, the fastest product ramp in company history
New chip roadmap: Blackwell Ultra (H2 2025), Vera Rubin (H2 2026), Rubin Ultra (H2 2027)
Data center revenue reaching $35.6 billion in Q2, representing 91% of total company sales
Manufacturing scale-up with 350 plants producing 1.5 million components for Blackwell chips
With an announced product roadmap of Blackwell Ultra (2025), Vera Rubin (2026), and Rubin Ultra (2027), Nvidia has created a system where the AI industry must continuously upgrade to Nvidia’s newest tech to stay competitive.
This also means that Nvidia, unlike the others in the Mag Seven, has almost no direct AI spending — it is the one selling, not buying.
However, Nvidia is not indestructible. The company recently halted its H20 chip production after the Chinese government effectively blocked the chip, which was intended as a workaround to U.S. export controls.
Apple: The On-Device Strategy
Apple's AI strategy is focused on privacy, integration, and user experience. Apple Intelligence, the AI system built into iOS, uses on-device processing and Private Cloud Compute to help ensure user data is protected when using AI.
Key initiatives:
Apple Intelligence with multi-model on-device processing and Private Cloud Compute
Enhanced Siri with natural language understanding and ChatGPT integration for complex queries
Direct developer access to on-device foundation models, enabling offline AI capabilities
$10-11 billion projected AI infrastructure spending for 2025
The drawback of this on-device approach is that it requires powerful hardware from the user's end. Apple Intelligence can only run on devices with a minimum of 8GB RAM, creating a powerful upgrade cycle for Apple but excluding many existing users.
Tesla: The Robo Strategy
Tesla's AI strategy focuses on two moonshot applications: Full Self-Driving vehicles and humanoid robots.
This is the 'AI in the physical world' play. While others in the Mag Seven are focused on the digital side of AI, Tesla is building machines that use AI for physical operations.
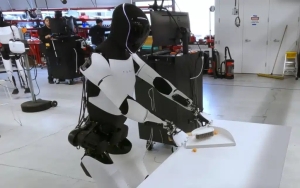
Tesla’s Optimus robot replicating human tasks
Key initiatives:
Plans for 5,000-10,000 Optimus robots in 2025, scaling to 50,000 in 2026
Robotaxi service targeting availability to half the U.S. population by EOY 2025
AI6 chip development with Samsung for unified training across vehicles, robots, and data centers
$5 billion projected AI infrastructure spending for 2025
This play is exponentially harder to develop than digital AI, and the markets have reflected low confidence that Tesla can pull it off.
TSLA has been the worst-performing Mag Seven stock of 2025, down 18.37% in H1 2025.
However, if Tesla’s strategy is successful, it could be far more valuable than other AI plays. Robots and autonomous vehicles could perform actual labour worth trillions of dollars annually.
The $385 billion Question
The Mag Seven are starting to see real revenue come in from their AI investments. But they're pouring that money (and more) back into AI, betting that the boom is just getting started.
The platform players like Microsoft and Amazon are betting on becoming essential infrastructure. Nvidia’s play is to sell the underlying hardware to everyone. Google and Meta compete on capability and access. While Apple and Tesla target specific use cases.
The $385 billion question is which of the Magnificent Seven has bet the right way? Or will a new player rise and usurp the long-standing tech giants altogether?
You can access all Magnificent Seven stocks and thousands of other Share CFDs on GO Markets.
Los datos de inflación de Estados Unidos del miércoles son la pieza central de la semana, pero con el petróleo acercándose a máximos de siete meses, el sentimiento de Bitcoin (BTC) cambiando y el dólar australiano en máximos de tres años, los comerciantes tienen mucho que navegar en la próxima semana.
Datos rápidos
La tasa de inflación de Estados Unidos (febrero) es el evento binario clave para la fijación de precios de reducción de tasas y la dirección de la renta variable.
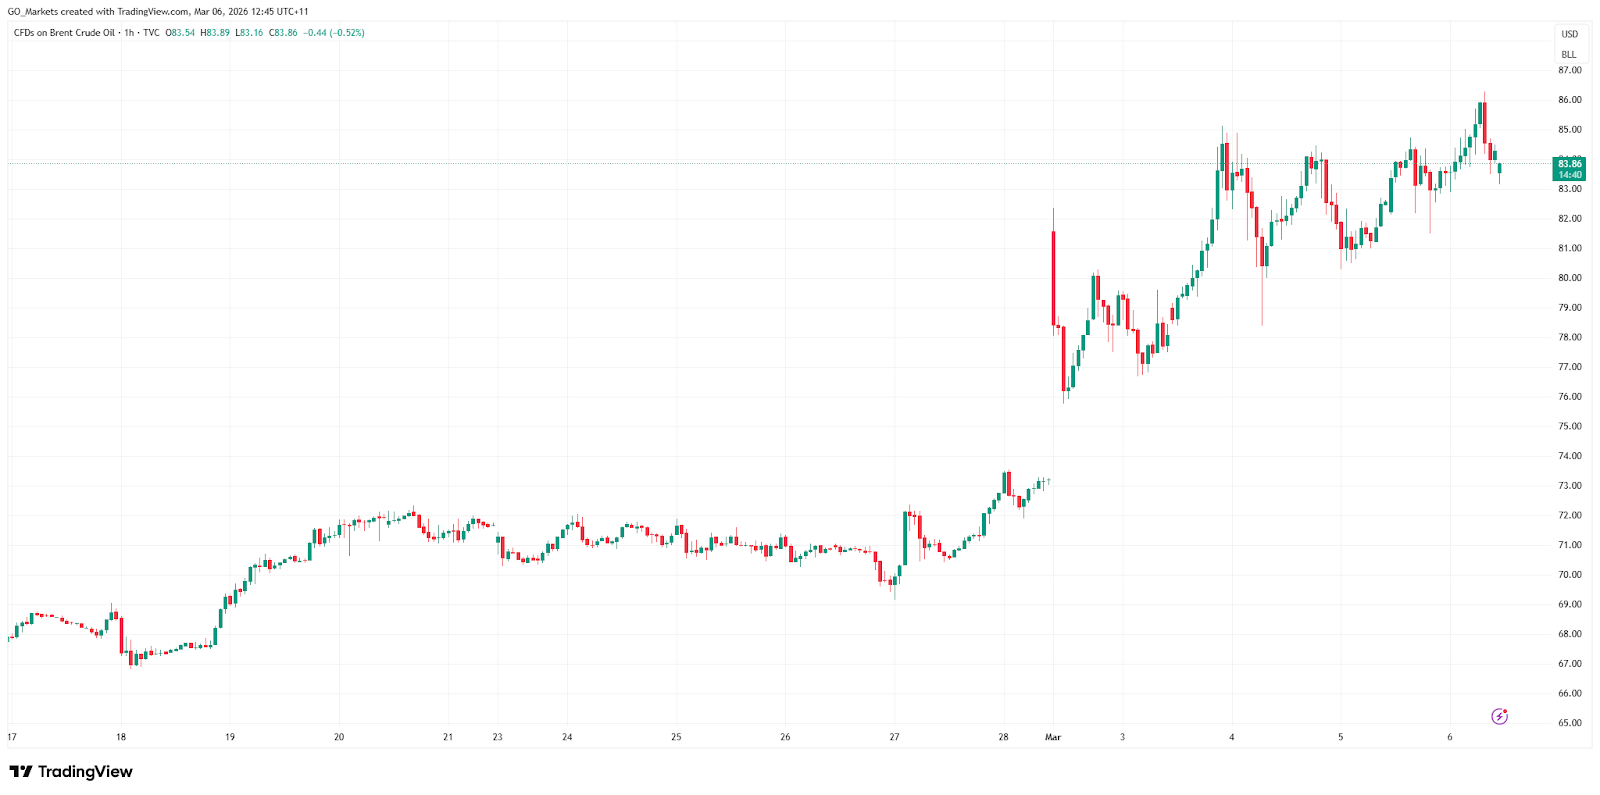
El crudo Brent cotiza alrededor de US$82—84/BBL, cerca de máximos de siete meses, con una prima de riesgo geopolítico de 4 a 10 dólares gracias a las tensiones entre Irán y Ormuz.
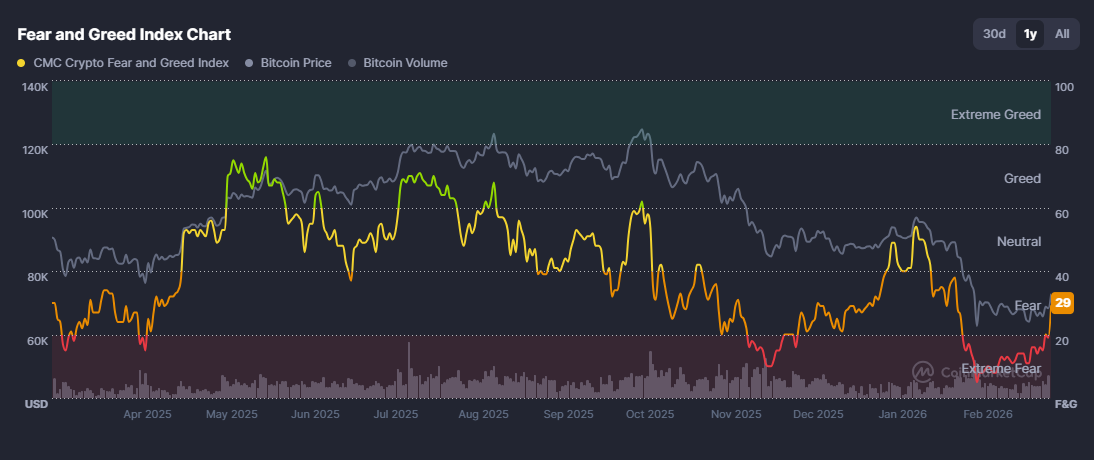
Bitcoin cotiza por encima de los 70.000 dólares al 6 de marzo, un posible cambio de tendencia si se mantiene a lo largo de la semana.
Estados Unidos: la inflación en foco
La lectura de inflación estadounidense del mes pasado mostró que los precios subieron 2.4% interanual, aún muy por encima de la meta de 2% de la Fed.
La tasa de inflación de febrero, que vence el miércoles, será examinada en busca de señales de que la traspaso de las tarifas o el aumento de los costos de la energía están haciendo que los precios vuelvan a subir, o si la lenta bajada sigue intacta.
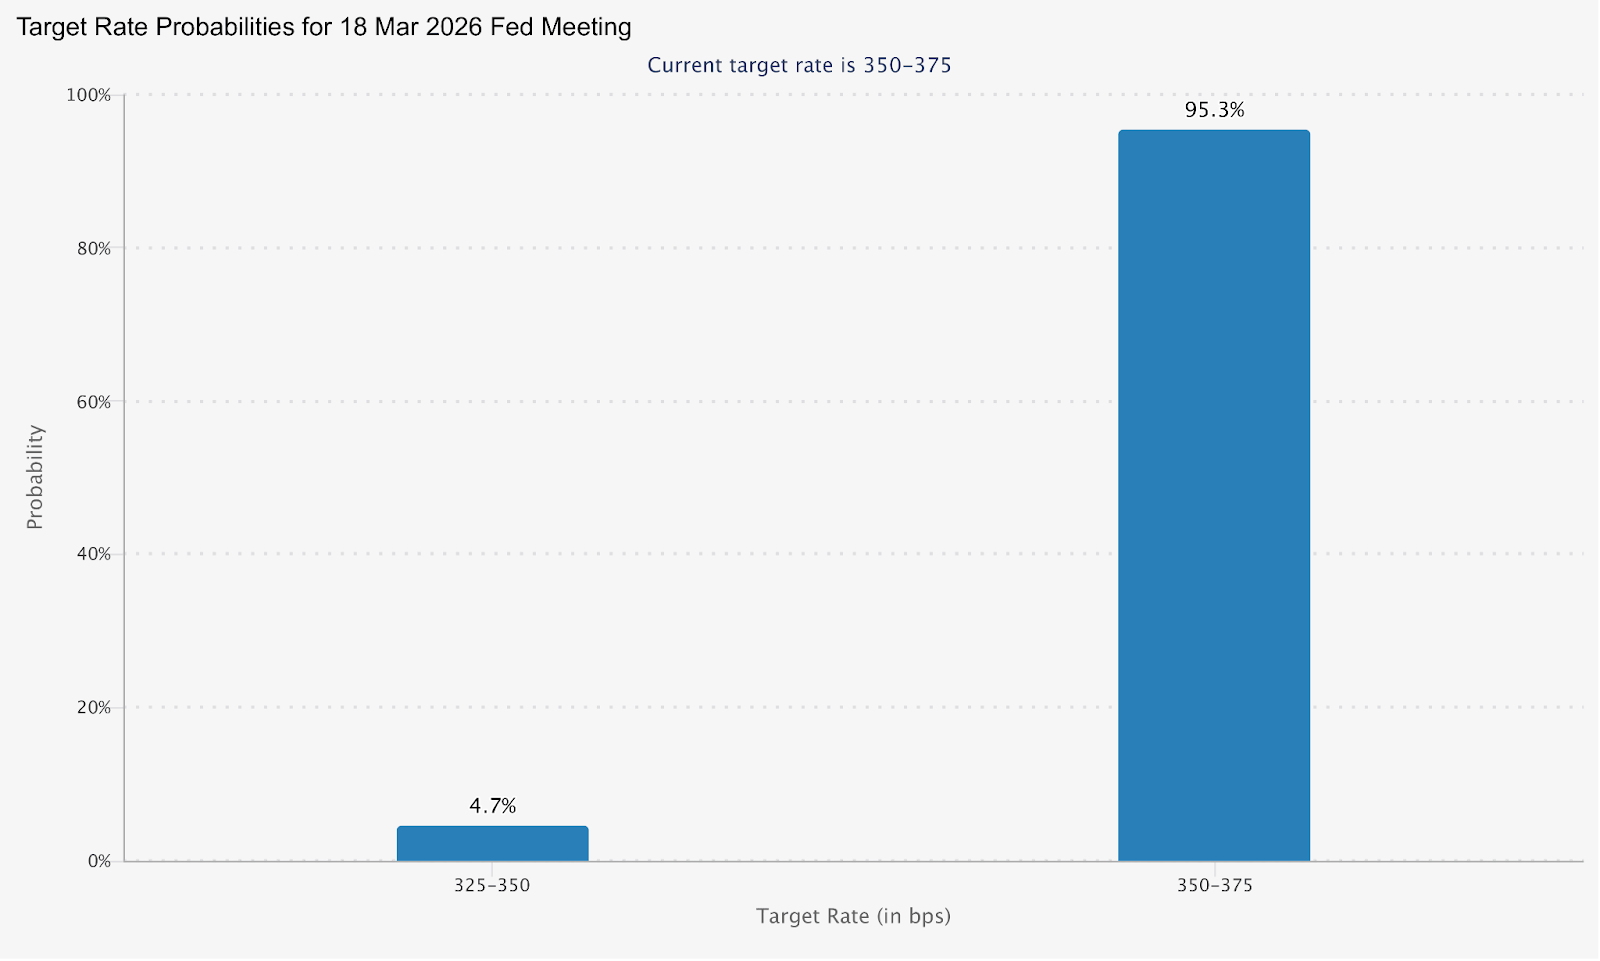
La reunión del FOMC de marzo del 17 al 18 de marzo ahora tiene un precio de solo 4.7% de probabilidad de un recorte. Una impresión de inflación más alta de lo esperado esta semana podría potencialmente empujar aún más las expectativas de recorte de tasas.
Una lectura más suave abre la puerta a una nueva reducción de precios y un posible alivio en los activos de riesgo.
Fechas clave
Tasa de inflación de Estados Unidos (IPC de febrero): Miércoles 11 de marzo, 12:30 h (AEDT)
Monitorear
La divergencia de inflación básica frente a la general como evidencia de traspaso arancelario en los precios de los bienes.
Sensibilidad de rendimiento de tesorería a 2 y 10 años a la impresión.
Dirección del USD y retarificación de FedWatch antes de la decisión del FOMC del 18 de marzo.
Probabilidades de tasa objetivo para la reunión del FOMC del 18 de marzo | CME
Aceite: elevado y sensible a los eventos
Actualmente, el Brent cotiza alrededor de US$83—85 por barril, con un rango de 52 semanas que abarca US$58,40 a US$85,12, lo que refleja el dramático movimiento desencadenado por el conflicto de Oriente Medio.
Analistas estiman que la prima de riesgo geopolítico ya horneada al petróleo en 4 a 10 dólares por barril, y los pronósticos promedio del Brent 2026 se han elevado a 63,85 dólares por bbl, frente a los 62,02 dólares de enero.
El Perspectiva Energética a Corto Plazo de la EIA pronostica que el Brent promediará $58/bbl en 2026, muy por debajo del precio spot actual.
La brecha entre el spot y la línea base del pronóstico podría ser un marco útil para los comerciantes esta semana: cualquier señal de desescalada de Oriente Medio podría cerrar rápidamente esa brecha.
Monitorear
Desarrollos del Estrecho de Ormuz y cualquier señal diplomática de las conversaciones nucleares de Irán.
Datos de inventario de petróleo semanal de EIA.
El derribación del petróleo a las expectativas de inflación y si cambia la postura del banco central.
Desempeño de la renta variable del sector energético en relación con el mercado en general.
BTC ha estado intentando estabilizarse después de una brutal corrección del 53% en las últimas 17 semanas, alimentada por la escalada de tensiones geopolíticas y las renovadas preocupaciones arancelarias.
No obstante, ayer se vio un salto de 8% por encima de los 72,000 dólares, y el cripto “índice de miedo y codicia” saltó a 29 (miedo), arriba desde debajo de 20 (miedo extremo), donde lleva más de un mes sentado, lo que indica un posible cambio de sentimiento.
Una impresión de inflación estadounidense más fresca de lo esperado el miércoles podría proporcionar más combustible para la ruptura; una impresión caliente corre el riesgo de que BTC vuelva a estar por debajo del nivel de US$70,000 que acaba de recuperar.
Monitorear
Inflación impresión reacción el miércoles como el macrocatalizador primario de la mudanza.
Cualquier rotación a altcoins siguiendo la fuerza de BTC.
Datos de entrada/salida de ETF como confirmación de participación institucional.
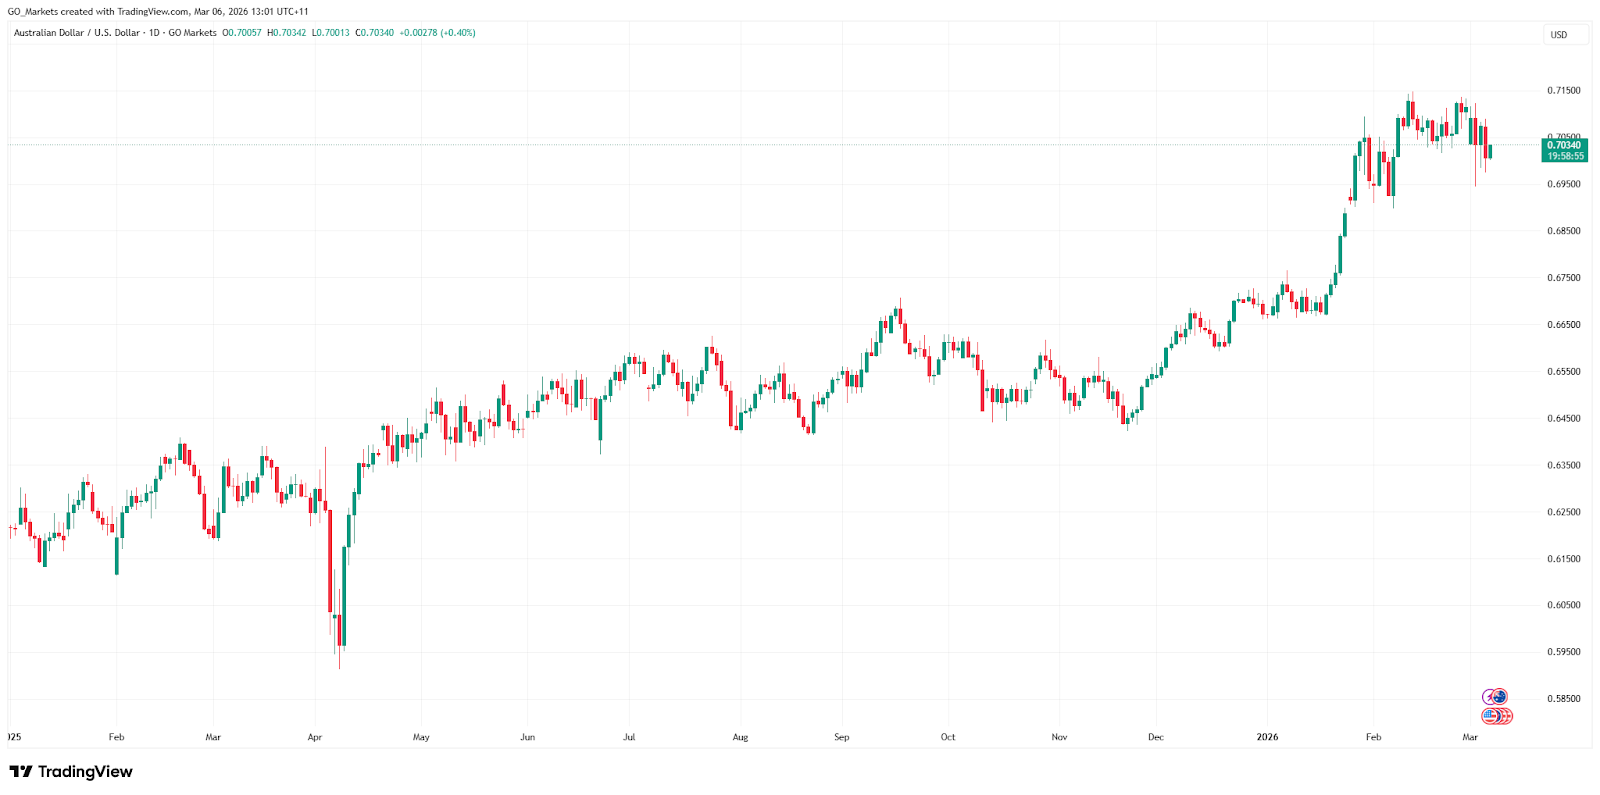
AUD/USD: El RBA de Hawkish se encuentra con vientos cruzados geopolíticos
El australiano cotiza cerca de máximos de más de tres años y se dirige a su cuarta ganancia mensual consecutiva, con un aumento de más del 6% en lo que va de año, lo que la convierte en la moneda del G10 de mejor desempeño en 2026.
El impulsor es una clara divergencia política. La gobernadora del RBA, Michele Bullock, señaló que la reunión de política de marzo está “viva” para un posible aumento de tasas, y advirtió que un choque en el precio del petróleo por las tensiones en Irán podría reavivar las presiones inflacionarias internas.
Los precios de mercado ahora sugieren alrededor de un 28% de posibilidades de una subida de 25 pb en la próxima reunión, mientras que la fijación de precios por completo se ajustará hasta mayo, y alrededor de un 75% de probabilidad de otro aumento a 4.35% para fin de año.
Esta lectura tensa, puesta en contra de una Fed en espera y que enfrenta una presión política dótica, crea un potencial viento de cola estructural para el australiano.
Monitorear
Reacción del AUD/USD al dato de inflación estadounidense del miércoles.
Probabilidad de alza de tasa del RBA reajuste de precios a lo largo de la semana.
El mineral de hierro y los precios de las materias primas como impulsores secundarios del AUD.
China demanda señales, dada la exposición exportadora de Australia.
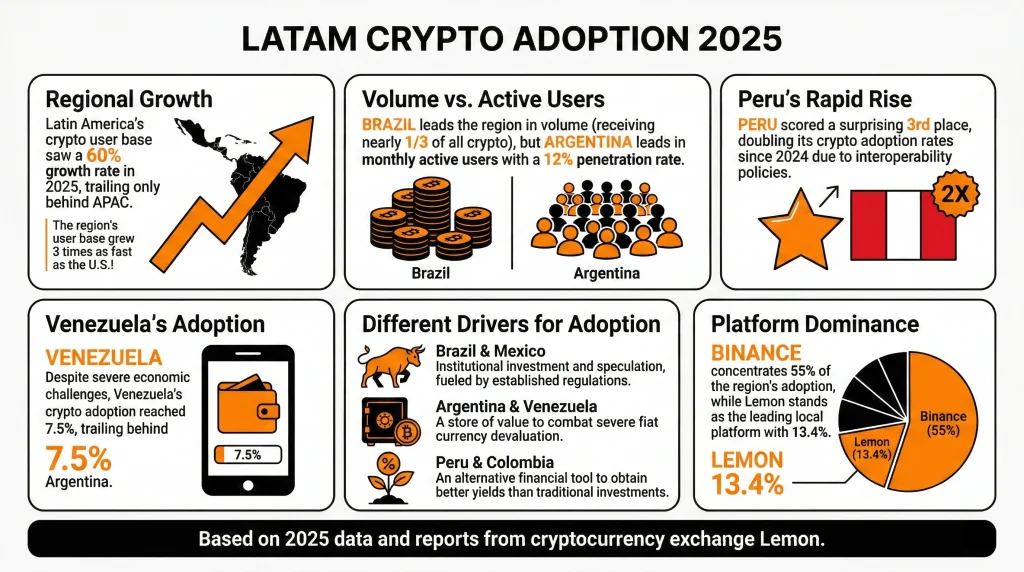
América Latina (LATAM) registró más de 730 mil millones de dólares en volumen de criptomonedas en 2025, un aumento interanual del 60% que hizo a la región responsable de aproximadamente el 10% de la actividad criptográfica mundial.
En 2026, los actores institucionales están empezando a tomar en serio a la región, la regulación se está cristalizando y los impulsores estructurales a partir de 2025 no muestran signos de desvanecimiento. Pero la región no es una sola historia, y 2026 pondrá a prueba si el impulso actual se basa en fundamentos sólidos o en optimismo especulativo.
Datos rápidos
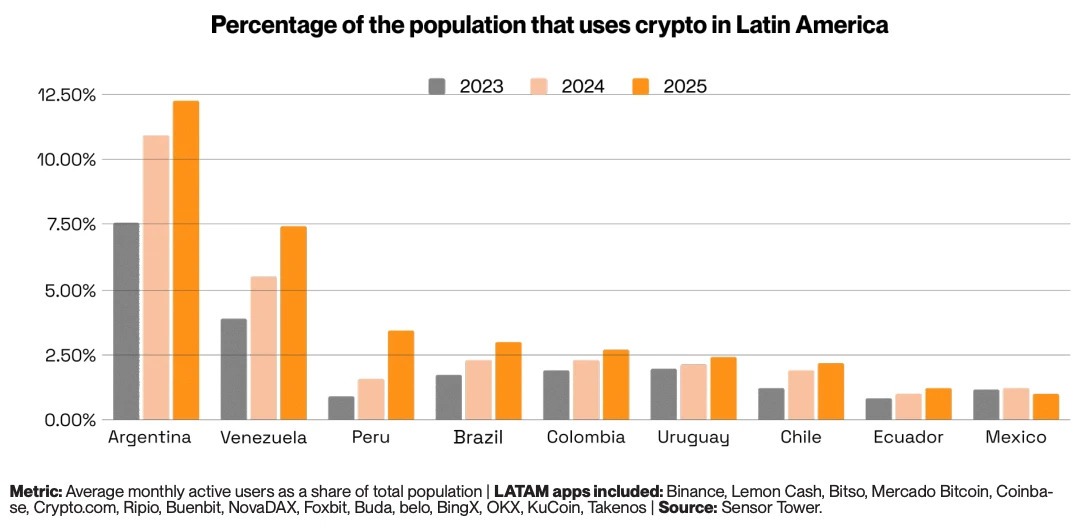
Los usuarios activos mensuales de criptomonedas de LATAM crecieron 18% interanual (YoY), tres veces más rápido que Estados Unidos.
Argentina alcanzó 12% mensual de penetración de usuarios activos, lo que representa más de una cuarta parte de la actividad criptográfica de la región.
Más del 90% de los flujos criptográfico brasileños están ahora relacionados con la moneda estable.
Tres países de LATAM se encuentran en el top 20 mundial: Brasil (5º), Venezuela (18º), Argentina (20º).
Las descargas de aplicaciones criptográfico de Perú crecieron 50% en 2025, con 2.9 millones de descargas.
De la herramienta de supervivencia a la infraestructura financiera
América Latina no abrazó la criptomoneda debido a la especulación. Lo abrazó porque los sistemas financieros tradicionales fallaron repetidamente a la gente común. En los últimos 15 años, la inflación promedio anual en las cinco economías más grandes de la región se ubicó en 13%, en comparación con solo 2.3% en Estados Unidos durante el mismo período.
En Venezuela, alcanzó el 65,000% en un solo año. En Argentina, superó el 220% en 2024. Para millones de personas, mantener los ahorros en moneda local fue un lento acto de autodestrucción. Las monedas stablecoins se convirtieron en la respuesta natural. Los activos digitales conectados al dólar estadounidense ofrecían un depósito confiable de valor, transferibilidad sin fronteras y acceso sin una cuenta bancaria.
A diferencia de Occidente, donde el cripto se ve más como un instrumento especulativo, en LATAM se ha convertido en una herramienta financiera necesaria. Sin embargo, los impulsores de adopción no son del todo uniformes en toda la región. Brasil y México son historias institucionales, impulsadas por la participación regulada en el mercado y los actores financieros establecidos.
Argentina y Venezuela siguen siendo jugadas de almacenamiento de valor, con cripto sirviendo como cobertura directa contra el colapso fiduciario. Y Perú y Colombia son mercados más de búsqueda de rendimiento, donde las criptomonedas ofrecen rendimientos que las cuentas de ahorro tradicionales no pueden igualar.
¿Qué tan rápido está adoptando LATAM las criptomonedas?
El volumen criptográfico en cadena de LATAM aumentó 60% interanual en 2025. La región ha registrado casi 1.5 billones de dólares en volumen acumulado desde mediados de 2022, llegando a un máximo récord de 87.700 millones de dólares en un solo mes en diciembre de 2024.
Los usuarios criptoactivos mensuales en LATAM también crecieron 18% en 2025, tres veces más rápido que en Estados Unidos.
Las monedas stablecoins son el vehículo principal que impulsa esta adopción. De los 730 mil millones de dólares recibidos en 2025, 324 mil millones de dólares se movieron a través de transacciones de stablecoin, un aumento interanual del 89%. En Brasil, más del 90% de todos los flujos de criptomonedas están relacionados con stablecoin, y en Argentina, las stablecoins representan más del 60% de la actividad.
De cara al futuro, se pronostica que el mercado latinoamericano de criptomonedas alcance los 442.6 mil millones de dólares para 2033, creciendo a una tasa anual compuesta de 10.93% a partir de 2025, según IMARC Group.
Para los comerciantes, la velocidad de adopción importa menos como titular que lo que lo está impulsando: una región de 650 millones de personas construyendo infraestructura financiera paralela en tiempo real, con stablecoins como base.
LATAM Crypto — By The Numbers
LATAM crypto by the numbers
Total on-chain volume
$730B
Total on-chain crypto volume received across LATAM in 2025 (~10% of global total)
+60% year-on-year
Stablecoin transaction volume
$324B
LATAM stablecoin transaction volume in 2025, reflecting surging demand for dollar-pegged assets
+89% year-on-year
Brazil's share of LATAM volume
~33%
Of all LATAM on-chain volume received by Brazil in 2025, making it the region's dominant crypto market
~250% annual growth
Annual remittance market
$142B
Annual remittance flows across Latin America, with an increasingly large share now settled in stablecoins
Stablecoin-settled
El giro institucional
Durante la mayor parte de la historia criptográfica de LATAM, la adopción fue de abajo hacia arriba. Los usuarios minoristas no bancarizados o subbancarizados impulsaron los volúmenes a través de los intercambios locales. Ese panorama ahora está cambiando en el extremo superior del mercado.
En febrero de 2026, Crypto Finance Group, parte del principal operador de intercambio global Deutsche Börse Group, anunció su expansión en América Latina, dirigida a bancos, administradores de activos e intermediarios financieros que buscan custodia de grado institucional e infraestructura comercial.
Los bancos tradicionales y las fintechs están siguiendo su ejemplo. Nubank ahora recompensa a los clientes por tener USDC. La bolsa B3 de Brasil aprobó los primeros ETF spot XRP y SOL del mundo, por delante de Estados Unidos, en 2025. Los intercambios centralizados, incluidos Mercado Bitcoin, NovaDax y Binance, han listado colectivamente más de 200 nuevos pares comerciales denominados en BRL desde principios de 2024.
En marzo de 2025, la fintech brasileña Meliuz se convirtió en la primera empresa que cotiza en bolsa en el país en lanzar una estrategia de acumulación de Bitcoin, ahora con 320 BTC.
“La adopción de criptomonedas en América Latina ya es a escala global. Lo que el mercado necesita ahora es una gobernanza de nivel institucional, y esa es exactamente la razón por la que estamos aquí”, dijo Stijn Vander Straeten, CEO de Crypto Finance Group
Caso de uso de remesas criptográfico
América Latina recibe cientos de miles de millones de dólares anualmente de trabajadores en el extranjero, haciendo de las remesas uno de los casos de uso criptográfico más concretos y medibles de la región. Los servicios de transferencia tradicionales cobran un promedio de 6.2% por transacción. En una transferencia de US$300, eso equivale a aproximadamente US$20 en honorarios.
La infraestructura basada en blockchain en términos más generales ofrece reducciones dramáticas de tarifas. Bitcoin eleva los costos a alrededor de US$3.12 por cada US$100 transferidos. Mientras que las alternativas más baratas como XRP o la infraestructura de capa 2 de Ethereum pueden reducir eso a menos de US$0.01.
Para un trabajador migrante que envía US$1,500 a su casa a Perú, cambiar de un banco heredado ahorra más que el salario semanal promedio peruano solo en honorarios.
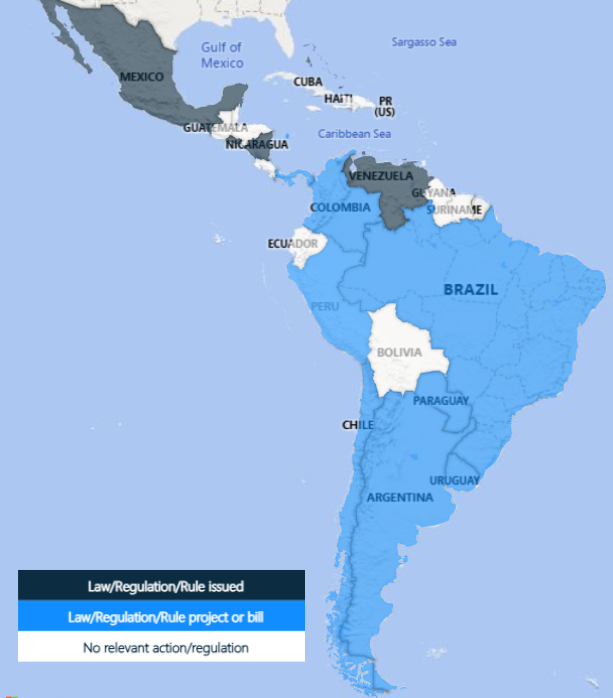
Entorno regulatorio criptográfico de LATAM
La variable que más determinará si LATAM está a la altura de su potencial 2026 es la regulación criptográfica. Y aquí, el panorama es genuinamente mezclado.
Brasil lidera la región con su Ley de Activos Virtuales, que cubre la segregación de activos, licencias VASP, requisitos AML/KYC y estándares de capital. También implementó la Regla de Viajes para las transferencias nacionales de VASP, que entró en vigor en febrero de 2026. Sin embargo, algunas propuestas más controvertidas, incluido un límite de 100.000 dólares estadounidenses en las transacciones transfronterizas de monedas stablecoin y la prohibición de las transferencias de billetera de autocustodia, siguen bajo consulta activa.
La Ley Fintech 2018 de México sigue siendo uno de los primeros reconocimientos formales del mundo de activos virtuales. La Ley Fintech de Chile de 2023 estableció licencias para intercambios, billeteras y emisores de stablecoin, reconociendo formalmente los activos digitales como 'dinero digital'.
Bolivia revirtió una prohibición criptográfica de una década en junio de 2024 al autorizar transacciones reguladas de activos digitales. Argentina introdujo el registro obligatorio de intercambio en 2025. Y El Salvador continúa expandiendo las iniciativas económicas tokenizadas a pesar de eliminar el estatus de moneda de curso legal de Bitcoin.
Diez países de la región ahora tienen marcos criptoactivos formales de algún tipo. Pero para los comerciantes, la divergencia regulatoria sigue siendo un riesgo real, y dado que Brasil recibe casi un tercio de todo el volumen criptográfico de LATAM, cualquier reversión significativa de la política allí podría tener consecuencias descomunales.
El impulso institucional de Brasil es la tendencia estructural más significativa. Con 318.8 mil millones de dólares en volumen en cadena en 2025, Brasil es efectivamente el mercado LATAM.
El resultado de la consulta de la stablecoin brasileña podría tener una gran influencia. Una restricción a las monedas stablecoins extranjeras en los pagos nacionales afectaría directamente a la clase de activo más negociada en el mercado dominante de la región.
Argentina es la jugada de volatilidad. La penetración mensual de usuarios activos del 12% y 5.4 millones de descargas de aplicaciones criptográfico en 2025 señalan una participación profunda y creciente del retail.
Colombia es un mercado de alerta temprana a vigilar. La depreciación del 5.3% del peso en 2025 y la profundización de la crisis fiscal están impulsando las entradas de stablecoin en un patrón que refleja la trayectoria de Argentina en años anteriores. Si la situación macro de Colombia se deteriora aún más, la adopción de criptomonedas podría acelerarse.
También hay un riesgo de concentración cambiaria en juego. Binance Crypto Exchange es el principal intercambio para más del 50% de los usuarios de criptomonedas de LATAM. Si el intercambio enfrenta alguna acción regulatoria, interrupción operacional o choque competitivo, podría tener un impacto desmedido en el mercado.
Conclusión
El mercado criptográfico de América Latina ha entrado en una nueva fase. Los impulsores estructurales que causaron la cripto-demanda inicial en la región no han desaparecido: la inflación, las remesas, la exclusión financiera y la inestabilidad monetaria siguen en juego.
Lo que ha cambiado es la capa que se construye encima de ellos. Infraestructura institucional, marcos regulatorios, adopción de tesorería corporativa y capital cambiario global que fluía hacia una región que, hasta hace poco, era en gran medida autónoma.
El crecimiento del volumen cercano al -250% de Brasil en 2025 y su posición recibiendo casi un tercio de todas las criptomonedas de LATAM son los desarrollos definitorios del mercado. Su trayectoria regulatoria, las decisiones de política de stablecoin y la cartera de ETF marcarán efectivamente la pauta para la región en 2026.
Para los comerciantes, las cifras generales de crecimiento son reales, pero también lo son los riesgos de concentración, las incertidumbres regulatorias y las divergencias a nivel de país que se encuentran debajo de ellos.
El 28 de febrero de 2026, cuando comenzó el ataque conjunto de Estados Unidos e Israel, los números en las pantallas comenzaron a moverse de maneras que se sentían clínicas, incluso cuando la realidad sobre el terreno con las trágicas muertes de víctimas civiles en Irán, se sentía todo menos. Los mercados, como dicen, no tienen una brújula moral, más bien tienen una máquina de pesaje y ahora mismo, están sopesando la transición de toda la economía global de un modelo “justo a tiempo” a un ciclo “justo por si acaso”.
Lo que los mercados estaban señalizando
El 2 de marzo, la cinta índice se mantuvo cautelosa mientras que la defensa subió. Históricamente, los conflictos pueden acelerar la reposición y los pedidos, pero su tamaño (y qué tan rápido) aún depende de los presupuestos, las aprobaciones y los cuellos de botella en la entrega.
Los ganadores
1. Hanwha Aerospace (012450.KS)
Hanwha es uno de los nombres comercializados más activamente vinculados al tema “K-Dence”, una empresa que los mercados cada vez más se ve como un proveedor escalable en un ciclo global de artillería y municiones cada vez más estricto. Capacidad y credibilidad de entrega.
Cuando la reposición se vuelve urgente, la capacidad de producir a escala a menudo importa tanto como la plataforma misma. La demanda de exportación vinculada a sistemas como el K9 Thunder y Chunmoo ha reforzado la narrativa del flujo de pedidos duradero incluso cuando los resultados aún giran en torno a presupuestos, aprobaciones y plazos de entrega.
Cosas clave que pueden mover el sentimiento: actualizaciones de libros de pedidos, cadencia de producción y cualquier anuncio de exportación posterior.
2. Northrop Grumman (NOC)
Northrop se centró en la medida en que los inversores revalorizaron la exposición a la modernización estratégica y a los programas grandes y de larga duración. Los mercados de defensa a menudo vistos como de misión crítica pueden persistir a lo largo de los ciclos. Se trata menos de una cuarta parte y más sobre si el impulso se mantiene estable si las prioridades de modernización se mantienen en su lugar (y si los plazos cambian si no lo hacen).
Variables clave que pueden mover el sentimiento: El ritmo de adquisición, el calendario del contrato y el lenguaje de financiación relacionado con el programa.
3. Corporación RTX (RTX)
RTX volvió al centro de la cinta cuando los inversores fijaron el precio de un ciclo de reposición de interceptores y la economía de la defensa aérea de alto tempo. El desgaste es costoso y cuando las tasas de uso aumentan, los gobiernos generalmente tienen que reponer inventarios y, en muchos casos, financiar la expansión de la producción, lo que puede extender la acumulación de trabajo y aumentar la visibilidad de los ingresos.
Variables clave que pueden mover el sentimiento: Pedidos de reabastecimiento, indicadores de expansión de fabricación y rendimiento de entrega.
4. Lockheed Martin (LMT)
Lockheed llamó la atención ya que los mercados se centraron en la demanda de defensa antimisiles y la pregunta a la que se enfrenta cada mesa de compras en un entorno de alto ritmo: ¿qué tan rápido se pueden reconstruir los inventarios? Si la utilización se mantiene elevada, los ganadores tienden a ser los contratistas mejor posicionados para escalar la producción y entregar de manera confiable. La exposición de defensa antimisiles de Lockheed la mantiene estrechamente ligada a esa narrativa de reposición.
Variables clave que pueden mover el sentimiento: señales de rampa de producción, economía unitaria y cadencia de pedidos basada en el presupuesto.
5. Sistemas BAE (BA.L)
Con un atraso de 83.600 millones de libras esterlinas y un papel central en el programa submarino AUKUS, BAE se centró en el enfoque a medida que partes de Europa señalaban mayores ambiciones de gasto en defensa. La acción subió un 6.11% a un máximo de 52 semanas en medio de una rotación de “riesgo”, con los comerciantes observando los hitos de AUKUS y las adquisiciones europeas de defensa aérea y antimisiles, incluido “Sky Shield”.
Variables clave que pueden mover el sentimiento: Un catalizador potencial es cualquier claro aumento en el gasto alemán que eleve el flujo de pedidos en las unidades europeas de BAE, mientras que los riesgos clave incluyen un fuerte aumento en los rendimientos dorados del Reino Unido, una volatilidad renovada de la libra esterlina o una “amenaza de paz” la toma de ganancias.
800
Los perdedores: no todas las 'existencias de guerra' suben
6. AeroEnvironment (AVAV)
AeroVironment se desplomó 18% al aire libre antes de caer 17% intradiaria tras los informes de que la Fuerza Espacial de Estados Unidos estaba reabriendo un contrato de 1.400 millones de dólares. La medida destaca cómo los procesos de adquisición y el riesgo de contratos pueden impulsar la volatilidad, incluso en entornos temáticos de apoyo.
7. Defensa Kratos (KTOS)
Kratos se sienta en el tema de los drones y las municiones que se hacen malograntes que llamó la atención a medida que se intensificaba el conflicto en Oriente Medio. Las acciones aún se vendieron después de las ganancias, lo que destaca un riesgo común del sector de defensa. Kratos anunció una gran oferta de acciones de seguimiento en el rango de US$1.200 millones a US$1.400 millones, la medida fortalece el balance y puede apoyar futuras inversiones en programas.
Para los comerciantes enfocados en narrativas de “prima de conflicto” a corto plazo, la dilución puede cambiar rápidamente la configuración. Incluso cuando las condiciones de demanda parecen favorables, el mercado puede reponer el precio de las acciones si cada accionista finalmente posee una porción más pequeña del negocio.
8. Máquinas intuitivas (LUNR)
Algunos nombres especulativos de tecnología espacial se quedaron rezagados, ya que los inversores parecían favorecer a las empresas con ingresos vinculados a la defensa más establecidos.
9. Boeing (BA)
Boeing bajó alrededor de 2.5% en la sesión. Si bien su división de defensa es significativa, su negocio comercial puede ser más sensible a la demanda de aviación, las interrupciones del espacio aéreo y los movimientos de los precios del petróleo.
10. Spirit AeroSystems (SPR)
Spirit AeroSystems sigue estrechamente ligado al ciclo mundial de producción de aeronaves como importante proveedor de aeroestructuras.Los resultados recientes mostraron pérdidas cada vez mayores a pesar del aumento de las ventas, lo que refleja aumentos en los costos de producción en los principales programas de aeronaves. Estas presiones han pesado sobre la confianza de los inversionistas en las perspectivas a corto plazo. La adquisición planificada por parte de Boeing podría, en última instancia, remodelar la posición de la compañía en la cadena de suministro, pero el riesgo de ejecución y la estabilidad de la producción siguen siendo fundamentales para la forma en que el mercado cotiZA las acciones.
Qué ver a continuación
Escalamiento vs desescalamiento: Un cambio hacia la diplomacia o las discusiones sobre el alto el fuego pueden cambiar rápidamente el sentimiento en torno a las acciones de defensa.
Petróleo y transporte marítimo: Los picos energéticos pueden endurecer las condiciones financieras y presionar a los sectores cíclicos.
Presupuestos y premios: Los movimientos de precios a veces pueden preceder a las decisiones contractuales, y la claridad llega cuando se finalizan las adjudicaciones.
Capacidad de producción: Las empresas con un historial probado de producción y entrega a menudo atraen la mayor atención de los inversores.
Restricciones de la cadena de suministro: Las tierras raras, la propulsión y la electrónica siguen siendo cuellos de botella potenciales que pueden limitar la rapidez con la que la producción escala.
La lente a más largo plazo
El conflicto iraní de 2026 es ante todo una tragedia humana. Para los mercados, también puede representar un cambio en la forma en que se prioriza el gasto en seguridad nacional dentro de los marcos fiscales. Si el gasto en defensa se mantiene elevado en un horizonte multianual, las empresas con capacidad de fabricación escalable y pilas de tecnología integradas podrían atraer la atención sostenida de los inversores. Dicho esto, los mercados se mueven en ciclos. Los temas estructurales pueden persistir, pero también pueden repreciar rápidamente cuando cambian las suposiciones. Mantenerse analítico y consciente de los riesgos sigue siendo fundamental.
Las referencias a empresas, sectores o movimientos del mercado específicos se proporcionan únicamente para comentarios generales del mercado y no constituyen una recomendación, oferta o solicitud para comprar o vender ningún producto financiero.Las reacciones del mercado a eventos geopolíticos o macroeconómicos pueden ser volátiles e impredecibles, y los resultados pueden diferir materialmente de las expectativas.