IPO와 알아야 할 사항

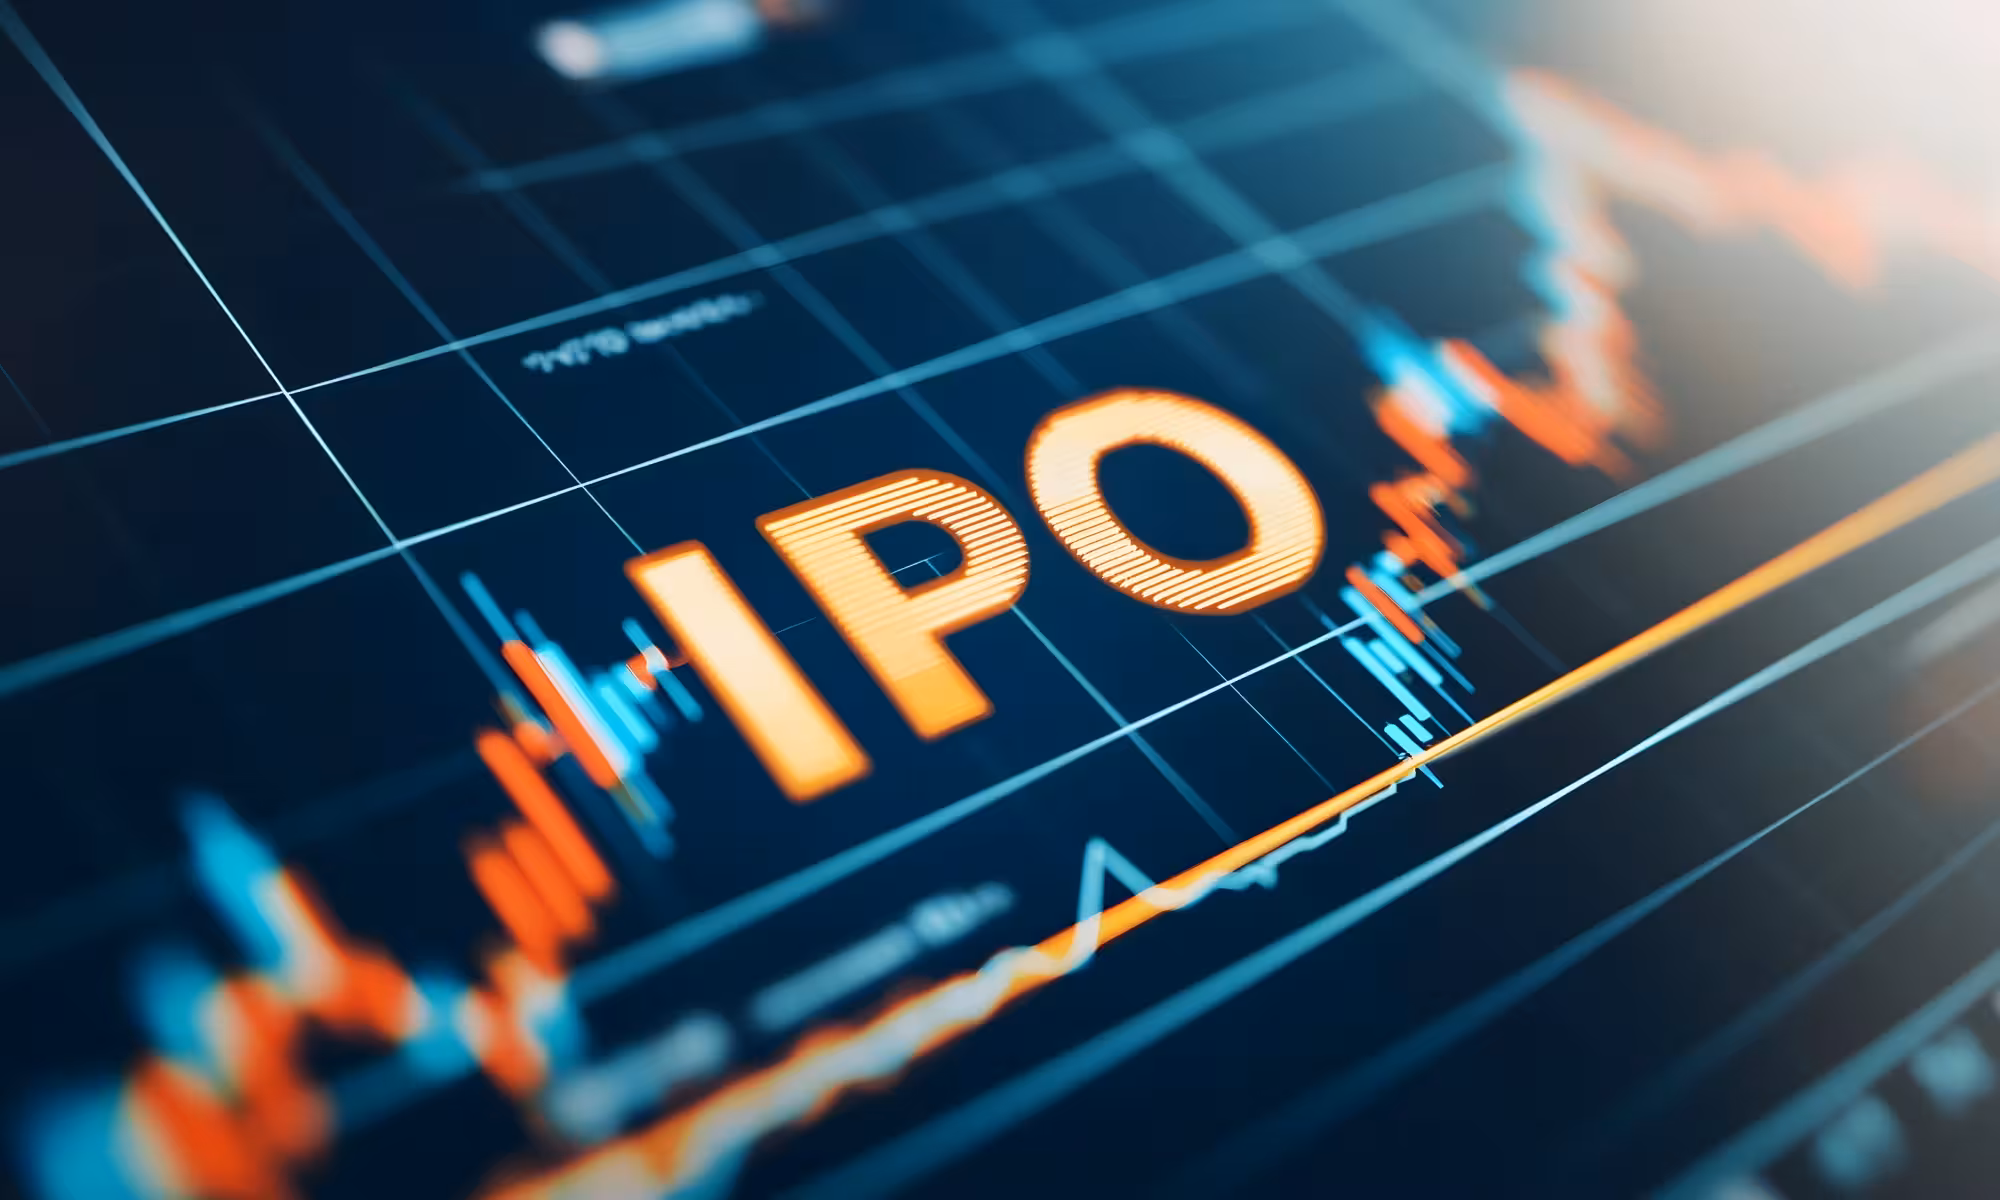
이는 '비공개' 기업이 '공개' 기업으로 전환되는 지점입니다. 시장은 OpenAI, SpaceX, 그리고 새로운 ASX 상장 후보들의 내부를 처음으로 제대로 들여다보게 됩니다.

IPO란 무엇인가요?

기업공개(IPO)는 비상장 기업이 처음으로 일반 대중에게 주식을 제공하는 것을 말합니다. IPO 전에는 주식이 보통 창업자, 초기 직원, 사모 투자자에게만 보유되지만, 상장하면 더 넓은 시장에서 해당 주식에 접근할 수 있게 됩니다.

트레이더에게 IPO는 한 기업의 주식에 직접 노출될 수 있는 첫 기회일 수 있습니다. IPO는 높은 변동성과 관심이 집중되는 독특한 환경을 만들 수 있지만, 가격 이력이 제한적이고 투자 심리가 빠르게 변할 수 있어 더 높은 위험도 수반합니다.

US$171.8 billion

2025년 글로벌 IPO 조달액, 전년 대비 39% 증가

US$3 trillion plus

2026년 주요 IPO 후보 기업의 합산 추정 가치

1,293

2025년 글로벌 상장 건수, 팬데믹 이후 호황기 이후 가장 큰 반등

글로벌 거래소의 예정 IPO

회사추정 가치거래소상태
Anthropic
Artificial intelligence
~US$350 billionNasdaqRumoured
Databricks
AI and data
~US$134 billionNasdaqExpected
Firmus Technologies
AI infrastructure
~A$6 billionASXExpected
Greencross
Pet care & veterinary
~A$4 billion plusASXRumoured
OpenAI
Artificial intelligence
~US$850 billionNasdaqExpected
Rokt
E-commerce adtech
~US$7.9 billionNasdaq and ASX CDIExpected
SpaceX
Aerospace and AI
~US$1.5 trillionNasdaqExpected
Stripe
Fintech
~US$140 billionNYSE/NasdaqRumoured
출처: 2026년 4월 21일 기준 공개된 회사 발표, 거래소 자료, 신뢰할 수 있는 언론 보도 및 시장 논평. 추정 가치, 거래소 및 상장 상태는 참고용일 뿐이며 사전 통지 없이 변경될 수 있습니다.

미국 IPO 후보 기업

SpaceX, OpenAI, Anthropic 등

더 읽기

ASX IPO 후보 기업

Firmus Technologies, Greencross 등

더 읽기

상장 절차는 어떻게 진행되나요

이사회 회의실에서 거래소 현장까지

상장일이 되면 기관투자자들은 보통 이미 해당 기업을 평가한 상태입니다. 6단계 과정을 이해하면 트레이더는 주식이 더 넓은 시장에서 거래되기 전에 어떤 요인이 이미 가격에 반영되었을 수 있는지 파악할 수 있습니다.

준비

회사는 재무 상태, 지배구조 및 시장 포지셔닝을 평가할 주관사를 선정합니다.

등록

주관사는 실사를 수행하고 관련 규제기관에 공시 서류를 제출합니다.

로드쇼

경영진은 기관투자자와 애널리스트에게 회사를 설명합니다. 이 단계에서 수요가 형성되고 가격 기대치가 설정되며, 이는 개인 트레이더가 해당 주식을 보기 전입니다.

가격 결정

로드쇼 피드백을 바탕으로 주관사는 최종 주가를 정하고 발행할 주식 수를 결정합니다.

상장일

주식은 선택된 거래소에서 거래를 시작합니다. 대부분의 트레이더에게 이는 해당 주식을 거래할 첫 기회입니다.

IPO 이후

상장 이후 회사는 정기적으로 재무 실적을 발표하고 해당 거래소의 지배구조 기준을 충족해야 합니다.

CFD로 IPO 거래하기

CFD가 IPO 변동성에 적합한 이유

IPO 상장일은 큰 투자심리 변동과 제한적인 가격 이력으로 특징지어지는 경우가 많습니다. 이러한 조합은 전통적인 매수 후 보유 방식의 노출 관리를 더 어렵게 만들 수 있습니다. CFD는 트레이더가 가격 움직임의 양방향에 대해 견해를 취하고, 포지션 규모를 정밀하게 조절하며, 상황 전개에 빠르게 대응할 수 있게 합니다.

롱 또는 숏 포지션

초기 급등 또는 열기 이후 조정을 거래하세요. CFD를 통해 상장일 이후 어느 방향으로든 포지션을 취할 수 있습니다.

더 짧은 투자 기간

IPO 변동성은 보통 첫 며칠과 몇 주에 집중되는 경향이 있습니다. CFD는 이러한 짧고 이벤트 중심적인 기간에 적합합니다.

내장형 리스크 도구

손절매와 지정가 주문은 진입 전에 위험을 정의하는 데 도움이 될 수 있으며, 가격 발견이 아직 진행 중일 때 특히 중요합니다.

미국 및 호주 시장 커버리지

하나의 계좌로 Rokt 및 Firmus Technologies와 같은 종목을 포함한 미국 및 호주 시장의 주식 CFD에 접근하세요.

IPO 순간을 거래할 준비가 되셨나요?

빠른 체결, 경쟁력 있는 가격, 내장형 리스크 관리 도구로 미국 및 호주 주식 CFD에 접근하세요.

IPO 순간을 거래할 준비가 되셨나요?

빠른 체결, 경쟁력 있는 가격, 내장형 리스크 관리 도구로 미국 및 호주 주식 CFD에 접근하세요.

시작하기

뉴스 및 분석

마이크로소프트, 알파벳, 엔비디아는 클라우드 및 기업 소프트웨어부터 맞춤형 칩과 데이터센터 수요에 이르기까지 AI 인프라 구축의 중심에 있습니다. 이들의 다가오는 실적은 막대한 자본 지출이 매출, 마진, 그리고 지속 가능한 경쟁 우위로 이어지는지 보여주는 데 도움이 될 수 있습니다.
AI
US Earnings
마이크로소프트, 알파벳, 엔비디아가 AI가 그만한 가치가 있는지 보여줄까요?

4월 미국 기업들의 실적 발표 시즌은 단순한 이야깃거리 이상의 것을 원하는 시장에 도래했습니다. JP모건 은 이미 강력한 실적으로 높은 기준을 제시했으며, 이제 관심은 S&P 500의 핵심 동력원인 AI 인프라로 옮겨가고 있습니다. 이 이야기의 중심에는 세 기업이 있습니다.

이번 실적 발표 기간이 AI에 중요한 이유

마이크로소프트, 알파벳, 엔비디아는 AI 사이클의 단순한 참여자가 아닙니다. 이들은 다른 기업들이 의존하는 물리적 및 소프트웨어 아키텍처, 즉 칩, 클라우드 리전, 모델, 도구를 구축하고 있습니다. 이러한 지출이 수익을 창출한다면, 그 첫 징후는 앞으로 몇 주 안에 발표될 이들의 분기별 실적에서 나타나기 시작할 수 있습니다.

각 기업은 각기 다른 시험대에 올라 있습니다.

  1. 마이크로소프트: 기업 AI 도입이 매출 및 마진 확대로 이어지는지 여부
  2. 알파벳: 칩부터 클라우드, 유통까지 전체 스택을 소유하는 것이 지속 가능한 이점인지, 아니면 단순히 방어하기에 비용이 많이 드는 위치인지 여부
  3. 엔비디아: 하드웨어 사이클이 여전히 유지되고 있는지, 가속화되고 있는지, 아니면 정체되기 시작하는지 여부

2026년에는 AI 투자가 이루어지고 있는지 여부는 더 이상 질문이 아닙니다. 자본 투입은 상당하며 이미 공개적으로 발표되었습니다. 문제는 그 지출이 투자의 규모를 정당화할 만큼 충분히 빠르게 수익을 창출하는지 여부입니다.

중요 고지: 기업 실적 발표 일정은 사전 예고 없이 변경될 수 있습니다. 확정 표시된 발표 일자 및 발표 시간은 해당 기업의 IR(기업설명회) 캘린더를 기초로 구성되었으며, 그 외의 일정은 GO Markets의 추정치입니다. 주당순이익(EPS), 매출액 컨센서스 및 애널리스트 추정치 범위(Range) 데이터는 제3의 시장 컨센서스 소스를 바탕으로 작성되었으며, 2026년 4월 16일 호주 동부표준시(AEST) 기준입니다. 별도의 명시가 없는 한 기업 가이던스, 수주잔고(Backlog) 및 주요 경영 지표는 해당 기업의 가장 최근 공시 자료 또는 실적 발표 프레젠테이션을 인용했습니다. 모든 수치 및 일정은 사전 고지 없이 변경될 수 있습니다.

$MSFT | 2026년 1분기 실적 발표 시즌

Microsoft Corporation

NASDAQ | 기술 섹터 | 2026년 4월 29일
일정 확정

글로벌 실적 발표 카운트다운 (장 마감 후)

00:00:00:00
컨센서스 EPS
US$4.04
매출액 컨센서스
US$814.0억
호주 / 아시아 4월 30일 | 오전 6:05
미국 / 중남미 4월 29일 | 오후 4:05
마켓 인텔리전스: $MSFT

심층 분석: 마이크로소프트 주가 동인 및 시나리오

Azure 성장률 가이드라인
37%에서 38%
고정환율 기준 전망치
AI 부문 기여도
+6-8%p
AI 서비스 기반 Azure 매출 성장폭
FY26 설비투자(CapEx)
US$1,460억
전체 인프라 지출 규모
평균
하단 US$3.86 평균(컨센서스) US$4.04 상단 US$4.14

현재 마이크로소프트는 핵심적인 시험대에 올라 있습니다. 막대한 AI 인프라 지출을 마진 개선으로 연결할 수 있는가에 대한 여부입니다. US$4.14를 상회하는 실적 결과가 확인된다면 시장 일각의 자본지출 피로감(Capex Fatigue) 우려를 완화하고 기업들의 AI 도입 확대와 함께 Azure 성장률이 재가속화되고 있음을 입증하는 계기가 될 수 있습니다.

주요 시장 변동성 촉발 요인

Azure 성장률 추이
고정환율 기준 성장률이 39%를 넘어서며 재가속화되는지 주시해야 합니다. 이는 신규 확장된 인프라가 유휴 상태에 머물지 않고 AI 워크로드로 정상 가동되고 있음을 시사합니다.
모니터링 시그널: 인프라 가동률
업무용 AI 에이전트 도입률
자율형 에이전트 체제로의 전환이 핵심입니다. Dynamics 365 내에서 가시적인 기업용 수요 증가가 포착된다면 고가형 구독 서비스 중심의 수익화 논거가 힘을 얻을 수 있습니다.
모니터링 시그널: 소프트웨어 수익화 부문
Maia 200 칩을 통한 비용 절감
자체 개발한 AI 칩이 실제 양산 단계에서 추론 비용을 낮추고 있다면 최근 압박을 받아온 매출총이익률(Gross Margin)의 회복세가 시작될 수 있습니다.
주요 관전 포인트: 매출총이익률 회복 여부
독과점 및 규제 환경 리스크
클라우드 서비스의 끼워팔기(Bundling) 관행에 대한 당국의 지속적인 조사는 잠재적 악재입니다. 이에 대한 경영진의 코멘트는 장기적 관점에서 필수 확인 요인입니다.
주요 관전 포인트: 끼워팔기 규제 준수 여부
시장 심리 분석 · Microsoft Corp.

인터랙티브 시나리오 분석: $MSFT

실적 시나리오 선택
AI 스케일링 가시화

인프라 투자의 결실, AI 성장의 실질적 증명

EPS US$4.14 상회 및 Azure 성장률 39% 초과 달성은 대규모 AI 설비투자가 실제 상업적 성과로 전환되고 있다는 강력한 방증입니다. 업무용 에이전트의 매출 기여도가 확인되고 2026 회계연도 가이던스가 상향 조정될 수 있습니다.
EPS 결과
US$4.14 상회
클라우드 시그널
성장 가속
가이던스 전망
상향 조정
예상 시장 반응
강한 랠리
출처 및 데이터 방법론

출처: 확정(Confirmed) 표시된 발표 일자 및 발표 시간은 기업의 공식 IR 캘린더를 기초로 구성되었으며, 그 외의 일정은 GO Markets의 추정치입니다. 주당순이익(EPS), 매출액 및 애널리스트 추정치 범위 데이터는 2026년 4월 16일 호주 동부표준시(AEST) 기준 Bloomberg 및 Earnings Whispers를 소스로 합니다. 가이던스, 수주잔고 및 경영 지표는 해당 기업의 가장 최근 공시 자료 또는 실적 발표 프레젠테이션을 인용했습니다. 본 시나리오 분석은 GO Markets의 독자적인 매크로 분석 결과를 반영한 것이며, 모든 수치와 일정은 사전 고지 없이 변경될 수 있습니다.

분석 커버리지 확대

반도체 밸류체인 그 너머

실질적인 수익화 능력을 입증해야 하는(‘Show me the money’) 한 해가 전개됨에 따라, 전력 및 인프라 등 전방위적인 AI 수요가 테슬라, 넥스트에라 에너지, 엑손모빌에 미치는 영향력을 다각도로 분석합니다.

기업용 소프트웨어에서 검색, 그리고 클라우드로의 체질 개선

알파벳(Alphabet)은 단순한 검색 엔진 기업을 넘어 거대한 AI 인프라 핵심 플레이어로 체질을 개선해 왔으며, 이번 실적은 이러한 패러다임 전환이 실제 유의미한 이익을 창출하고 있는지를 검증하는 리트머스 시험지가 될 것입니다. 2026년 연간 설비투자(CapEx) 전망치인 US$1,850억은 전년 대비 두 배에 육박하는 가공할 만한 수준입니다. 이처럼 막대한 인프라 지출이 자본을 대거 잠식하면서 올해 주당순이익(EPS)은 전년 동기 대비 소폭 둔화될 것으로 예상됩니다. 핵심 관건은 구글 클라우드(Google Cloud)의 성장 속도가 마진 회복으로의 확실한 경로를 보여줄 수 있는지, 그리고 7세대 자체 개발 AI 칩인 아이언우드(Ironwood)가 대규모 가동 환경에서 쿼리당 비용(Cost-per-query) 우위를 확실히 증명해 내는지 여부입니다.

$GOOGL | 2026년 1분기 실적 발표 시즌

Alphabet Inc.

NASDAQ | 기술 섹터 | 2026년 4월 29일
일정 확정

글로벌 실적 발표 카운트다운 (장 마감 후)

00:00:00:00
컨센서스 EPS
US$2.64
매출액 컨센서스
US$921.4억
호주 / 아시아 4월 30일 | 오전 6:30
미국 / 중남미 4월 29일 | 오후 4:30
마켓 인텔리전스: $GOOGL

심층 분석: 알파벳 주가 동인 및 시나리오

클라우드 부문 성장률
전년 동기 대비 48%
전분기 대비 비교 기준
아이언우드(Ironwood) TPU
최대 10배 성능
이전 세대 자체 개발 칩 대비
2026년 설비투자(CapEx)
US$1,850억
전년 지출액의 두 배 규모
평균
하단 US$2.50 평균(컨센서스) US$2.64 상단 US$2.80

알파벳은 이제 단순 검색 엔진을 넘어 광범위한 AI 인프라 핵심 플레이어로 인식되고 있습니다. 관건은 연간 US$1,850억 규모의 대규모 인프라 지출이 자본을 대거 잠식하는 상황에서 클라우드 부문의 성장이 마진 회복으로의 확실한 경로를 지지할 수 있는지 여부입니다.

주요 시장 변동성 촉발 요인

구글 클라우드 성장 모멘텀
시장은 전년 대비 48%의 성장률이 유지될 수 있는지 주시하고 있으며, 특히 대규모 AI 연산에 아이언우드 TPU를 도입하는 기업 고객들의 수요 추이가 핵심입니다.
모니터링 시그널: 기업용 AI 도입률
검색 및 AI 개요(AI Overview) 수익화
연산 집약적인 AI 요약 서비스가 광고 생태계를 통해 성공적으로 수익화된다면, 생성형 AI 시대에도 검색 비즈니스의 고유한 경제적 가치를 온전히 방어해낼 수 있습니다.
주요 관점: 검색 비즈니스의 경제성
설비투자 및 마진 변동 궤적
US$1,850억 규모의 설비투자 부담으로 인해 잉여현금흐름(FCF)이 압박을 받는 상황 속에서, 시장은 인프라 자본 지출이 언제쯤 정점을 지나 완화될지 확인하고자 합니다.
관전 포인트: 지출 상한선(Ceiling)
미 법무부(DOJ) 반독점 리스크
크롬(Chrome) 또는 안드로이드(Android) 사업부 강제 매각령 항소와 관련된 법적 분쟁 일정에 대해 경영진이 제시할 코멘트는 리스크 프리미엄 반영에 막대한 영향을 미칠 것입니다.
관전 포인트: 규제 당국의 시정 조치
시장 심리 분석 (Alphabet Inc.)

인터랙티브 시나리오 분석: $GOOGL

실적 시나리오 선택
효율성 입증

아이언우드 효율성이 이끄는 추가 상승 모멘텀

EPS US$2.80 상회 및 클라우드 성장률 45% 초과 달성은 아이언우드가 비용을 절감하고 구글의 비용 우위를 예상보다 빠르게 강화하고 있음을 시사합니다.
EPS 결과
US$2.80 상회
클라우드 시그널
강한 성장세
웨이모(Waymo)
성장 가속화
예상 시장 반응
투자심리 개선
출처 및 데이터 방법론

출처: 확정(Confirmed) 표시된 발표 일자 및 발표 시간은 기업의 공식 IR 캘린더를 기초로 구성되었으며, 그 외의 일정은 GO Markets의 추정치입니다. 주당순이익(EPS), 매출액 및 애널리스트 추정치 범위 데이터는 2026년 4월 16일 호주 동부표준시(AEST) 기준 Bloomberg 및 Earnings Whispers를 소스로 합니다. 가이던스, 수주잔고 및 경영 지표는 해당 기업의 가장 최근 공시 자료 또는 실적 발표 프레젠테이션을 인용했습니다. 본 시나리오 분석은 GO Markets의 독자적인 매크로 분석 결과를 반영한 것이며, 모든 수치와 일정은 사전 고지 없이 변경될 수 있습니다.

NVIDIA: 하드웨어 사이클 파급효과 점검

엔비디아(NVIDIA)는 이제 단순한 반도체 설계 기업이 아닙니다. 매크로 애널리스트들이 '연산의 중앙은행'이라 규정하는 존재로 거듭났으며, 전 세계가 실제로 배치할 수 있는 AI 인프라 용량(CapEx 가동 한계)을 결정하는 독점적 공급 주체입니다.

이번에 발표되는 2027 회계연도 1분기 실적은 예상보다 빠르게 양산에 돌입한 차세대 '베라 루빈(Vera Rubin) R100' GPU 아키텍처가 벌써 실질적인 매출에 기여하고 있는지 검증하는 무대가 될 것입니다. 아울러 AI 시장의 주도권이 초기 인프라 구축(학습) 단계에서 상업적 서비스 운영(추론) 단계로 넘어가는 과정에서 엔비디아가 75% 이상의 높은 매출총이익률을 지속할 수 있을지가 핵심 관전 포인트입니다. 추론 워크로드는 학습에 비해 기술적 진입 장벽이 낮고 가격 민감도가 높기 때문에, 이 구역에서의 마진 견고성이야말로 엔비디아의 장기 지배력을 방어하는 핵심 변수입니다.

$NVDA | 2026년 1분기 실적 발표 시즌

NVIDIA Corporation

NASDAQ | 반도체 섹터 | 2026년 5월 20일
일정 확정

글로벌 실적 발표 카운트다운 (장 마감 후)

00:00:00:00
컨센서스 EPS
US$1.70
매출액 컨센서스
US$784.2억
호주 / 아시아 5월 21일 | 오전 6:30
미국 / 중남미 5월 20일 | 오후 4:30
마켓 인텔리전스: $NVDA

심층 분석: 엔비디아 주가 동인 및 시나리오

매출 성장세
전년 동기 대비 73%
전분기 비교 기준 지표
데이터센터 매출 비중
91% 이상
전체 매출액 내 차지 비율
루빈(Rubin) R100
양산 가동 중
2026년 4월 대량 양산 돌입
평균
하단 US$760억 평균(컨센서스) US$780억 상단 US$810억 이상

엔비디아의 향후 전망은 생성형 AI 수요가 추론 워크로드 중심으로 재편되는 상황 속에서 차세대 루빈 R100이 매출총이익률을 75% 선에서 방어해낼 수 있는지에 달려 있습니다. 추론 장세는 기존 인프라 학습 단계에 비해 단가 민감도가 훨씬 높기 때문에 이 구간에서의 마진 검증이 핵심 리트머스 시험지입니다.

주요 시장 변동성 촉발 요인

루빈(Rubin) 생산 확대 속도
기존 블랙웰(Blackwell) 아키텍처 전환 과정에서 공급망 노이즈 없이 루빈의 생산 규모를 안정적으로 확대해 나가는지 주시해야 합니다.
모니터링 시그널: 공급망 연속성
추론 부문 마진 견고성
가장 중대한 시험대는 추론 부문의 매출 비중이 늘어나는 상황에서도 매출총이익률을 75% 이상 수준으로 견고하게 유지할 수 있는지 여부입니다.
모니터링 시그널: 가격 결정력 방어력
소버린 AI(Sovereign AI) 수요 가시화
유럽 및 중동 지역의 정부 주도 독자 인프라 투자는 빅테크 하이퍼스케일러에 편중되어 있던 핵심 고객 기반을 다변화하는 계기가 될 수 있습니다.
모니터링 시그널: 신규 시장 확장세
CUDA 생태계 규제 위험성
미국이나 유럽 규제 당국이 엔비디아의 독점적 소프트웨어 플랫폼(CUDA) 해자에 대해 조사에 나설 경우, 매출 결과와 무관하게 리스크 프리미엄을 자극할 수 있습니다.
모니터링 시그널: 소프트웨어 경제적 해자 재평가
시장 심리 분석 · NVIDIA Corp.

인터랙티브 시나리오 분석: $NVDA

실적 시나리오 선택
루빈 양산 속도 가속화, 추가 성장 동력 지지

루빈 양산 속도 가속화, 추가 성장 동력 지지

매출액 US$810억 상회 결과는 차세대 루빈 아키텍처의 생산량 확대가 원래 시장 기대치보다 앞당겨 진행되고 있음을 방증합니다. 이는 인프라 수요가 각국 정부의 소버린 AI 및 일반 기업 엔터프라이즈 마켓으로 무난히 다변화되고 있다는 논거를 지지하며, 향후 2027년까지의 실적 가시성을 추가로 확보해 줄 수 있습니다.
매출액 결과
US$810억 상회
매출총이익률
75% 상회
주요 워크로드
추론 부문 견고
예상 파급효과
긍정적 시장 견인
출처 및 데이터 방법론

출처: 확정(Confirmed) 표시된 발표 일자 및 발표 시간은 기업의 공식 IR 캘린더를 기초로 구성되었으며, 그 외의 일정은 GO Markets의 추정치입니다. 주당순이익(EPS), 매출액 및 애널리스트 추정치 범위 데이터는 2026년 4월 16일 호주 동부표준시(AEST) 기준 Bloomberg 및 Earnings Whispers를 소스로 합니다. 가이던스, 수주잔고 및 경영 지표는 해당 기업의 가장 최근 공시 자료 또는 실적 발표 프레젠테이션을 인용했습니다. 본 시나리오 분석은 GO Markets의 독자적인 매크로 분석 결과를 반영한 것이며, 모든 수치와 일정은 사전 고지 없이 변경될 수 있습니다.

이번 실적 발표 윈도우가 시장 전반에 결정적인 이유

마이크로소프트와 알파벳이 4월 29일 같은 날 저녁에 실적을 공시합니다. 이로 인해 4월 30일로 이어지는 야간 세션은 글로벌 주식 시장에서 올해 가장 정보 밀도가 높은 변곡점이 될 전망입니다. 국내 및 호주 트레이더들의 경우 한국 시간(KST) 기준 4월 30일 목요일 오전 5시 30분(호주 동부표준시 오전 6시 30분)이면 양사의 결과를 모두 확인할 수 있습니다. 이는 국내 증시(KOSPI) 및 호주 증시(ASX)가 개장하기 전, 미국 지수 선물의 가격 변동을 통해 시장 심리가 이미 선반영될 수 있음을 시사합니다.

엔비디아는 이보다 늦은 5월 말에 실적을 발표하지만, 그 사이에 전개되는 모든 테크 섹터 흐름에 거대한 그림자를 드리우고 있습니다. 엔비디아가 제시했던 2027 회계연도 1분기 매출액 가이드라인인 US$780억은 지난 몇 달간 글로벌 금융 시장이 리스크의 척도로 삼아온 기준점입니다. 만약 마이크로소프트와 알파벳의 실적에서 AI 인프라 수요 둔화 시그널이 포착된다면, 5월 엔비디아 주주총회와 실적 발표를 앞두고 시장의 기대치가 대대적으로 하향 조정될 수 있습니다. 반대로 양사 모두 컨센서스를 상회하며 클라우드 부문의 성장 가속화를 증명한다면, 엔비디아 실적의 하방 지지선(Floor)은 한층 높아질 가능성이 있습니다.

이러한 빅테크 간의 긴밀한 역학적 상호작용이야말로 이번 실적 시즌을 여타 어닝 윈도우와 차별화하는 핵심 요소입니다. 이번 결과는 개별 기업의 주가에 그치지 않고, 지난 2년간 글로벌 증시의 주도권을 장악해 온 테크 부문 투자 슈퍼사이클의 펀더멘탈 건전성을 가늠하는 척도가 될 수 있습니다.

판도를 뒤흔들 수 있는 3대 매크로 리스크

단순히 공시 수치(정량 데이터)의 헤드라인 상회 여부와 무관하게, 전체 시장 서사의 물줄기를 바꿀 수 있는 세 가지 구조적 리스크가 존재합니다. 실적 카운트다운이 끝나기 전 반드시 짚어봐야 할 대목입니다.

1

설비투자 피로감 (Capex Fatigue)

마이크로소프트와 알파벳의 실적이 컨센서스에 그치거나 하회하는 와중에 천문학적인 자본 지출 계획만 재확인된다면, 시장은 AI 수익화 속도가 인프라 지출 비용을 따라가지 못한다는 위험을 가격에 반영하기 시작할 수 있습니다. 이는 특정 종목에 국한된 악재가 아닙니다. AI가 조만간 가시적인 자본 이익률(ROI)을 가져다줄 것이라는 전제하에 높은 멀티플을 받아온 기술주 전반의 밸류에이션 디레이팅(집단 하락) 국면으로 번져갈 리스크가 있습니다.

2

규제 당국의 압박 본격화 (Regulatory Escalation)

미 연방거래위원회(FTC)의 마이크로소프트 조사, 법무부(DOJ)의 알파벳 반독점 소송, 그리고 엔비디아의 CUDA 소프트웨어 생태계에 대한 유럽연합(EU)의 전방위적 조사는 모두 현재 진행형인 사안들입니다. 실적 컨퍼런스 콜 직전에 새로운 소송 제기, 시정 조치 발표, 혹은 법원 판결 등 실질적인 법적 변수가 돌출된다면 재무 성적표의 호재를 완전히 덮어버릴 수 있습니다. 이 섹터의 규제 리스크는 추상적인 가설이 아니라 변동성을 유발하는 live 변수입니다.

3

자체 개발 칩(빅테크 커스텀 실리콘)과의 무한 경쟁

마이크로소프트의 마이아 200(Maia 200), 알파벳의 아이언우드(Ironwood) TPU, 아마존의 트레이니움(Trainium), 그리고 메타의 독자 가속기 칩들은 하이퍼스케일러들의 엔비디아 하드웨어 의존도를 낮추는 핵심 무기입니다. 만약 실적 발표 과정에서 이들 클라우드 거물 중 단 한 곳이라도 자체 칩 비중 확대를 이유로 GPU 조달 계획 축소 시그널을 보낸다면, 엔비디아가 제시할 당장의 실적이 아무리 뛰어날지라도 향후 선행 수주잔고(Order Book)에 대한 불확실성이 불거질 수 있습니다.

2026년 매크로 관점의 냉정한 현실 점검

$MSFT

AI 자본 지출이 단순한 비용 청구 단계를 넘어 독점적 경쟁 우위로 전환되는 시점입니다. 핵심은 영업이익률 마진이 이를 따라와 주느냐입니다.

$GOOGL

자체 칩부터 핵심 검색 비즈니스, 클라우드 아키텍처로 이어지는 수직 계열화가 강력한 경제적 해자가 될지, 아니면 천문학적인 방어 비용이 드는 수렁이 될지 시험대입니다.

$NVDA

글로벌 AI 하드웨어 사이클의 맥박 그 자체입니다. 차세대 루빈(Rubin) 아키텍처가 테크 부문의 투자 슈퍼사이클을 2027년까지 무난히 견인할 수 있을지 가늠할 이정표입니다.

투자 데스크 핵심 결론

마이크로소프트와 알파벳이 4월 29일 같은 날 실적을 공개하며, 엔비디아가 5월 말 그 뒤를 따릅니다. 이 세 거물의 실적 결합은 테크 부문의 고강도 인프라 자본 지출이 천문학적인 투자 자금 투입 속도에 걸맞은 상업적 회수율을 내고 있는지 평가할 가장 선명한 거시적 나침반이 될 것입니다. 당장 찍히는 주당순이익(EPS) 수치도 중요하지만, 각사 경영진이 밝힐 AI 수익화 타임라인, 설비투자(CapEx) 성장 궤적, 그리고 맞춤형 자체 칩 경쟁 구도 내에서의 생존 전략에 시장 심리가 더 크게 요동칠 수 있습니다.

GO Markets
April 16, 2026
Why Tesla NextEra and Exxon matter this earnings season, what to watch in Tesla earnings 2026, how AI power demand affects NextEra Energy, what Exxon Mobil earnings could signal for oil markets, Tesla Megapack growth outlook 2026, NextEra data centre power demand explained, Exxon Mobil oil supply risk outlook, energy stocks to watch in April 2026
AI
Commodity
Tesla, NextEra and Exxon: Oil vs. AI demand this US earnings season

April’s US earnings season is arriving in a market that is asking harder questions. It is no longer enough for companies to tell a good story. Traders want to see whether the physical side of the next cycle is turning into real revenue, steadier margins and clearer guidance.

That is why Tesla, NextEra Energy and Exxon Mobil matter this month. Each sits close to a theme the market is trying to price right now: autonomy, electricity demand and oil supply risk. They are very different businesses, but together they offer a useful read on where attention may be shifting when the market wants something more tangible.

In 2026, those signals are colliding with a high-friction backdrop:

  1. AI power demand is pushing utilities, storage and grid capacity into focus
  2. Tesla needs to show that autonomy and energy can support the next chapter beyond EV margins
  3. Oil supply risk has pushed energy security back into the conversation

Why this part of the market matters

The broader theme here is simple. AI still matters. Growth still matters. But this earnings season may also test the companies supplying the power, infrastructure and fuel behind that story.

For beginner to intermediate traders, this matters because these stocks can move for very different reasons. Tesla can trade on margins and product narrative. NextEra can trade on power demand and capital spending plans. Exxon can move with crude, refining margins and buyback confidence. Looking at them together gives traders a clearer way to think about how the market is pricing the real economy side of the 2026 story.

IMPORTANT: REPORTING SCHEDULES CAN CHANGE WITHOUT NOTICE. REPORTING DATES AND RELEASE TIMES ARE FROM COMPANY INVESTOR RELATIONS CALENDARS WHERE MARKED CONFIRMED; OTHERWISE THEY ARE GO MARKETS ESTIMATES. CONSENSUS EPS, REVENUE AND ANALYST-RANGE DATA ARE FROM THIRD-PARTY MARKET CONSENSUS SOURCES, AS OF 14 APRIL 2026 (AEST). COMPANY GUIDANCE, BACKLOG AND OPERATING METRICS ARE FROM THE LATEST COMPANY FILINGS OR RESULTS PRESENTATIONS UNLESS STATED OTHERWISE. FIGURES AND SCHEDULES MAY CHANGE WITHOUT NOTICE.

$TSLA | Q1 2026 REPORTING PERIOD

Tesla Inc.

NASDAQ | Consumer Discretionary | 23 Apr 2026
Confirmed

Global Release Countdown (AMC)

00:00:00:00
Consensus EPS
US$0.41
Consensus Revenue
US$22.26bn
AU/ASIA 24 Apr | 6:05 am
US/LATAM 23 Apr | 4:05 pm
Market Intelligence: $TSLA

Analysis: Tesla price drivers and scenarios

Auto Gross Margin
17-19%
Target floor, excl. credits
Megapack Growth
+25% YoY
Projected energy deployment
Analyst range
US$0.32-0.48
EPS estimate range
AVG
LOW US$0.32 AVG US$0.41 HIGH US$0.48

The US$0.16 analyst range shows there is still a lot of uncertainty. The main question is how weaker vehicle deliveries compare with stronger, higher-margin energy storage contributions. A result above US$0.48 would suggest the autonomy and battery story is improving faster than the bear case expects.

Key factors that could move the result

Automotive gross margin
This is the most important number for Tesla’s core business. Markets want to see whether price cuts have started to settle, or whether margins are still under pressure.
Benchmark: 17% (excluding credits)
Energy storage (Megapacks)
This is the more durable growth story. Strong Megapack deployment and battery margins could help offset weaker vehicle deliveries
Focus: Storage growth versus pressure in the auto business
Full Self-Driving (FSD) & Robotaxi
This is the main narrative driver. Markets will watch for updates on FSD adoption and the robotaxi timeline to judge whether the move towards “physical AI” is becoming more credible.
Watch: Timing for next-generation autonomy technology
Regulatory credits
This is a quality check on the result. If EPS is boosted too much by credit sales, some traders may see the beat as less durable.
Watch: How much credit sales contribute to final EPS
Trade Execution: $TSLA

Earnings reaction framework: Q1 2026

Bull case
EPS above US$0.45, energy margins at 20%+ | FSD take rates rising
The result clears the top-tier analyst range. Commentary focuses on FSD scaling and Megapack production ramps rather than vehicle discounting. FY26 guidance is reaffirmed.
Possible reaction: stronger momentum, with short covering adding support
Base case
EPS between US$0.38 and US$0.43, auto margins stable | Near target
The result is close to expectations, but there is no major surprise from the energy business. The market stays focused on the robotaxi timeline. The initial move may be limited if the product mix looks unchanged.
Possible reaction: range-bound trading or a muted early response
Bear case
EPS below US$0.35, auto margins drop below 16% | Signs of FSD delays
The result misses even cautious expectations. Rising inventory suggests more discounting may be needed. The market starts to question whether the level of spending on AI and autonomy is too high.
Possible reaction: rotation out of the stock, especially if growth confidence weakens
Sentiment Analysis · Tesla Inc.

Interactive scenario analysis: $TSLA

Select earnings outcome
Growth momentum

Strong result, helped by energy and FSD

FSD and Energy do better than expected, which helps offset weaker car deliveries. Management gives the market more confidence that autonomy is getting closer to real revenue. Auto margins staying above 17% would also help.
EPS Outcome
Above US$0.45
Energy Signal
On track
Margins
At or above 17%
Likely Reaction
Strong rally

Sources & Data Methodology Sources: Reporting dates and release times are from company investor relations calendars where marked Confirmed; otherwise they are GO Markets estimates. Consensus EPS, revenue and analyst-range data are sourced from Bloomberg and Earnings Whispers, as at 14 April 2026 (AEDT). Company guidance, backlog and operating metrics are sourced from the latest company filings, results presentations or investor relations materials unless stated otherwise. Any scenario analysis reflects GO Markets analysis. Figures and schedules may change without notice.

From autonomy to electricity

If Tesla is the market’s test of whether physical AI can become a business, NextEra is a test of whether the power buildout behind AI is starting to show up more clearly in utility economics.

That is what makes the shift from Tesla to NextEra interesting. One is about ambition and platform narrative. The other is about power, contracts, infrastructure and return on capital.

$NEE | Q1 2026 REPORTING PERIOD

NextEra Energy, Inc.

NYSE | Utilities | 24 Apr 2026
Confirmed

Global Release Countdown (BMO)

00:00:00:00
Consensus EPS
US$0.91
Consensus Revenue
US$7.17bn
AUSTRALIA (AEST) 24 Apr | 9:35 pm
ASIA (UTC+8) 24 Apr | 7:35 pm
Market Intelligence: $NEE

Analysis: NEE price drivers and scenarios

Backlog Conversion
~29.8 GW
Energy Resources total backlog
Growth Framework
8%+ Annual
Adjusted EPS growth through 2032
Analyst Range
US$0.88 - 1.06
Q1 estimate spread
AVG
LOW US$0.88 AVG US$0.92 HIGH US$1.06

Against the 2026 ‘year of proof’ theme, the key issue is whether upcoming results turn strategic announcements into clearer execution signals. NextEra is a test of whether the power buildout behind AI is starting to show up clearly in utility economics.

Trade Execution: $NEE

Earnings reaction framework: Q1 2026

Key signals to watch

Contract Quality
Watch for movement from customer interest (20+ GW) to signed large load agreements.
Signal: Large load monetization
Natural Gas Hub Strategy
Firmer milestones on the approved up to 10 GW natural gas buildout approved earlier this year.
Signal: Infrastructure execution
Funding Clarity
Monitoring the impacts of the US$2.3bn equity sale and any potential Japanese funding progress.
Signal: Financing risk management
Sentiment Analysis · NextEra Energy

Interactive scenario analysis: $NEE

Select earnings outcome
Execution Focus

"Utility Renaissance" validates via execution signals

EPS above US$1.06 shifts attention to execution. Management points to signed large load agreements and clearer milestones for natural gas buildout. Progress converting 29.8 GW backlog into construction-ready projects strengthens sentiment significantly.
EPS Outcome
Above US$1.06
Infrastructure Signal
Contracts Signed
Likely Reaction
Sentiment Strengthens
Sources & Data Methodology

Sources: Reporting dates and release times are from company investor relations calendars where marked Confirmed; otherwise they are GO Markets estimates. Consensus EPS, revenue and analyst-range data are sourced from Bloomberg and Earnings Whispers, as at 13 April 2026 (AEST). Company guidance, backlog and operating metrics are sourced from the latest company filings or results presentations. Any scenario analysis reflects GO Markets analysis. Figures and schedules may change without notice.

From power to oil

If NextEra reflects the electricity side of the real economy story, Exxon Mobil reflects the fuel side. That matters in a market where supply risk can still reset inflation expectations, shift sector leadership and change how traders think about defensiveness.

$XOM | Q1 2026 REPORTING PERIOD

Exxon Mobil Corporation

NYSE | Energy | 29 Apr 2026
Estimated

Global Release Countdown (BMO)

00:00:00:00
Consensus EPS
US$1.66
Consensus Revenue
US$82.47bn
AUSTRALIA (AEST) 29 Apr | 8:30 pm
ASIA (UTC+8) 29 Apr | 6:30 pm
Market Intelligence: $XOM

Analysis: XOM price drivers and scenarios

Liquids Pricing Effect
+$1.9B - $2.3B
Positive 1Q realized price support
Energy Products Timing
-$3.3B to -$4.1B
Unfavourable 1Q accounting drag
Analyst Range
US$1.60 - 1.85
Low to high Q1 estimate spread
AVG
LOW US$1.60 AVG US$1.66 HIGH US$1.85

Exxon is the clearest oil-linked test in the market. The key issue is whether stronger oil and gas pricing can outweigh volume disruptions (6% production hit) and massive negative timing effects from Energy Products.

Trade Execution: $XOM

Earnings reaction framework: Q1 2026

Key signals to watch

Price Support vs Volume
Did the $2.3B pricing tailwind absorb the 6% Middle East production disruption?
Signal: Realized price strength
Timing Reversibility
Management commentary on whether the $4.1B timing drag is strictly non-cash and accounting-related.
Signal: Quality of earnings beat
Guyana Execution
Operational updates on the core upstream portfolio to ensure the long-term growth story remains constructive.
Signal: Upstream resilience
Sentiment Analysis · Exxon Mobil

Interactive scenario analysis: $XOM

Select earnings outcome
Price Support

Pricing tailwind more than absorbed the disruption

EPS above US$1.85 suggests high realized pricing from liquids absorbed volume hits. Management indicates timing effects were less severe than feared, with constructive operational updates from Guyana and the broader upstream portfolio.
EPS Outcome
Above US$1.85
Timing Impact
Smaller than feared
Likely Reaction
Sentiment Strengthens
Sources & Data Methodology

Sources: Reporting dates from company investor relations (Estimated for April 29, BMO). Consensus EPS and analyst-range data from Bloomberg and Earnings Whispers as at 13 April 2026 (AEDT). Scenario analysis reflects evaluateions of internal energy considerations. Figures and schedules are subject to change without notice.

Bottom line This late-April energy cluster is about more than three company reports. It is a live test of what the market wants to pay for in 2026. Tesla can show whether autonomy and energy are becoming more than a promise. NextEra can show whether rising electricity demand is turning into practical utility growth. Exxon can show whether oil strength still translates into durable earnings power. Taken together, they offer a useful read on the part of the market that looks more physical, more capital-intensive and, for many traders, more real.

Your next earnings setup starts here

Stay ahead of major beats, misses, and market surprises. Log in to your terminal, open a new account, or explore our dedicated earnings academy.

Need help? Contact our support team

GO Markets
April 15, 2026
US Earnings
AI
Defence, disruption and big finance: 3 names worth watching this earnings season

So here is the thing: April’s US earnings season is arriving in a market that still feels anything but normal. As GO Markets explains in The global US earnings playbook: The essential guide for traders, this reporting period is landing after a real shift in what markets care about. It is no longer just about chasing growth at any cost. It is about what the numbers are saying beneath the surface.

And in 2026, those signals are colliding with a high-friction backdrop:

  1. Geopolitical conflict: Ongoing tension in the Middle East
  2. Oil supply shock: Brent crude above US$100
  3. The Fed: A central bank still boxed in by sticky inflation

The durability pivot

Yes, AI is still the market’s main story but it's still the flashy engine getting most of the attention. But underneath that, there is a quieter move towards companies that look built to hold up better when conditions get harder.

When rates are uncertain and energy markets are under pressure, names like JPMorgan Chase and the major defence contractors start to carry more weight. They are not replacing the AI narrative, rather, they are becoming part of the way traders read risk appetite, earnings durability and, ultimately, where the market is looking for something more solid to hold on to.

! Important: Reporting schedules can change without notice. Reporting dates and release times are from company investor relations calendars where marked Confirmed; otherwise they are GO Markets estimates. Consensus EPS, revenue and analyst-range data are from third-party market consensus sources, as of 7 April 2026 (AEDT). Company guidance, backlog and operating metrics are from the latest company filings or results presentations unless stated otherwise. Figures and schedules may change without notice.
$JPM | Q1 2026 REPORTING PERIOD

JPMorgan Chase & Co.

NYSE | Financial Services | 14 Apr 2026
Reported

Global Release Countdown (BMO)

RELEASE LIVE
Reported EPS
US$5.94
Reported Revenue
US$50.54bn
Market Intelligence: $JPM

Analysis: JPM price drivers and scenarios

NII guidance
~US$103 billion
Full year | US$95 billionn ex:markets
ROTCE target
17%
Possible return on tangible common equity
Analyst range
US$5.02-5.70
Low to high estimate spread
AVG
LOW US$5.02 AVG US$5.39 HIGH US$5.70

The analyst spread of US$0.68 signals genuine disagreement about how the rate environment is flowing through to margins. A result above consensus but below the high end estimate may produce a muted reaction. A result above US$5.70 may shift the discussion.

Key swing factors for the result

Net interest income (NII)
The clearest macro lever. It reflects the gap between lending rates and deposit costs.
Guidance: US$103 billion for the full year
Return on tangible common equity (ROTCE)
A scale check. It indicates whether JPM is converting scale into efficiency. 17% is the benchmark.
Target: 17% ROTCE
Trading and investment banking
Strong Q1 growth was expected in fees and markets revenue. These lines can offset softness in lending, and stronger-than-expected performance here may shift the narrative away from rate sensitivity.
Watch: investment banking (IB) fees versus the prior quarter
Expense discipline
A bank can beat the EPS estimate and still sell off if expense growth is running too hot. Pairing the EPS result with the expense trajectory gives a fuller read on whether the beat is durable.
Watch: Expense outlook commentary
Trade Execution: $JPM

Earnings reaction framework: Q1 2026

Bull case
EPS above US$5.70, NII on track | ROTCE at or above 17%
The result comes in above the top of the analyst range. NII guidance holds or is revised higher. IB fees and markets revenue show strong Q1 growth. Expense commentary is constructive.
Possible reaction: momentum and repositioning
Base case
EPS between US$5.39 and US$5.70, NII in line | ROTCE near target
The result beats consensus but stays within the expected range. NII tracks guidance. The tone of the conference call may matter more than the headline number. The first move may fade if guidance is unchanged.
Possible reaction: muted or mixed initial response
Bear case
EPS below US$5.39 | NII misses | Expense growth surprises
The result comes in at or below the consensus midpoint. NII guidance is cut or qualified. Expense growth comes in above market expectations. IB or markets revenue disappoints.
Possible reaction: earnings multiple repricing

Reaction trigger to watch: The market response in the first 30 minutes after the result may indicate which scenario traders are leaning towards. A move above the prior session high on volume may support the bull case. A fade back into the range after an initial pop may point to the base case. A break below the prior session low on volume may suggest the bear case is gaining traction.

Sentiment Analysis · JPMorgan Chase

Interactive scenario analysis: $JPM

Select earnings outcome
Growth momentum

AI-linked offset, beat supported by NII and ROTCE

Stronger-than-expected demand for AI-related industrial lending may offset softer mortgage activity. Management maintains guidance as NII remains resilient in higher-for-longer conditions. IB fees and markets revenue may provide additional support. ROTCE at or above 17% would suggest the bank is converting scale into earnings efficiently.
EPS Outcome
Above US$5.70
NII Signal
On track
ROTCE
At or above 17%
Likely Reaction
Momentum may build

Sources & Data Methodology Sources: Reporting dates and release times are from company investor relations calendars where marked Confirmed; otherwise they are GO Markets estimates. Consensus EPS, revenue and analyst-range data are sourced from Bloomberg and Earnings Whispers, as at 7 April 2026 (AEDT). Company guidance, backlog and operating metrics are sourced from the latest company filings, results presentations or investor relations materials unless stated otherwise. Any scenario analysis reflects GO Markets analysis. Figures and schedules may change without notice.

From credit to defence

If JPMorgan gives the market an early read on the consumer, credit quality and business activity, the defence names may be telling a different story. This is the point where the focus may start to shift from the credit cycle to government-backed demand.

In a market still shaped by geopolitical risk, that matters. Long-dated programs can help support revenue visibility, even when the broader outlook looks less certain. That is one reason the sector remains on the watchlist.

$LMT | Q1 2026 REPORTING PERIOD

Lockheed Martin Corp.

NYSE | Aerospace | Defense | 23 Apr 2026
Confirmed

Global Release Countdown (BMO)

00:00:00:00
Reported EPS
US$6.44
Reported Revenue
US$18bn
AU | ASIA 23 Apr | 9:20 pm
US | LATAM 23 Apr | 7:20 am
Market Intelligence: $LMT

Analysis: LMT price drivers and scenarios

Order backlog
US$194 billionn
Record visibility
Book-to-bill
1.2x
Orders outpacing sales
Analyst range
US$6.90-7.10
Low to high estimate spread
AVG
LOW ~US$6.90 AVG ~US$6.94 HIGH US$7.10+

The consensus sits near the lower end of the analyst range. That positioning may leave room for upside if backlog growth and F-35 delivery timelines support execution. A print near the high end, above US$7.10, may extend the move, although the reaction would still depend on guidance and margins.

Key swing factors for the result

Backlog visibility
Primary evidence of demand. Book-to-bill above 1.2x would support full-year guidance and the production ramp.
Backlog: US$194 billion record
Free cash flow (FCF)
Defence stocks are often assessed on cash conversion. The market may look for confirmation of the US$6.5 billion floor.
Guide: US$6.5 billion - $6.8 billion
Missile segment growth
PrSM and THAAD deliveries remain key watchpoints. Strong space margins may help offset softness in aeronautics.
Watch: Fire Control margins
Margin pressure
Pension charges and production inflation remain risks. An earnings beat may fade if operating margins contract.
Watch: segment operating margin
Trade Execution: $LMT

Earnings reaction framework: Q1 2026

Bull case
EPS above US$6.70, backlog visibility confirmed | FCF guide holds
The result clears the upper half of the analyst range. Management reaffirms or raises the full-year FCF outlook. Strong Missiles and Fire Control (MFC) margins help offset any aeronautics supply chain lag.
Possible reaction: momentum may build and positioning may improve
Base case
EPS between US$6.30 and US$6.70 | Backlog steady at about US$194 billion
The result aligns with the US$6.38 consensus. F-35 delivery pace remains on track but offers no meaningful upside surprise. The market may wait for more specific segment guidance on the conference call.
Possible reaction: muted or mixed initial response
Bear case
EPS below US$6.30 | FCF guide qualified, margin contraction
The result falls towards the bottom of the analyst spread. Management cites further software delays or program losses. The FCF trajectory narrows towards the lower end of previous expectations.
Possible reaction: the share price may come under pressure

Reaction trigger to watch: The market response in the first 30 minutes after the result may indicate which scenario traders are leaning towards. A move above the prior session high on volume may support the bull case. A fade back into the range after an initial pop may point to the base case. A break below the prior session low on volume may suggest the bear case is gaining traction.

Sentiment Analysis · Lockheed Martin

Interactive scenario analysis: $LMT

Select earnings outcome
Backlog confirmed

Backlog and FCF confirmation may support continuation

EPS clears the top of the analyst range. Backlog holds at or above US$194 billion and book-to-bill stays above 1.2, which would suggest orders are replenishing faster than revenue is being recognised. FCF guidance holds within the stated range.
EPS outcome
Above US$7.00
Backlog signal
Above US$194 billion
FCF guide
Holds or improves
Likely reaction
Continuation may follow

Sources & Data Methodology Sources: Reporting dates and release times are from company investor relations calendars where marked Confirmed; otherwise they are GO Markets estimates. Consensus EPS, revenue and analyst-range data are sourced from Bloomberg and Earnings Whispers, as at 7 April 2026 (AEDT). Company guidance, backlog and operating metrics are sourced from the latest company filings, results presentations or investor relations materials unless stated otherwise. Any scenario analysis reflects GO Markets analysis. Figures and schedules may change without notice.

Not all defence names are the same

Lockheed Martin and Northrop Grumman may sit in the same defence bucket, but the market does not always read them the same way. Lockheed is more closely tied to the F-35 and current air combat demand. Northrop is more closely linked to next-generation programs such as the B-21 Raider and Sentinel.

That gives this section its contrast. One is often read through the lens of current defence demand. The other is more closely tied to longer-cycle strategic modernisation.

$NOC | Q1 2026 REPORTING PERIOD

Northrop Grumman Corp.

NYSE | Defense | Space Systems | 21 Apr 2026
Confirmed

Global Release Countdown (BMO)

00:00:00:00
Reported EPS
US$6.14
Reported Revenue
US$9.8 bn
AU | ASIA 21 Apr | 10:30 pm
US | LATAM 21 Apr | 8:30 am
Market Intelligence: $NOC

Analysis: NOC price drivers and scenarios

Consensus EPS
US$6.96
Quarterly analyst average
Order Backlog
US$95.7 billion
Record revenue visibility
FY 2026 EPS guide
US$27.40-US$27.90
Full-year 2026 outlook
AVG
LOW ~US$6.90 AVG ~US$6.96 HIGH US$7.20+

The consensus sits near the lower end of the analyst range. That offers a quick visual for whether the result is merely in line or strong enough to ease the guidance concerns that weighed on the stock after its last update. A result above US$7.20 may shift the conversation more materially.

Key swing factors for the result

Book-to-bill ratio
Currently at 1.10, suggesting orders are still running ahead of revenue recognition. This remains an important signal for multi-year growth visibility in defence.
Watch: 1.10 target
Guidance reset risk
Management’s guidance previously came in below market expectations. The market may be sensitive to any further softening in the 2026 outlook.
Watch: guidance commentary
Program concentration
The B-21 Raider and Sentinel carry outsized execution sensitivity. Updates on production ramp and funding may be the clearest drivers of sentiment for the stock.
Watch: B-21 and Sentinel updates
Capacity investment
Higher capital expenditure (capex) supports the industrial base over the longer term, but it may pressure near-term margins. Watch for signs that current investment is weighing on earnings power.
Watch: operating margins
Trade Execution: $NOC

Earnings reaction framework: Q1 2026

Bull case
EPS above US$6.30, backlog expansion above US$96 billion | Free cash flow (FCF) guidance raised
The result comes in above the cited threshold. Management says B-21 Raider production is ahead of schedule, with improving margins. Sentinel program restructuring costs remain below baseline expectations. International awards lift the book-to-bill ratio above 1.15.
Possible reaction: momentum may improve
Base case
EPS between US$6.00 and US$6.20, backlog steady at about US$95.7 billion
The result is broadly in line with the cited range. FCF targets for 2026 are reaffirmed but not expanded. Market focus shifts to organic sales growth metrics and segment operating margins. The initial reaction may depend on the timing of B-21 milestone payments.
Possible reaction: little reaction
Bear case
EPS below US$5.95 | margin pressure, guidance narrowed
The result lands near the low end of the analyst spread. Management flags higher infrastructure costs for Sentinel or delays in restricted space segment awards. Margin pressure in Aeronautics persists, and the 2026 revenue guide narrows towards the US$43.5 billion floor.
Possible reaction: shares may weaken

Reaction trigger to watch: The market response in the first 30 minutes after the result may indicate which scenario traders are leaning towards. A move above the prior session high on volume may support the bull case. A fade back into the range after an initial pop may point to the base case. A break below the prior session low on volume may suggest the bear case is gaining traction.

Sentiment Analysis · Northrop Grumman

Interactive scenario analysis: $NOC

Select earnings outcome
Stealth momentum

B-21 momentum, stronger execution and FCF support

EPS clears US$6.15. Management confirms a production capacity agreement for the B-21 Raider. Sentinel restructuring reaches Milestone B on schedule. Record backlog visibility and higher FCF guidance towards US$3.5 billion may support broader repositioning.
EPS outcome
Above US$6.15
B-21 Signal
Acceleration
FCF guide
$3.5 billionn range
Likely reaction
Momentum rally

Sources & Data Methodology Sources: Reporting dates and release times are from company investor relations calendars where marked Confirmed; otherwise they are GO Markets estimates. Consensus EPS, revenue and analyst-range data are sourced from Bloomberg and Earnings Whispers, as at 7 April 2026 (AEDT). Company guidance, backlog and operating metrics are sourced from the latest company filings, results presentations or investor relations materials unless stated otherwise. Any scenario analysis reflects GO Markets analysis. Figures and schedules may change without notice.

Bottom line

In a market shaped by geopolitical risk and shifting rate expectations, companies with visible demand and longer-cycle revenue may continue to attract attention. But sentiment can still turn quickly if valuations are stretched, rate expectations shift again, or tensions in the Middle East ease.

That is why the story still needs to be tested against the numbers, not just the narrative. GO Markets will be analysing more companies throughout this earnings season. For more updates, visit our earnings page, follow our social media channels, or check the weekly newsletters.

Your next earnings setup starts here

Stay ahead of major beats, misses, and market surprises. Log in to your terminal, open a new account, or explore our dedicated earnings academy.

Need help? Contact our support team

GO Markets
April 7, 2026
US Earnings
Shares
The global US earnings playbook: The essential guide for traders

If you have been watching markets over the past year, you will have noticed that the "growth at any cost" era has effectively hit a wall. The April 2026 earnings cycle arrives at a moment when the market's focus has undergone a structural reorientation. It is not just about profit and loss statements anymore. It is about the signals sitting behind them.

With interest rate uncertainty lingering and geopolitical shocks pushing oil above US$100, the playbook has shifted from AI hype toward institutional resilience and the industrialisation of compute. For traders in Australia, Asia and Latin America, these results may act as a mood ring for global risk appetite and the emerging security supercycle.

Important - Dates, Times and Figures

All earnings dates marked as confirmed or estimated should be verified against current company investor relations calendars before you act on them. Reporting schedules can change without notice due to corporate decisions, regulatory requirements or exchange timetable adjustments.

The mechanics: How the timing works across time zones

The US earnings season does not arrive as a smooth drip. It arrives in waves. For non-US traders, the primary challenge is the overnight gap: major results land while you are away from your desk and can move index CFDs before your local market opens. Before market open (BMO) and after market close (AMC) matter just as much as the numbers themselves. The timing changes how quickly markets react, when liquidity is available and whether the first move has already happened before your session begins.

Why BMO and AMC matter

A BMO result hits before the US cash market opens, so price discovery happens in pre-market trading where liquidity is thinner and moves can be exaggerated. An AMC result hits after close, meaning the reaction is compressed into a short pre-market window the following morning. Understanding which window your company reports in is as important as understanding what it reports.

Institutional Grade Performance

Master the Markets with MetaTrader 5

Trade hundreds of instruments with superior speed and advanced technical analysis. Harness full EA functionality to execute your strategy.

Need to access your terminal? Log in to Client Portal

The key themes for Q1

For this cycle, the market is no longer rewarding AI mentions alone. It is looking for return on investment (ROI) proof. The four thematic snapshots below help explain where attention is likely to sit as results come through. Each theme has its own section with company cards that can be updated each quarter.

T1
Theme 1 — Institutional anchors

Defence against volatility

These companies are often watched as relative defensives during energy shocks and inflation spikes, although they remain exposed to normal share-price risk. When macro uncertainty rises, money has historically rotated toward businesses with contracted revenue, government-linked demand or pricing power that is not dependent on the consumer cycle — but past rotation patterns do not guarantee future performance.

JPM
JPMorgan Chase
Tuesday, 14 April Confirmed
Watch For

Net interest margin (NIM) under higher for longer rates, and whether AI spending remains cost neutral.

LMT
Lockheed Martin
Wednesday, 22 April Estimated
Watch For

F-35 delivery schedules and the company's ability to absorb tariff related costs on supply chain inputs.

NOC
Northrop Grumman
Monday, 27 April Confirmed
Watch For

B-21 Raider production progress and the conversion of its reported US$95.7 billion backlog into recognised revenue.

T2
Theme 2 — Tangible capital

EVs and energy

As parts of tech slow, investors have been rotating toward tangible, capital-intensive businesses. The energy transition and the infrastructure required to support AI data centre power demand have put utilities and energy companies in an unusual position: they are now growth stocks with defensive characteristics — though all remain subject to ordinary equity and sector risk.

TSLA
Tesla
Thursday, 23 April Confirmed
Watch For

The strategic shift from EV margins toward robotaxi and energy storage as the new growth narrative.

NEE
NextEra Energy
Friday, 24 April Estimated
Watch For

Data centre power demand and progress on its reported 30 GW contracted backlog as utilities face new infrastructure pressure.

XOM
Exxon Mobil
Wednesday, 29 April Estimated
Watch For

Permian and Guyana volume growth, and cash flow resilience during the Hormuz supply disruption.

T3
Theme 3 — The hardware invoice phase

AI infrastructure

This is the engine room of the S&P 500 and the part of the market most tied to whether AI capital expenditure is generating measurable returns. The question the market is now asking is not whether these companies are spending on AI. It is whether the spending is translating into capacity utilisation and revenue that justifies the multiple.

MSFT / GOOGL
Microsoft and Alphabet
Monday, 27 April Estimated
Watch For

Azure and Cloud capacity constraints against heavy AI capital expenditure. The gap between spending and utilisation is the market's primary concern.

NVDA
NVIDIA
Wednesday, 27 May Estimated
Watch For

Blackwell GPU demand and gross margin sustainability as the product cycle matures and competition intensifies.

T4
Theme 4 — K-shaped recovery

Consumer platforms and devices

This theme tests the K-shaped consumer recovery: higher-income cohorts remain more resilient while lower-income cohorts face continued pressure from elevated borrowing costs and energy prices. Ad revenue and device upgrade cycles are the clearest indicators of where on the K-curve the consumer sits.

META / AMZN
Meta and Amazon
28 to 29 April Estimated
Watch For

AI-driven ad click improvements against Reality Labs spending and retail logistics costs as the profitability test for non-core investment.

AAPL
Apple
Thursday, 30 April Estimated
Watch For

iPhone upgrade cycle momentum and the Apple Intelligence rollout in China as the first real-world test of AI-driven hardware demand.

Analysis checklist: how to read each result

Use this structure for every company on your watchlist. A headline beat is common. The bigger market move often comes from how the market translates the details sitting behind the number.

1
Projected consensus

This is the bar for earnings per share (EPS) and revenue. Small beats may already be priced in. The market often sets a whisper number above the published consensus, so a technically positive result can still disappoint.

2
The call focus

Identify the single variable analysts are most focused on this cycle: capital expenditure versus margins, inventory turnover, customer growth rate, or contract backlog conversion.

3
The translation

A beat, meet or miss each carries a different market dynamic.

Beat Matters most when forward guidance is credible. Without it, the initial move may reverse.
Meet Often shifts focus to the tone of the call, particularly language around capacity or outlook.
Miss Can be treated as the start of a trend and trigger a sharp repricing of valuation multiples.

The recency bias problem

The emotional trap many traders fall into is recency bias. Because the Magnificent 7 have led markets for so long, it can feel as though they are still the only trade that matters. That assumption deserves to be tested.

It's worth asking: Is the obvious trade already priced for perfection?

2026 is shaping up as a year of proof. Companies that spent heavily on AI over the past two years are now being asked to show the return. The market is no longer rewarding the announcement of AI investment. It is rewarding the evidence of AI-driven revenue outcomes.

A better framing question for each result is this: are you reacting to a headline, or are you assessing the company's role in the physical AI supply chain or as a potential volatility hedge? Those are very different analytical tasks, and they tend to produce very different positioning decisions.

What to watch next

Three time horizons, three distinct signals. Update these each cycle with the most relevant near-term catalyst, the sector rotation to watch, and the longer-horizon dispersion theme.

Next Two Weeks
Consumer health barometer

Watch the 31 March Nike report as a lead indicator for consumer discretionary health. Footwear and apparel demand signals tend to front-run broader retail sentiment.

Next 30 Days
Bank lending and industrial demand

Focus shifts to the major banks. If loan demand tied to industrial and infrastructure projects remains firm, the earnings cycle may have support beyond the tech sector.

Next 60 Days
Wider dispersion between winners and losers

Watch for dispersion to widen. The companies converting heavy capital expenditure into measurable revenue outcomes may separate clearly from those that cannot.

Client & Education Portal

Follow the US Reporting Season

Stay ahead of major beats, misses, and market surprises. Log in to your terminal, open a new account, or explore our dedicated earnings academy.

Need help? Contact our support team

GO Markets
March 31, 2026
The Fed enters April with rates at 3.50% to 3.75%, Brent crude above US$100 and inflation pressures still not fully solved. March CPI, payrolls, Q1 GDP and the 28 to 29 April FOMC could determine whether rate cuts stay on hold for much of 2026.
Central Banks
Geopolitical events
Fed watch April 2026: Oil, inflation and the FOMC explained

Here is the situation as April begins. A war is affecting one of the world's most important oil chokepoints. Brent crude is trading above US$100. And the Federal Reserve (Fed), which spent much of 2025 engineering a soft landing, is now facing an inflation threat driven less by wages, services or the domestic economy, and more by energy. It is watching an oil shock.

The Fed funds rate sits at 3.50% to 3.75%. The next Federal Open Market Committee (FOMC) meeting is on 28 and 29 April and the key question for markets is not whether the Fed will cut, it is whether the Fed can cut, or whether the energy shock may have shut that door for much of 2026.

A heavy run of major data releases lands in April. The March consumer price index (CPI), non-farm payrolls (NFP) and the advance estimate of Q1 gross domestic product (GDP) are the three that matter most. But the FOMC statement on 29 April may be the release that sets the tone for the rest of the year.

Fed Funds Rate

3.50%–3.75%

Next FOMC

28–29 April 2026

Brent crude

Above US$100

Key data events

12 major releases

Growth: Business activity and demand

Think about what the US economy looked like coming into this year: AI-driven capital expenditure (capex) was a major part of the growth narrative, corporate investment intentions looked firm and the One, Big, Beautiful Bill Act was already in the mix. On paper, the growth story looked solid.

Then the Strait of Hormuz situation changed the calculus. Not because the US is a net energy importer, it is not, and that structural insulation matters. But what is good for US energy producers can still squeeze margins elsewhere and weigh on global demand. The 30 April advance Q1 gross domestic product (GDP) estimate is now likely to be read through two lenses: how strong was the economy before the shock, and what it may signal about the quarters ahead.

Key dates (AEST)

2
Apr
US international trade in goods and services (February)
Bureau of Economic Analysis  ·  10:30 pm AEDT
Medium
30
Apr
Q1 GDP — advance estimate
Bureau of Economic Analysis  ·  10:30 pm AEST
High

What markets look for

  • Resilience in Q1 GDP despite the elevated interest rate environment and early energy cost pressures
  • Trade balance movements linked to shifting global tariff frameworks
  • Business investment intentions following passage of the "One Big Beautiful Bill Act"
  • Early signs of capacity constraints emerging in technology-heavy sectors

How this data may move markets

Scenario Treasuries USD Equities
Stronger than expected growth Yields rise Firmer Mixed - depends on inflation read
Softer growth/GDP miss Yields fall Softer Risk off if stagflation narrative builds

Labour: Payrolls and employment

February's jobs report was, depending on how you read it, either a blip or a warning sign. Non-farm payrolls (NFP) fell by 92,000, unemployment edged up to 4.4% and the official line was that weather played a role. That may be true but here is what also happened. The labour market suddenly looked a little less convincing as the main argument for keeping rates elevated.

The 3 April employment report for March is now genuinely consequential. A bounce back to positive payroll growth would probably steady nerves and a second consecutive soft print, particularly against a backdrop of higher energy prices, would start to build a very uncomfortable narrative for the Fed. It would be looking at slower jobs growth and an inflation threat at the same time. That is not a comfortable place to be.

Key dates (AEST)

3
Apr
March employment situation (NFP and unemployment rate)
Bureau of Labor Statistics  ·  10:30 pm AEDT
High
30
Apr
Q1 employment cost index
Bureau of Labor Statistics  ·  10:30 pm AEST
Medium

What markets look for

  • A return to positive payroll growth, or confirmation that February's softness was the start of a trend
  • Stabilisation or further movement in the unemployment rate from 4.4%
  • Average hourly earnings growth relative to core inflation — the wage-price dynamic the Fed watches closely
  • Weekly initial jobless claims as a real-time signal of whether layoff activity is rising

Inflation: CPI, PPI and PCE

Here is the uncomfortable truth about where inflation sits right now. Core personal consumption expenditures (PCE), the Fed's preferred gauge, was already running at 3.1% year on year in January, before any oil shock had fed through. The Fed had not fully solved its inflation problem, rather, it had slowed it down. That is a different thing.

And now, on top of a not-quite-solved inflation problem, oil prices have moved sharply higher. Energy prices can feed into the consumer price index (CPI) relatively quickly, through petrol, transport and logistics costs that can eventually show up in the price of nearly everything. The 10 April CPI print for March is probably the most important single data release of the month, it is the one that may tell us whether the energy shock is already showing up in the numbers the Fed watches.

Key dates (AEST)

10
Apr
Consumer price index (CPI) — March
Bureau of Labor Statistics  ·  10:30 pm AEST
High
14
Apr
Producer price index (PPI) — March
Bureau of Labor Statistics  ·  10:30 pm AEST
Medium
30
Apr
Personal income and outlays incl. PCE price index — March
Bureau of Economic Analysis  ·  10:30 pm AEST
High

What markets look for

  • Monthly CPI acceleration driven by energy and shelter components — the two stickiest inputs
  • PPI as a forward-looking signal: producer cost pressure tends to feed into consumer prices with a lag
  • PCE trends relative to the Fed's 2% target, particularly the core reading that strips out food and energy
  • Any sign that AI-related pricing power is feeding into corporate margins in ways that sustain elevated core readings

How this data may move markets

Scenario Treasuries USD Gold
Cooling core inflation Yields fall Softer Supportive
Sticky or rising inflation Yields rise Firmer Headwind

Policy, trade and earnings

April is also the start of US earnings season, and this quarter's results carry an unusual amount of weight. Investors have been pouring capital into AI infrastructure on the basis that returns are coming. The question is when. With geopolitical volatility driving a rotation away from growth-oriented technology and towards energy and defence, JPMorgan Chase's 14 April earnings will be read as much for what management says about the macro environment as for the numbers themselves.

Then there is the FOMC meeting on 28 and 29 April. After the early-April run of data, including NFP, CPI and producer price index (PPI), the Fed will have more than enough information to update its language. Whether it signals that rate cuts could remain on hold through 2026, or whether it leaves the door slightly ajar, may be the most consequential communication of the quarter.

Geopolitical volatility has already pushed investors to reassess growth-heavy positioning. The estimated US$650 billion AI infrastructure buildout is also coming under heavier scrutiny on return on investment. If earnings season disappoints on that front, and if the FOMC signals a prolonged hold, the combination could test risk appetite heading into May.

Monitor this month (AEST)

  • 14 April - JPMorgan Chase Q1 earnings

    The first major bank to report. Management commentary on credit conditions, consumer spending, and the macro outlook will set the tone for financial sector earnings and broader market sentiment.

  • 15 April - Bank of America Q1 earnings

    A read on consumer credit conditions and household financial health, particularly relevant given rising energy costs and the 4.4% unemployment rate.

  • 28-29 April - FOMC meeting and policy statement

    The month's most consequential event. The statement and any updated forward guidance may effectively confirm whether rate cuts remain a possibility for 2026.

  • Ongoing - Strait of Hormuz tanker traffic

    A live indicator of energy supply risk. Any escalation or resolution carries immediate implications for oil prices, inflation expectations, and the Fed's options.

  • Ongoing - Sovereign AI export restrictions

    Developing policy around technology export curbs may affect capital expenditure plans for US technology firms, with knock-on implications for growth and employment in the sector.

The Bigger Picture

Geopolitical volatility has forced a rotation into energy and defence at the expense of growth oriented technology positions. The estimated US$650 billion AI infrastructure buildout is increasingly being scrutinised for returns on investment. If earnings season disappoints on that front, and if the FOMC signals a prolonged hold, the combination could test risk appetite heading into May.

Big US data release ahead? Stay focused.
Open an account · Log in
GO Markets
March 30, 2026
Market insights
AI
Top 5 semiconductor stocks in Asia: AI's biggest beneficiaries

Asia dominates the global semiconductor supply. Five companies, spanning Taiwan, South Korea, and Japan, sit at the critical juncture of the AI buildout, controlling everything from fabrication to the equipment that makes chips possible. 

Quick facts

  • TSMC delivered $90 billion in revenue in 2024, with a 59% gross margin and shares up 55% in 2025.
  • Advantest shares doubled (+102%) in 2025 as AI-driven chip testing demand surged.
  • SK Hynix is Nvidia's primary HBM supplier, positioning it at the centre of the AI accelerator boom.

1. Taiwan Semiconductor Manufacturing Co. (TSM)

TSMC is the world's largest contract chip manufacturer, producing advanced semiconductors for Apple, Nvidia, AMD, and Qualcomm. As a pure-play foundry, it leads in 5-nanometer (5nm) and 3- nanometer (3nm) chip production, with smaller nodes in development.

The company posted $90 billion in revenue for 2024 with a 59% gross margin and 36% return on equity. 

Shares delivered a total return of 55% in 2025, with analysts forecasting a further ~30% revenue increase in 2026, underpinned by its $100 billion US expansion programme.

The key risk for the company is its geopolitical exposure, with Taiwan Strait tensions remaining the sector's most-watched tail risk.

What to watch

  • US expansion progress: Any delays, cost blowouts, or political friction concerning TSMC's $100 billion Arizona investment could weigh on sentiment.
  • Customer order visibility: Watch for any guidance updates from Apple, Nvidia, or AMD on chip orders, as TSMC's revenue is highly concentrated among a handful of clients.
  • Geopolitical developments: Any escalation of Taiwan Strait tensions could trigger sharp moves regardless of fundamentals.
  • Next-node ramp: Progress on 2nm production and yield rates will be a key signal for TSMC's ability to maintain its technology lead.

2. Samsung Electronics (KR:005930)

Samsung is one of the few companies globally that both designs and fabricates chips at scale. It competes across DRAM, NAND flash, and logic chip segments, and remains a core supplier to global tech giants.

Samsung's wide scope is a strength, but also a complexity. Its memory division faces margin pressure from inventory cycles, while its foundry business continues to lag TSMC in leading-edge yields. 

The AI-driven memory boom may provide a tailwind, though execution in HBM production has been slower than local rival SK Hynix.

What to watch

  • HBM qualification progress: Samsung has been working to qualify its HBM3E chips with Nvidia. Any confirmation of a major supply win could be a meaningful catalyst.
  • Memory pricing trends: DRAM and NAND spot prices could be an indicator of Samsung's margin trajectory.
  • Foundry yield improvements: Samsung's logic foundry business has struggled with yields at advanced nodes; any credible progress here could re-rate the division.
  • Management guidance: Following a period of earnings volatility, clarity on capex plans and divisional targets at upcoming results will be closely watched.
Source: Counterpoint research

3. Advantest (ATEYY)

Tokyo-based Advantest makes testing equipment used to verify chips meet performance and quality standards. 

It supplies to Samsung, Intel, Nvidia, Qualcomm, and Texas Instruments, allowing it to benefit from chip industry growth broadly, regardless of which foundry wins market share.

Advantest shares doubled in 2025 (+102%), and it raised its sales forecast by 21.8% and earnings forecast by 70.6% for the year ending March 2026.

What to watch

  • Order backlog updates: Any contraction in Advantest's backlog could be an early warning sign after the strong 2025 run.
  • AI chip testing demand: As chips grow more complex, testing time per chip increases. Monitor whether AI accelerator volumes from TSMC and Samsung start to drive outsized testing demand.
  • FY2026 guidance: The next forecast update will be critical in confirming whether 2025's upgrade cycle has further to run.
Advantest projected income statement | MarketScreener

4. Tokyo Electron (T:8035)

Tokyo Electron is among the world's largest suppliers of semiconductor production equipment, specialising in deposition, etching, and cleaning tools. 

Every major chipmaker, including TSMC, Samsung, and SK Hynix, depends on TEL's systems to scale production.

As chipmakers invest billions to expand capacity, TEL's order book grows. The risk lies in potential US export restrictions on advanced equipment sales to China, which remains one of the primary revenue segments for the company.

What to watch

  • US export control policy: China accounts for a significant portion of TEL's revenue. Any tightening of equipment export rules is the most immediate risk to watch.
  • Chipmaker capex announcements: TSMC, Samsung, and SK Hynix's capital expenditure plans for 2026 directly translate into equipment orders. Any cuts could flow through to TEL's order book.
  • New tool adoption cycles: Monitor whether TEL's next-generation deposition and etch tools are being adopted at leading-edge fabs.

5. SK Hynix (KR:000660)

SK Hynix is the world's second-largest memory chip maker and has emerged as arguably the clearest AI-era beneficiary in the memory space. 

It is Nvidia's primary supplier of High Bandwidth Memory (HBM) chips, the specialised memory used in AI accelerators like the H100 and B200.

HBM demand has driven a dramatic re-rating of SK Hynix's revenue profile and market standing. With AI infrastructure spending showing little sign of slowing heading into 2026, the company's HBM franchise could remain a key differentiator. 

However, capacity constraints and the risk of Samsung and Micron closing the HBM gap are the primary concerns to watch.

What to watch

  • Nvidia supply relationship: Any shift in Nvidia's supplier mix toward Samsung or Micron could be a key risk event.
  • HBM4 development: The race to next-generation HBM is already underway. Watch for updates on SK Hynix's HBM4 readiness and whether it can maintain its lead.
  • Conventional memory pricing: SK Hynix still derives meaningful revenue from standard DRAM and NAND. Spot price trends could be a gauge of the broader memory cycle.

Bottom line

TSMC, SK Hynix, Samsung, Advantest, and Tokyo Electron collectively control the chokepoints of the AI buildout. 

The expected increase in AI infrastructure may support demand, but investors should weigh the risks carefully. 

Geopolitical exposure, US export restrictions, and the pace of HBM competition could all move the needle.

Ready to trade beyond the majors?

Open an account · Log in

GO Markets
March 20, 2026

면책 고지:

회사, IPO 후보, 가치 평가, 거래소, 섹터 및 시장에 대한 언급은 설명 목적일 뿐이며, 게시 시점에 공개적으로 이용 가능한 정보를 기반으로 하고 사전 통지 없이 변경될 수 있습니다. 예정된 상장은 지연, 수정 또는 취소될 수 있으며, 이 페이지에 포함되었다고 해서 해당 회사가 상장되거나 특정 주식 또는 CFD가 GO Markets를 통해 거래 가능하다는 의미는 아닙니다.