Rare earth and strategic metals equities have been among the stronger-performing thematic areas in 2025, though recent price action suggests the rally has paused as investors reassess momentum. REMX has rebounded sharply from its April lows and is now consolidating below a technically significant resistance zone near $75, making it a key level to monitor.
What is REMX?
REMX is an exchange-traded fund that provides diversified exposure to global companies involved in mining, refining, and recycling rare earth and strategic metals. For traders and investors who want sector exposure without relying on a single issuer, the ETF structure can help spread company-specific risk. Performance will still be highly sensitive to commodity cycles and policy/geopolitics.
Portfolio snapshot
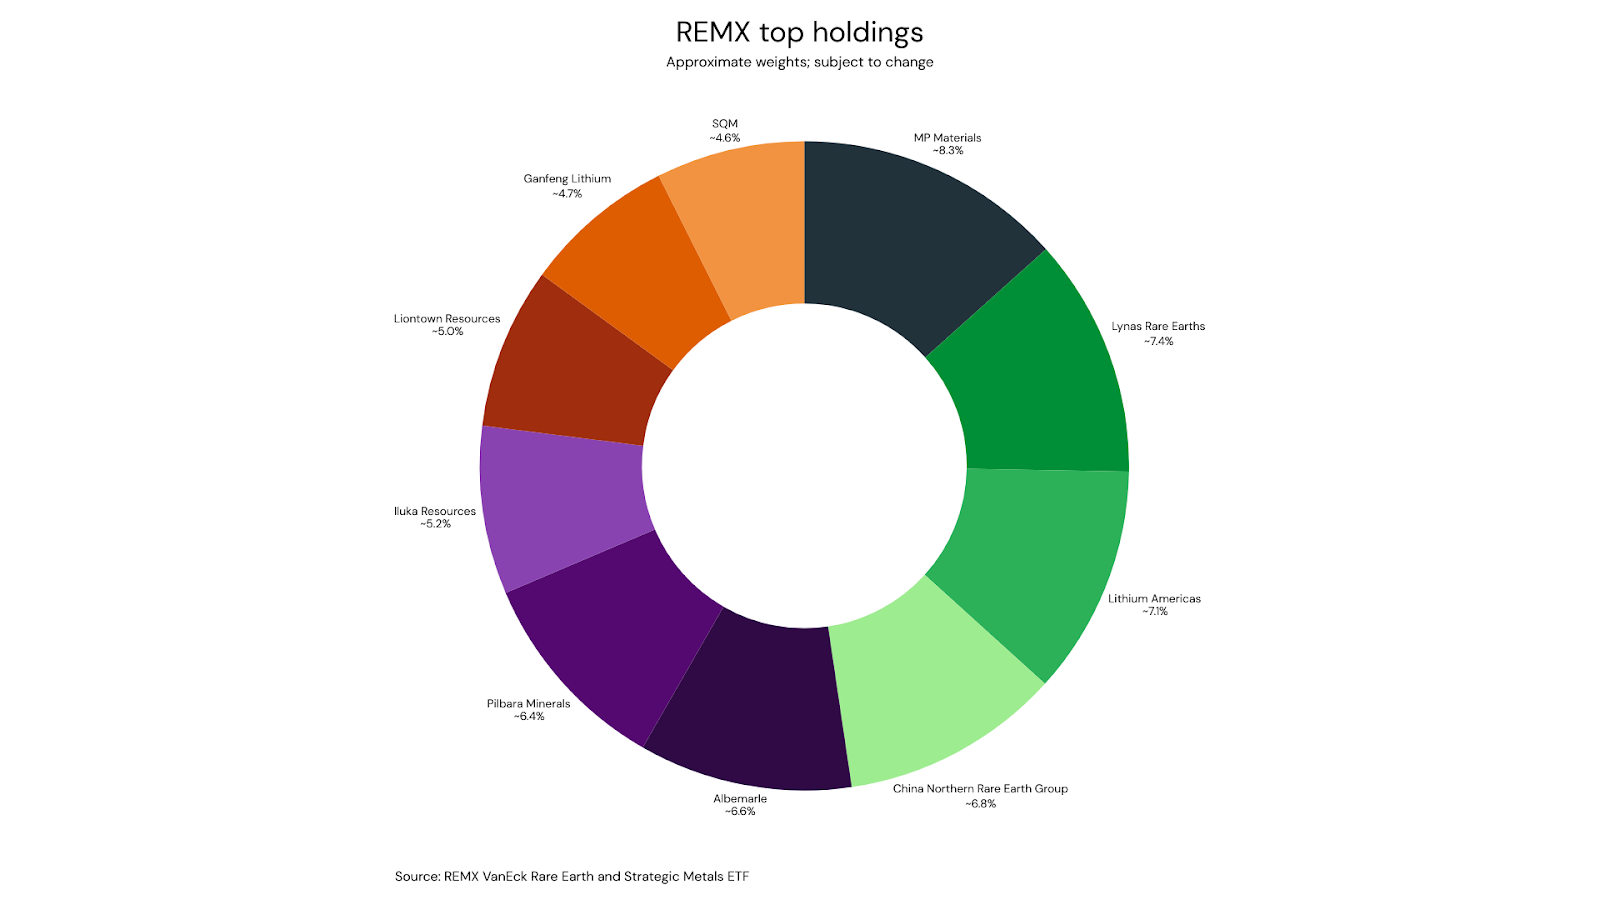
The ETF’s larger positions typically include a mix of rare earth producers and lithium-related names. Examples of top holdings (approximate weights, based on the fund’s most recent publicly available holdings data)
Why rare earths and strategic metals matter
Rare earth elements (a group of 17 metals) are not necessarily scarce in the earth’s crust, but economically viable deposits—and especially processing capacity—are concentrated. This creates a supply-chain dynamic where policy decisions, trade restrictions, and downstream demand can have outsized impacts on pricing and sentiment.
Industrial catalysts (refining and emissions control)
Technical outlook
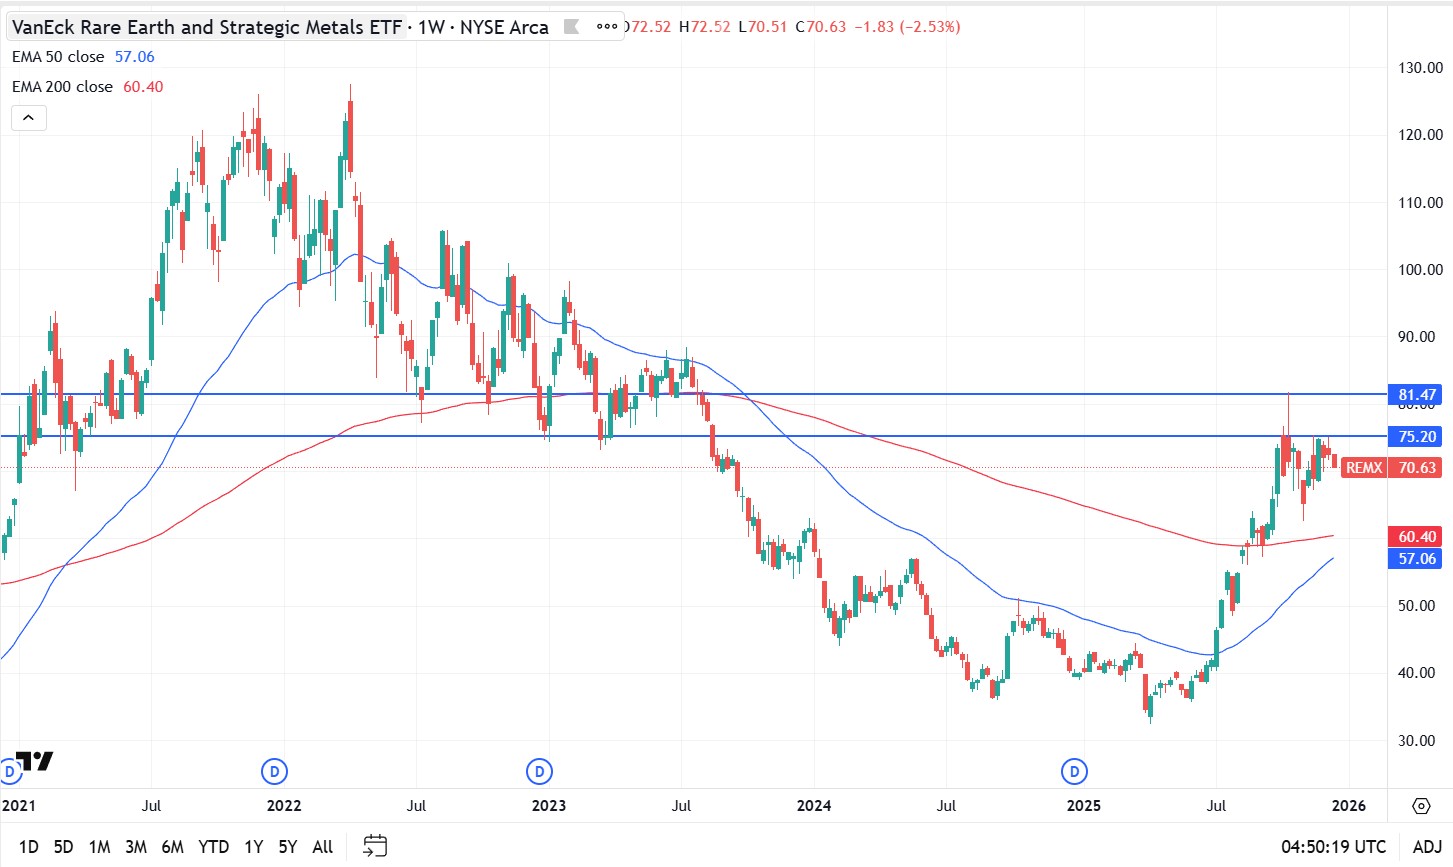
After marking multi-year lows around $33 in early April, REMX rallied strongly and returned to levels last seen in mid-2023. The $75 area stands out as a prior multi-touch support zone (2021–2023), which increases the probability it acts as resistance on the first approach.
REMX weekly chart
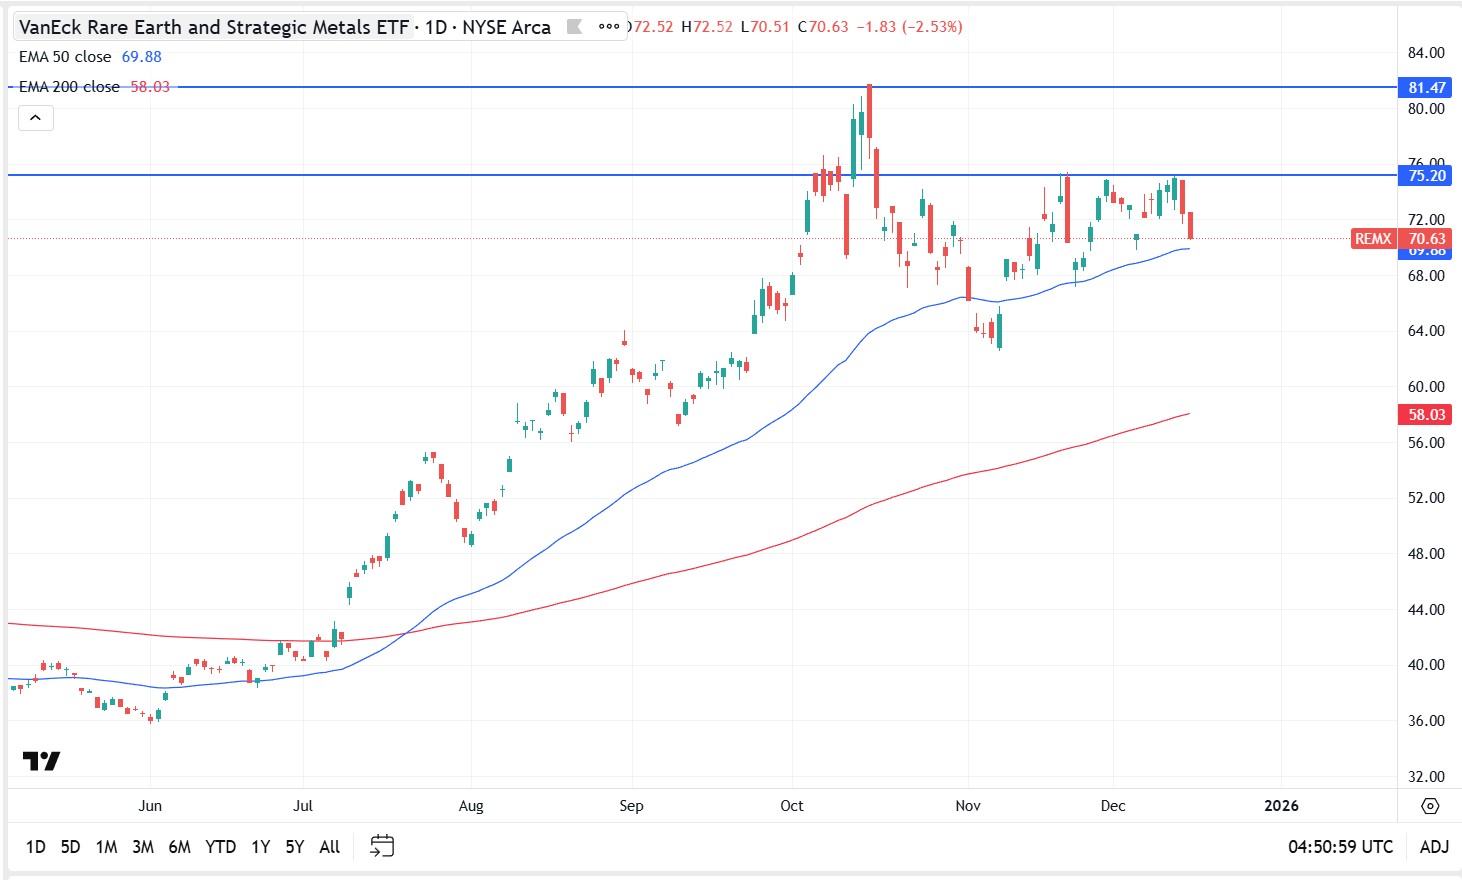
Price has repeatedly tested $75 over the past month without a confirmed breakout. The pattern of higher lows against flat resistance resembles an ascending triangle, often associated with building pressure; however, confirmation requires a decisive break.
REMX daily chart
Scenarios to watch
Bullish continuation: A daily close above $75 (ideally with expanding participation) would shift focus to $81 as the next resistance zone.
Range continuation / pullback: Failure to clear $75 again keeps the risk of a retracement toward $68 support.
Bearish breakdown: A sustained move below $68 would weaken the structure and raise the probability of a deeper mean reversion (next support levels should be mapped from prior swing lows).
By
Mike Smith
Mike Smith (MSc, PGdipEd)
Client Education and Training
Disclaimer: Articles are from GO Markets analysts and contributors and are based on their independent analysis or personal experiences. Views, opinions or trading styles expressed are their own, and should not be taken as either representative of or shared by GO Markets. Advice, if any, is of a ‘general’ nature and not based on your personal objectives, financial situation or needs. Consider how appropriate the advice, if any, is to your objectives, financial situation and needs, before acting on the advice. If the advice relates to acquiring a particular financial product, you should obtain our Disclosure Statement (DS) and other legal documents available on our website for that product before making any decisions.
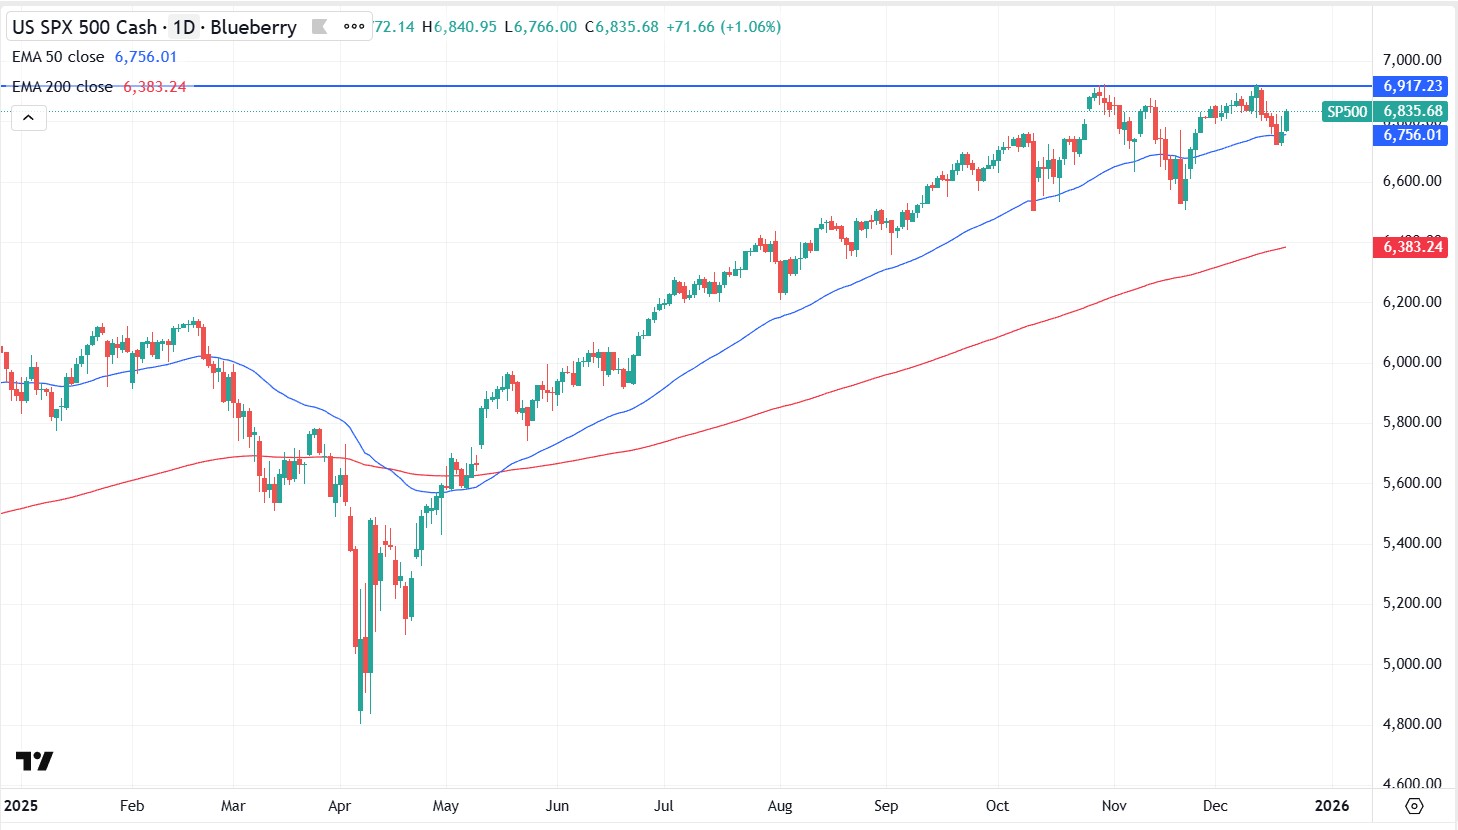
In 2025, the S&P 500 traded around 6,835 and was up approximately 16% year to date (YTD). Market direction remained most sensitive to Federal Reserve expectations, inflation data and the earnings outlook, with returns also shaped by mega-cap tech leadership and the broader AI narrative. The index pulled back from earlier December highs, but it has so far held above key major moving averages (MA).
Key 2025 drivers included:
Fed expectations and inflation: Inflation cooled through the year but remained sticky around 2.5% to 3%. A Fed easing bias likely supported price to earnings (P/E) multiples and “risk-on” positioning. More recently, markets appeared increasingly rate-sensitive, with the decreased likelihood of an additional rate cut until March 2026.
Earnings and guidance: Corporate earnings remained strong quarter on quarter. Recent Q3 results reportedly saw over 80% of the S&P 500 beat earnings per share (EPS) expectations. For Q4, the estimated year-over-year earnings growth rate is 8.1%, despite ongoing concerns around import tariffs and potential margin pressure.
Index leadership and breadth: Returns were heavily influenced by mega-cap tech and AI beneficiaries, even as broader market breadth appeared less consistent at points through the year.
Policy headlines and volatility: Trade and tariff headlines drove sharp moves, particularly earlier in the year. Some investors pointed to the “TACO” trade, with rapid recoveries after policy proposals were softened. Over time, similar shocks appeared to have less impact as the market became somewhat desensitised.
Valuations and sensitivity: The forward 12-month P/E ratio for the S&P 500 is 22, above the 5-year average (20.0) and above the 10-year average (18.7). That gap kept valuation sensitivity, especially in AI-linked names, firmly in focus.
Current state
The S&P 500 is about 1% below record highs hit earlier in December. That could indicate the broader uptrend remains in place, with a move back toward the recent highs one possible scenario if momentum improves. Despite the recent retracement, the index remains above all key major moving averages (MA). The latest bounce followed lower than expected CPI numbers earlier this week, alongside continued, and to some, surprising optimism about what may come next.
What to watch in January
Q4 earnings from mid-January: Results and guidance may help clarify whether valuations are being supported by forward expectations.
AI narrative and positioning: With AI-linked mega-caps carrying a large share of market capitalisation, changes in sentiment or expectations could have an outsized impact on index performance.
US jobs and CPI data: The latest US jobs report reportedly points to the highest headline unemployment rate since 2021. Cooling inflation this week may keep markets alert to shifts in rate cut timing, particularly around the March decision.
S&P 500 daily chart
Source: TradingView
Major FX pairs
Source: Adobe Images
AUD/USD
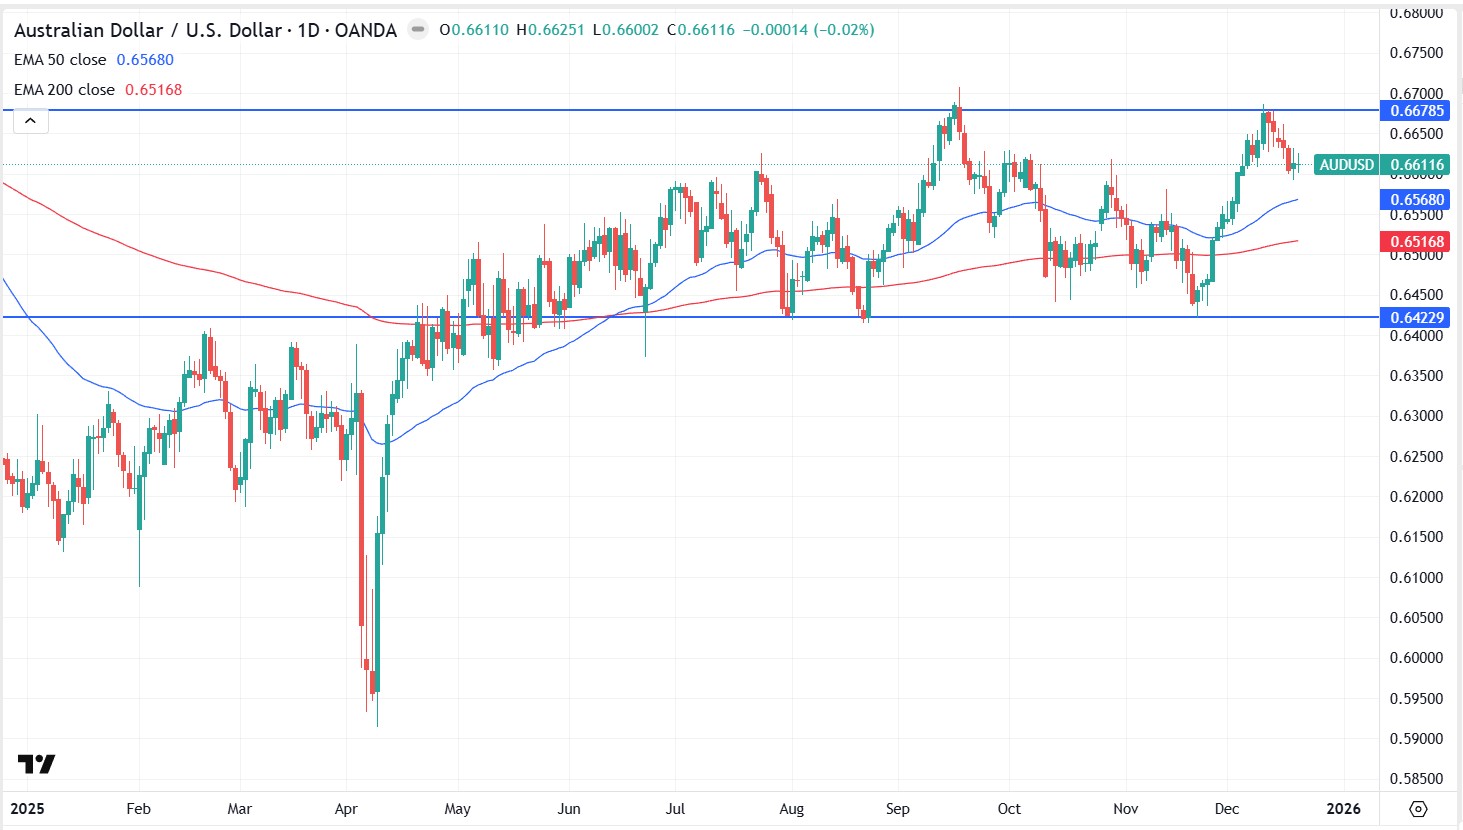
AUD/USD has been choppy in 2025. Since the “redemption day” drop in April, the move has looked more like a steady grind higher than a clean upside trend.
Key levels Recent peaks in early September and mid-December highlight resistance near 0.6625. Support has been evident around 0.6425, where price bounced over the last month.
What is supporting the bounce That support test coincided with stronger than expected jobs and inflation data, lifting expectations that the Reserve Bank of Australia (RBA) may raise rates during 2026 rather than cut again. The latest pullback looks contained so far, with buying interest already visible and price still above key longer-term moving averages.
What could drive a breakout The pair remains range-bound, but the tilt is still constructive. If Chinese data stays firm, metals prices hold up, and the central bank outlook remains relatively hawkish, a break above resistance could gain more traction.
AUD/USD daily chart
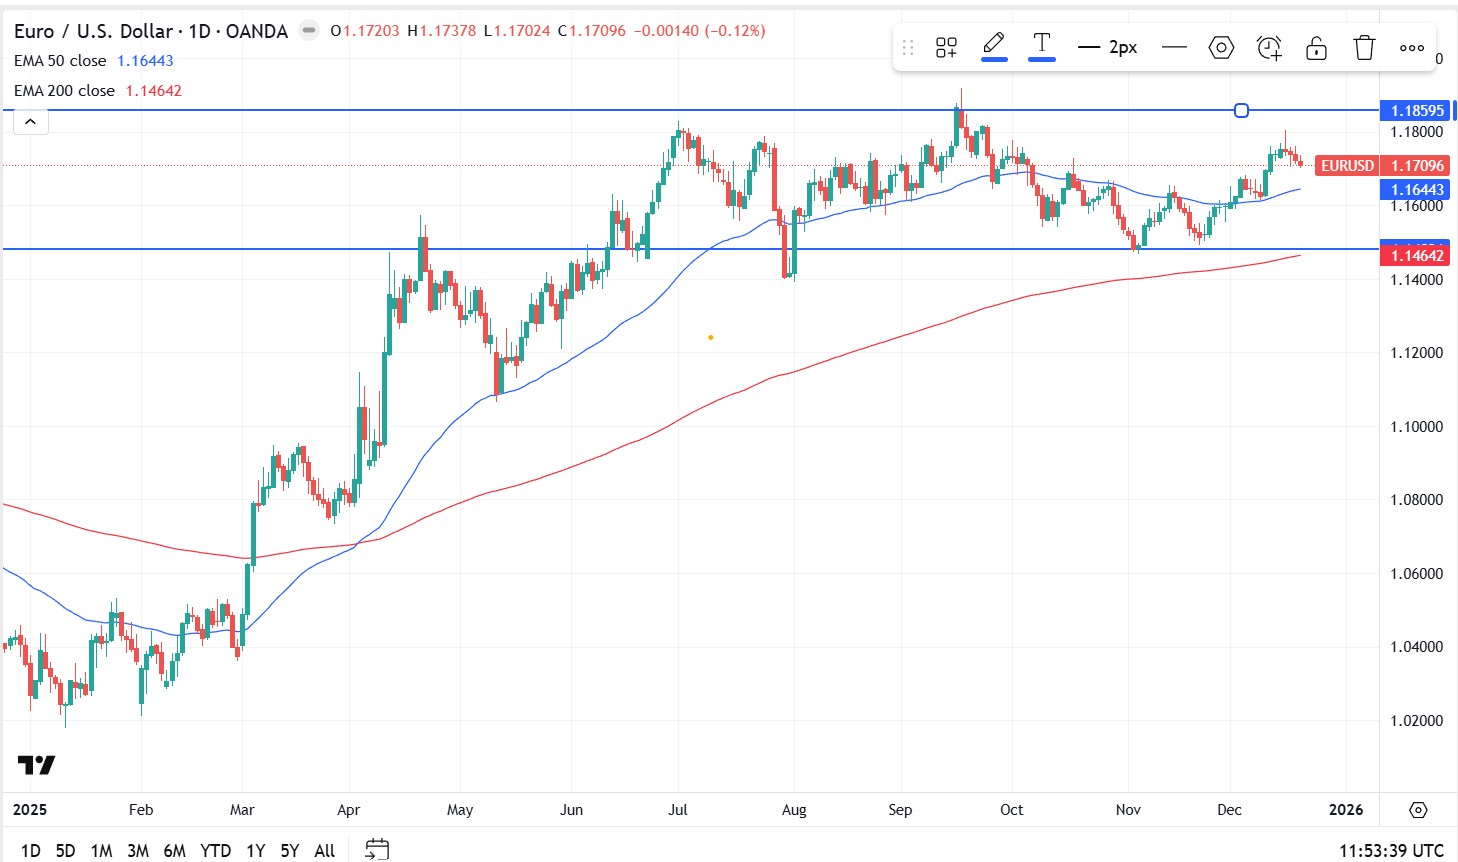
EUR/USD
After early 2025 euro strength, EUR/USD has mostly consolidated since June in a roughly 270 pip range. This month tested 1.18 resistance, reaching highs not seen since September.
What price is doing now The recent pullback still lacks strong downside conviction. Some technical analysts refer to the 1.17 area as a near-term reference level.
What could come next If price holds 1.17 and buyers step back in, another push toward 1.18 is possible. One view is that the European Central Bank (ECB) could be less inclined to ease in 2026, which could be consistent with a firmer EUR/USD scenario. Broader analyst commentary also suggests the euro may stall rather than collapse against the US dollar, although outcomes remain data and policy dependent.
EUR/USD daily chart
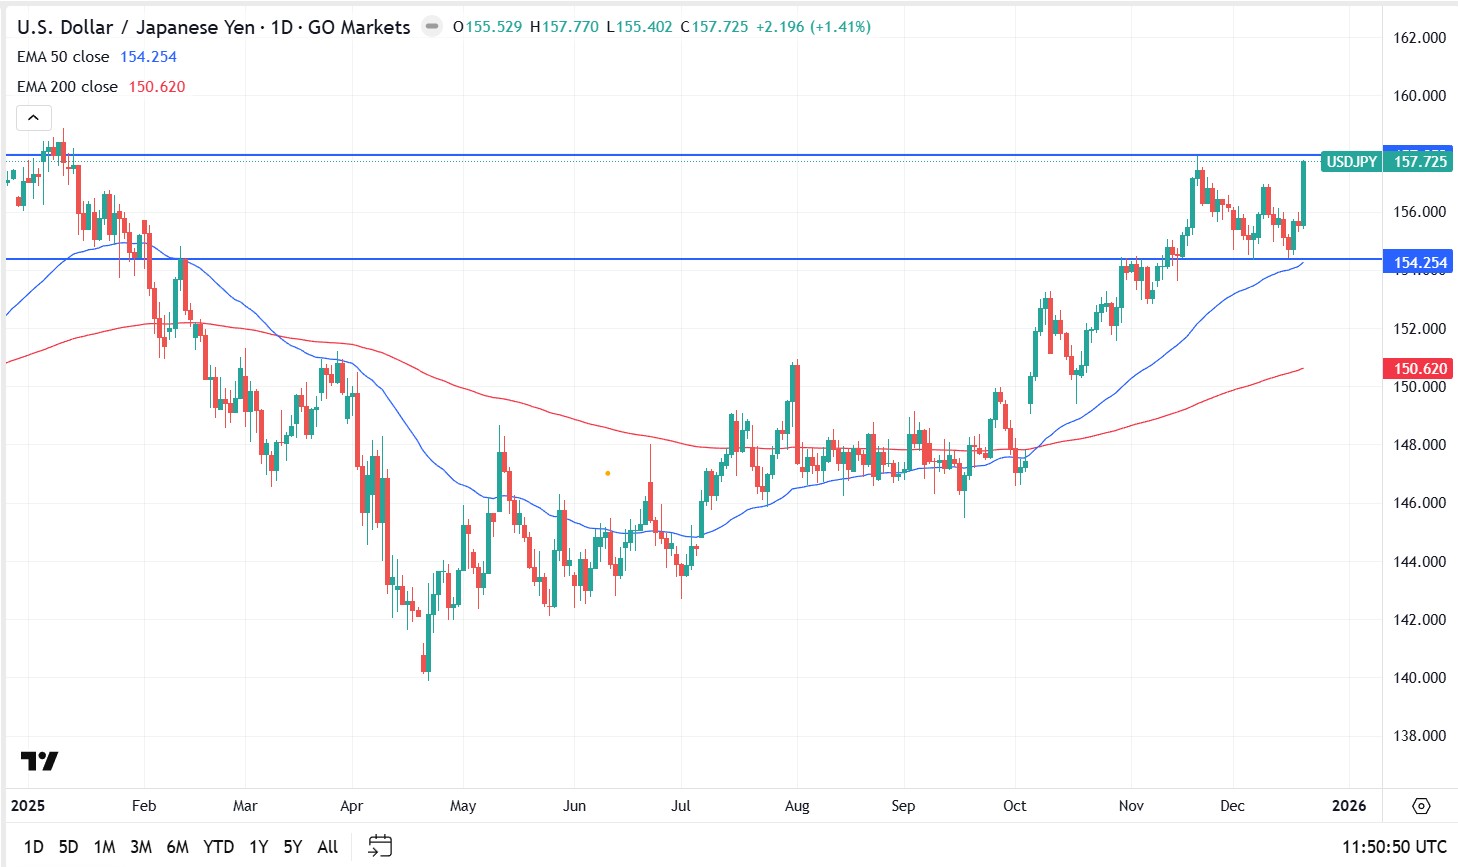
USD/JPY
Year-to-date picture USD/JPY is close to flat overall for the year. After US dollar weakness in Q1, the pair reversed higher and now sits just below resistance near 158.
Rates remain the main driver Rate differentials still favour the US dollar. The Bank of Japan (BOJ) held steady for much of the period despite expectations it might act, and the recent rate increase was modest. Policy has only moved marginally away from zero.
What could shift the balance Rate differentials remain a key influence. Without a clearer shift in BOJ policy, the JPY may find it difficult to sustain a rebound. Some market commentators cite 154.20 as a chart reference level.
Rare earth and strategic metals equities have been among the stronger-performing thematic areas in 2025, though recent price action suggests the rally has paused as investors reassess momentum. REMX has rebounded sharply from its April lows and is now consolidating below a technically significant resistance zone near $75, making it a key level to monitor.
What is REMX?
REMX is an exchange-traded fund that provides diversified exposure to global companies involved in mining, refining, and recycling rare earth and strategic metals. For traders and investors who want sector exposure without relying on a single issuer, the ETF structure can help spread company-specific risk. Performance will still be highly sensitive to commodity cycles and policy/geopolitics.
Portfolio snapshot
The ETF’s larger positions typically include a mix of rare earth producers and lithium-related names. Examples of top holdings (approximate weights, based on the fund’s most recent publicly available holdings data)
Why rare earths and strategic metals matter
Rare earth elements (a group of 17 metals) are not necessarily scarce in the earth’s crust, but economically viable deposits—and especially processing capacity—are concentrated. This creates a supply-chain dynamic where policy decisions, trade restrictions, and downstream demand can have outsized impacts on pricing and sentiment.
Industrial catalysts (refining and emissions control)
Technical outlook
After marking multi-year lows around $33 in early April, REMX rallied strongly and returned to levels last seen in mid-2023. The $75 area stands out as a prior multi-touch support zone (2021–2023), which increases the probability it acts as resistance on the first approach.
REMX weekly chart
Price has repeatedly tested $75 over the past month without a confirmed breakout. The pattern of higher lows against flat resistance resembles an ascending triangle, often associated with building pressure; however, confirmation requires a decisive break.
REMX daily chart
Scenarios to watch
Bullish continuation: A daily close above $75 (ideally with expanding participation) would shift focus to $81 as the next resistance zone.
Range continuation / pullback: Failure to clear $75 again keeps the risk of a retracement toward $68 support.
Bearish breakdown: A sustained move below $68 would weaken the structure and raise the probability of a deeper mean reversion (next support levels should be mapped from prior swing lows).
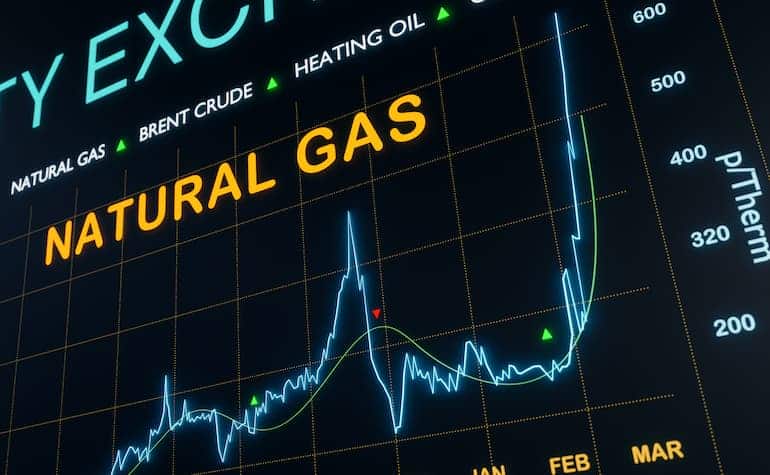
The United States used 30.28 trillion cubic feet of natural gas in 2021, making them the world’s largest consumer of natural gas. Natural gas consumption in the United States has two seasonal peaks, largely reflecting weather-related fluctuations in energy demand. One of the biggest consumptions of gas is industrial, residential and commercial cooling and heating systems (eia, 2022).
As the world’s largest user of natural gas transitions out of summer, will this change indicate a decrease of their natural gas consumption? Could the decrease in demand for cooling be reflected on the technical charts? On a daily timeframe, natural gas has been on a steady upward trend since the end of June, in tandem with the beginning of summer in the US (seen on the chart below).
A trendline from the beginning of that trend until now can be drawn, and we can see recently that line has been broken by a daily candlestick, closing below the trendline which can indicate a change in trend for natural gas. After the strong break below of the trendline followed by multiple bearish daily candlesticks, we can consequently expect further downside movement for natural gas, after breaking through a strong support at $8.4, in all probability with natural gas currently sitting at $7.895 we could see natural gas come down to the next support level around $7.57.
ASX defence stocks are back on more watchlists and according to the Stockholm International Peace Research Institute (SIPRI), global military spending reached approximately US$2.718 trillion in 2024, up 9.4% in real terms.
Australia’s current defence settings are set out in the 2024 National Defence Strategy and related investment planning documents, which outline long-term capability funding priorities. Furthermore, Canberra has pointed to A$330 billion of capability investment through 2034, including added funding for surface combatants, preparedness, long-range strike and autonomous systems.
Here is the part most people miss: not all ASX defence stocks are the same trade. Some sit close to naval shipbuilding. Some are counter-drone names and some are smaller, higher-risk operators where one contract may matter much more than the market assumes.
These five names are not a buy list, rather they are a practical watchlist for investors trying to understand where procurement momentum may actually show up on the ASX.
1) Austal (ASX: ASB)
Austal is one of the ASX-listed companies most directly exposed to Australia’s naval shipbuilding pipeline, although contract execution, margins and delivery timing remain important variables.
They aren't just winning random contracts; they have signed a massive legal agreement (the Strategic Shipbuilding Agreement) that makes them the official partner for building Australia's next generation of mid-sized military ships in Western Australia.
In February 2026, the government gave Austal the green light on a $4 billion project. This isn't for just one ship, it’s for 8 "Landing Craft Heavy" vessels. These are huge transport ships (about 100 metres long) designed to carry heavy tanks and equipment directly onto a beach. But here is the part most people miss, shipbuilding is a marathon, not a sprint.
As you can see in the delivery timeline, while construction starts in 2026, the final ship won't be delivered until 2038. For an investor, this means Austal has a "guaranteed" stream of income for the next 12 years, but they have to be very good at managing their costs over that long period to actually make a profit.
2) DroneShield (ASX: DRO)
If you have seen footage of small drones disrupting modern battlefields, DroneShield is building part of the "off switch". Its focus is counter-drone technology, including systems that detect, disrupt or defeat drones using electronic warfare, sensors and software-led tools, rather than relying only on traditional munitions.
By early 2026, DroneShield had moved beyond the label of a promising start-up and into a much larger commercial phase. It reported FY2025 revenue of A$216.5 million, up 276% from FY2024, and said it started FY2026 with A$103.5 million in committed revenue.
One point the market may overlook is the software layer in the model. DroneShield reported A$11.6 million in Software as a Service (SaaS) revenue in FY2025 and said it is working towards SaaS making up 30% of revenue within five years. Its subscription model includes software updates for deployed systems, which adds a growing stream of recurring revenue alongside hardware sales.
Among ASX defence stocks, DroneShield is one of the most direct ways to follow the counter-UAS theme. It is also one of the names where sentiment can swing quickly, because growth stories can rerate both up and down when order timing changes.
EOS builds both the "brain" and the "muscle" for military platforms. It is best known for remote weapon systems, which allow operators to control armed turrets from inside protected vehicles, and for high-energy laser systems aimed at counter-drone defence. EOS has said its unconditional backlog reached about A$459.1 million in early 2026, following a series of contract wins through 2025. That points to a much larger base of secured work, although delivery timing and revenue conversion still matter.
EOS signed a €71.4 million, about A$125 million, contract with a European customer for a 100-kilowatt high-energy laser weapon system. EOS says the system is designed for a low cost per shot and can engage up to 20 drones a minute. The Australian Government has set aside A$1.3 billion over 10 years for counter-drone capability acquisition, and EOS has disclosed that it was part of a successful LAND 156 bid team. That does not guarantee future revenue, but it does support medium-term visibility in a market the company is already targeting.
EOS reads as a rebound story, but one that still depends on execution. The company has reoriented around remote weapon systems, counter-drone systems and lasers, all areas tied to stronger defence spending. The key question is whether it can keep converting backlog and pipeline into delivered revenue while maintaining balance-sheet discipline.
4) Codan (ASX: CDA)
Codan is sometimes left out of casual defence stock lists because it is more diversified. That may be an oversight. In its H1 FY26 results, Codan said its Communications business designs mission-critical communications for global military and public safety markets. Communications revenue rose 19% to A$221.8 million. The company also said DTC delivered strong growth from defence and unmanned systems demand, with unmanned systems revenue up 68% to A$73 million. Codan said about half of that unmanned revenue was linked to operational defence applications in conflict zones.
This is where the story becomes more nuanced. In a basket of ASX defence stocks, Codan may offer a different profile, with less pure headline sensitivity, broader operating diversification and meaningful exposure to military communications and unmanned systems without being a single-theme name. That diversification may also mean the stock does not always trade like a pure-play defence name.
HighCom sits at the speculative end of this list, and it should be labelled that way. The company says its two continuing businesses are HighCom Armor, which supplies ballistic protection, and HighCom Technology, which supplies and maintains small and medium uncrewed aerial systems, counter-uncrewed aerial systems, and related engineering, integration, maintenance and logistics support for the ADF and other aligned regional militaries.
In H1 FY26, revenue from continuing operations fell 59% to A$10.9 million, while EBITDA moved to a A$5.4 million loss from a A$1.9 million profit a year earlier. HighCom also disclosed A$5.1 million in HighCom Technology revenue, including A$3.5 million from small uncrewed aerial systems (SUAS) spare parts and A$1.6 million from sustainment services provided to the Australian Department of Defence.
So yes, HighCom is one of the more financially sensitive ASX defence stocks on the board. But it is also the kind of smaller name that can show how procurement filters down into support, sustainment and specialist protection gear.
Key market observations
Track program milestones, not just political headlines. Contract awards, manufacturing starts, delivery schedules and sustainment work often matter more than a single announcement day.
Separate pure-play exposure from diversified exposure. DroneShield and EOS are closer to concentrated defence technology themes, while Codan brings communications exposure within a broader business mix.
Watch sovereign capability themes in Australia. Austal and EOS are tied to local manufacturing, integration and Australian supply chains, which supports the broader sovereign capability theme in this group.
Pay attention to balance sheets and cash conversion. Procurement momentum can be real even when timing gets messy. HighCom's latest half is a reminder of that.
Defence headlines can look immediate. Earnings usually are not. Austal's major naval work stretches into the next decade. EOS contracts are delivered over multiple years. DroneShield's order flow appears strong, but the company still separates committed revenue from broader pipeline opportunity. HighCom shows the other side of the coin. Exposure to procurement does not automatically translate into smooth financial execution.
References to ASX-listed defence stocks are general information only, not a recommendation to buy, sell or hold any security or CFD. These stocks can be highly volatile and are sensitive to contract timing, government policy, geopolitics, execution risk and market conditions. Backlog, pipeline and revenue expectations are not guarantees of future performance.
Three central banks are deciding rates simultaneously, Brent crude is swinging wildly around US$100 a barrel, and a war in the Middle East is rewriting the inflation outlook in real time. Whatever happens this week could set the tone for markets for the rest of 2026.
Quick facts
The Reserve Bank of Australia (RBA) announces its next cash rate decision on Tuesday, with markets now pricing a 66% chance of a second hike to 4.1%.
Some analysts have warned the Iran war could push US inflation to 3.5% by year-end and delay Fed rate cuts until September, making this week's FOMC dot plot the most closely watched in years.
Brent crude is flirting with US$100 a barrel after Iran launched what state media described as its "most intense operation since the beginning of the war."
RBA: Will Australia hike again?
The RBA raised the cash rate for the first time in two years to 3.85% at its February meeting after inflation picked up materially in the second half of 2025.
The question now is whether it moves again before even seeing the next quarterly CPI print, which isn't due until 29 April.
Deputy Governor Andrew Hauser acknowledged ahead of the meeting that policymakers face a genuinely divided decision, shaped by conflicting economic signals at home and growing instability abroad.
Financial markets currently assign around a 66% probability to another hike, with a May increase considered virtually certain regardless of what happens Monday.
The FOMC meets on March 17–18, with the policy statement scheduled for 2:00 pm ET on March 18 and Chair Jerome Powell's press conference at 2:30 pm. CME FedWatch shows a 99% probability that the Fed holds rates at 3.50% to 3.75%.
The real action is in the Summary of Economic Projections (SEP) and dot plot. The current median dot shows one 25-basis-point cut for 2026. If it shifts to two cuts, that is dovish and bullish for risk assets. If it shifts to zero cuts or adds a rate hike into the projection, markets could react in the other direction.
Further complicating matters, Powell's term as Federal Reserve Chair expires on May 23, 2026. Kevin Warsh is the leading candidate to replace him, viewed as more hawkish on monetary policy. Any comment from Powell on this transition could move markets independently of the rate decision itself.
Bank of Japan: Further tightening could be brought forward
The BOJ meets on March 18–19, with the decision expected Thursday morning Tokyo time. The current policy rate sits at 0.75% (a 30-year high), and the January 2026 meeting produced a hold in an 8-1 vote.
Governor Ueda has categorised the March meeting as "live," noting the timeline for further tightening could be "brought forward" if Shunto spring wage negotiations yield stronger-than-expected results.
Those results are due to begin flowing in during the week, making them the critical input for the BOJ's decision. Nomura expects 2026 Shunto wage hikes to come in around 5.0%, including seniority, with base pay growth of approximately 3.4%. If results confirm that trajectory, the case for a March hike strengthens considerably.
The complication is the global backdrop. Japan imports roughly 90% of its energy needs, and oil around US$100 per barrel is pushing up import costs and threatening to add inflationary pressure. A BOJ hike into a global oil shock would be an unusually bold move.
Most market participants still lean toward a hold at this meeting, with April or July seen as the more likely timing for the next move.
Brent crude briefly touched US$119.50 per barrel earlier in the week before dropping 17% to below US$80, then rebounding toward US$95 on mixed signals from Washington about the Strait of Hormuz.
As of Thursday, Brent was back over US$100 as Iran launched fresh attacks on commercial shipping and the IEA reserve release failed to bring meaningful relief.
In the scenario where a longer conflict inflicts damage to energy infrastructure, analysts estimate CPI could rise to 3.5% by the end of 2026, with gasoline prices approaching US$5 per gallon in the second quarter.
For this week, oil acts as a macro meta-variable. Every geopolitical headline, ceasefire signal, tanker attack, reserve release, and Trump comment could move equities, bonds and currencies in real time.
US-Israeli strikes on Iran launched on 28 February sent Brent crude surging past US$119 a barrel, gold above US$5,200, and defence stocks to all-time highs.
Against that backdrop, investors are focusing on a small group of commodity-linked names that may remain sensitive to further moves in oil, LNG and gold. The key question is whether the shock proves sustained, or whether a ceasefire, shipping normalisation, or policy action removes part of the geopolitical risk premium.
1. ExxonMobil (NYSE: XOM)
ExxonMobil has been one of the clearest beneficiaries of the price surge. Shares hit a record high of US$159.60 in early March and are up approximately 28% year-to-date.
The company produces 4.7 million barrels of oil equivalent per day, has a Permian Basin breakeven of around US$35/barrel, and is committed to US$20 billion in buybacks for 2026.
Wells Fargo raised its price target to US$183 from US$156 following the escalation, while broader analyst consensus sits around US$140–$144. However, XOM is already trading above many consensus targets, and disruption to its LNG partner QatarEnergy poses a near-term operational headwind.
Chevron touched a new 52-week high of US$196.76 in early March and has risen approximately 24% year-to-date.
The company's Brent breakeven for dividends and capital expenditure sits around US$50/barrel. This means that at current Oil prices above US$90, it is generating significant free cash flow.
However, Chevron has temporarily halted operations at a gas field off Israel's coast following missile activity in the region, and the stock has since pulled back more than 1% as the conflict directly affects its operations.
What to watch
Direct operational updates from Chevron's Middle East and Israeli assets.
Any further halts that could weigh on near-term production.
With Qatar having halted output after Iranian drone strikes, buyers across Asia and Europe are scrambling for alternative supply. Woodside, as one of Australia's largest LNG producers and exporters, sits outside the conflict zone and is well-positioned to benefit from rerouted demand.
Analysts caution that actual substitution takes time due to shipping and contract constraints, meaning the price uplift may be more durable than a simple spot trade. European TTF benchmark gas prices surged over 50% in a week, amplifying the margin environment for non-Middle Eastern LNG producers.
What to watch
The pace and timeline of any Qatar LNG production restart.
If QatarEnergy remains offline for weeks, Woodside could begin re-contracting European buyers at elevated spot prices.
An Australian dollar move higher could be a headwind worth tracking for USD-denominated earnings.
4. Cheniere Energy (NYSE: LNG)
Alongside Woodside, Cheniere is the most direct US beneficiary of the Qatar LNG disruption. As the largest LNG exporter in the United States, it saw intraday strength at the start of the conflict week.
US domestic energy production has buffered American consumers from the worst of the shock, but the export premium has widened as European and Asian buyers pay up for non-Gulf supply.
The trade is "geopolitically sensitive," and any resolution could reverse upside quickly. But for as long as Hormuz and Gulf gas infrastructure remain compromised, Cheniere is positioned to benefit structurally.
What to watch
Any diplomatic breakthrough that reopens Gulf shipping lanes.
Announcements of new long-term offtake contracts signed at current elevated prices.
Gold surged 5.2% in a single session on 1 March, touching US$5,246/oz, as markets sought safe-haven assets. Newmont, the world's largest gold producer, has seen its reserves effectively revalued at these prices.
It is up alongside gold's 24% year-to-date gain, and its all-in sustaining costs remain largely fixed.
However, Gold miners sold off sharply on 4 March, and Newmont fell nearly 8% in a single session as broader risk-off deleveraging hit precious metals equities.
The stock has recovered since, but volatility remains high. For longer-duration investors, analysts note that "safe" mining jurisdictions such as Canada, Australia, and Nevada are commanding fresh premiums as Middle East instability raises the value of geopolitically secure supply.
What to watch
Whether gold can hold above US$5,000/oz.
A prolonged conflict could accelerate an M&A cycle in junior gold miners.
A ceasefire or broad equity deleveraging event as the primary risk to monitor.
Lockheed Martin reached a new all-time high of US$676.70 on 3 March, up over 4% for the day. Its F-35 fighters, precision-guided munitions, THAAD systems, and HIMARS rocket artillery are central to the ongoing air campaign.
The US Department of Defence is moving to replenish munitions stockpiles, and Trump's stated ambition to raise the US defence budget to US$1.5 trillion by 2027 adds a longer-term structural tailwind beyond the immediate conflict.
Defence stocks are rising amid classic geopolitical risk pricing, but investors should note that actual contract flow takes time to translate into earnings, and valuations already reflect considerable optimism.
What to watch
The pace of US Department of Defence munitions replenishment orders.
How quickly contract wins translate into backlog growth.
Barrick is tracking gold's historic run alongside Newmont, with the stock up sharply year-to-date. It sits at a roughly US$78 billion market capitalisation and is reporting record free cash flow projections as its all-in sustaining costs remain well below current spot prices.
Like Newmont, it experienced a sharp single-session selloff of more than 8% during the broader 4 March deleveraging event, before partially recovering.
Royalty and streaming companies such as Wheaton Precious Metals (WPM) are being favoured by some investors as a more inflation-protected way to access gold upside, given their lower operational cost exposure. But Barrick remains one of the world’s largest listed gold miners, with earnings that are highly sensitive to changes in the gold price
What to watch
Gold's ability to hold above US$5,000/oz.
Any Barrick moves toward junior miner acquisitions.
Energy cost inflation, as rising fuel prices could begin to squeeze miner operating margins.