
Noticias del mercado & perspectivas
Anticípate a los mercados con perspectivas de expertos, noticias y análisis técnico para guiar tus decisiones de trading.

Central Banks
Market insights
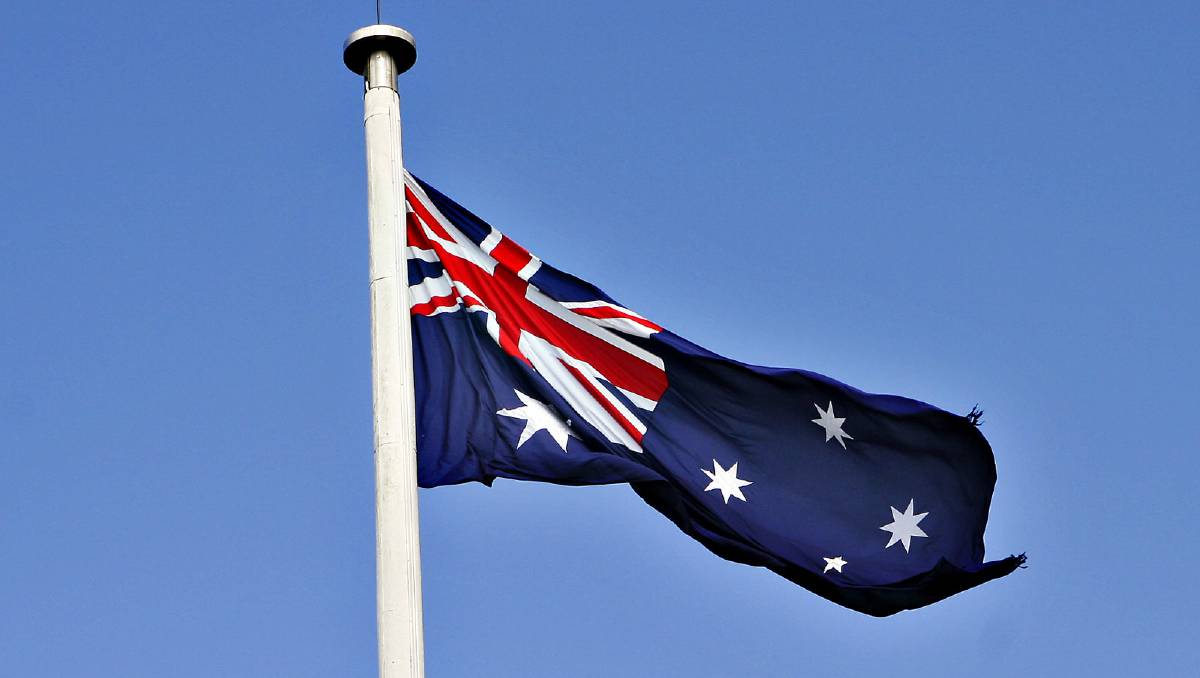
Tuesday, 12 May 2026, at roughly 7:30 pm AEST, Treasurer Jim Chalmers will stand up in Canberra and deliver the 2026-27 Federal Budget. According to Budget.gov.au, that is when the Budget is officially released, with the Budget papers going live online at the same time.
GO Markets
•
May 10, 2026


Shares and Indices

Shares and Indices

Shares and Indices

No items found.

Oil, Metals, Soft Commodities
Shares and Indices