
ข่าวสารตลาด & มุมมองเชิงลึก
ก้าวนำตลาดด้วยมุมมองเชิงลึกจากผู้เชี่ยวชาญ ข่าวสาร และการวิเคราะห์ทางเทคนิค เพื่อเป็นแนวทางในการตัดสินใจซื้อขายของคุณ.

US Earnings
AI
กระแสความนิยม AI กำลังก่อให้เกิดการแข่งขันด้านพลังงานที่ขยายขอบเขตไปไกลกว่าแค่เรื่องชิปและซอฟต์แวร์ โดย Tesla, NextEra Energy และ ExxonMobil ต่างเป็นตัวแทนของโครงสร้างพื้นฐานทางกายภาพสามส่วนที่คอยสนับสนุนการเติบโตนี้
The Editorial Desk
•
July 16, 2026


Forex
Central Banks
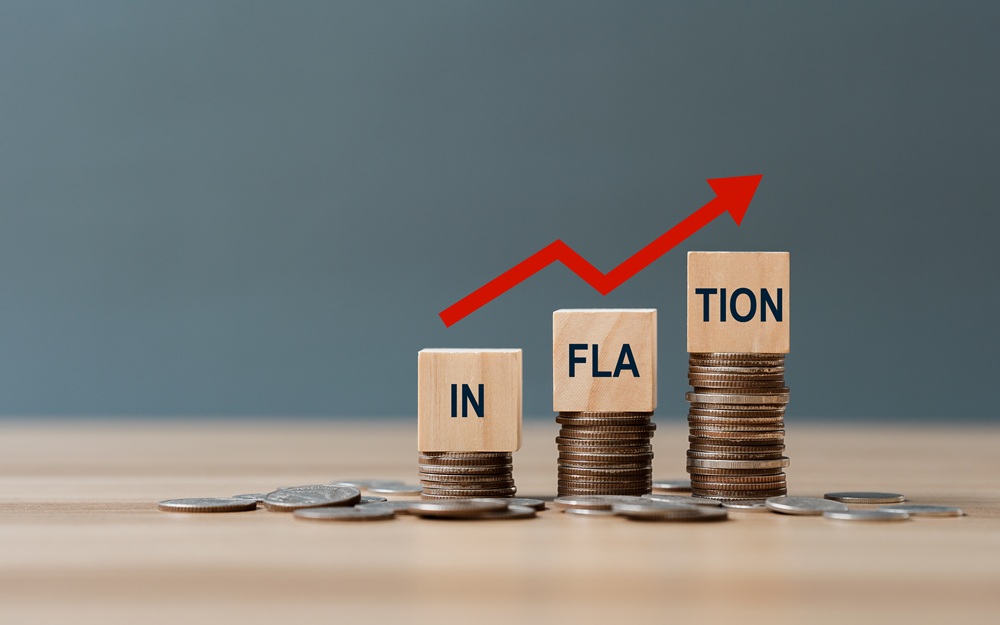
นโยบายธนาคารกลางที่แตกต่างกันและการกลับมาชันขึ้นของเส้นอัตราผลตอบแทนพันธบัตรรัฐบาลสหรัฐฯ อย่างมีโครงสร้าง ได้จัดเรียงโครงสร้างตลาดสกุลเงินโลกใหม่ตลอดเดือนมิถุนายน

Shares
Trading
ไม่ว่าจะรัก จะเกลียด หรือจะพยายามเมินเฉย แต่เมื่อความมั่งคั่งของคนคนหนึ่งเข้าใกล้ 1 ล้านล้านดอลลาร์สหรัฐฯ ตลาดก็เริ่มมองเขาเป็นสัญญาณความผันผวน
Educational
Announcments
ส่วนที่สี่ของซีรีส์การศึกษาจาก GO ซึ่งออกแบบมาเพื่อช่วยให้เทรดเดอร์มือใหม่เข้าใจถึงปัจจัยสำคัญที่ขับเคลื่อนตลาดโลก

Commodity
Oil, Metals, Soft Commodities
ราคาน้ำมันดิบอาจร่วงลงอย่างรวดเร็วเมื่อมีข่าวใหม่ ข่าวลือเรื่องการหยุดยิงแพร่สะพัด น้ำมันดิบเบรนท์คืนส่วนต่างความเสี่ยงทางภูมิรัฐศาสตร์ เทรดเดอร์ตัดสินใจว่าการซื้อขายที่เกิดจากความตื่นตระหนกได้สิ้นสุดลงแล้ว ข้อสรุปที่ชัดเจนคือต้นทุนพลังงานกำลังลดลง อย่าเพิ่งด่วนสรุป

Educational
Central Banks
ตอนที่สามของชุดบทความให้ความรู้ของ GO ซึ่งออกแบบมาเพื่อช่วยให้เทรดเดอร์มือใหม่เข้าใจปัจจัยสำคัญที่ขับเคลื่อนตลาดโลก

AI
Oil, Metals, Soft Commodities
เบื้องหลังข้อมูล มีหุ้น ASX 5 ตัวที่น่าจับตา