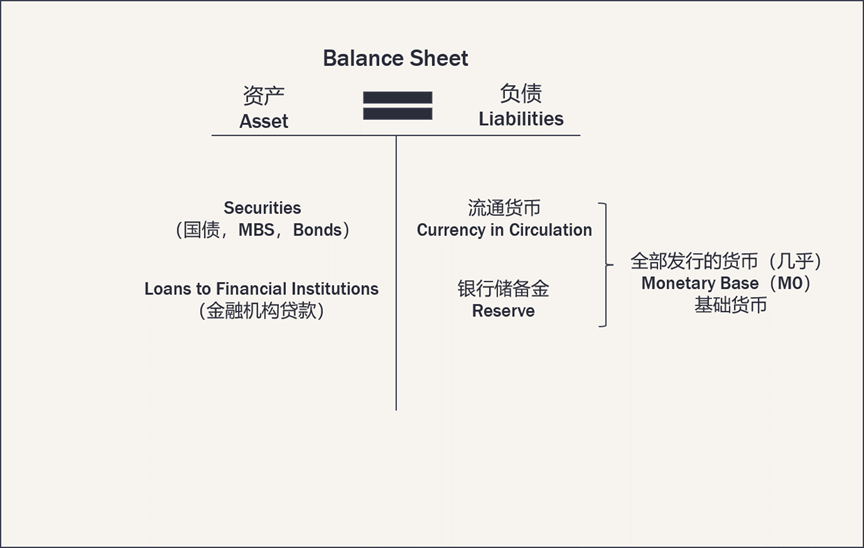
我们都知道央行就是发行货币的,所以它的账本最应该记录就是发行了多少货币。在咱们普通人手上,钱就是我们的资产。但是在央行,它发行的货币其实是它的负债。我们来看一看它的负债的组成部分,央行发行的所有的货币主要存在于两个地方。第一就是流通在市面上的货币叫做currency in circulation。另外一部分叫做reserve,就是各大银行存在央行里的货币。我们可以把央行理解成银行的银行,每个银行都被规定必须要在中央银行存上一定的储备金。相信这个说法大家都听说过,这个储备金呢可以理解成不在市场上流通的货币。这些流通的跟不流通的钱加起来几乎就是央行发行的全部货币。央行管他们叫做monetary base,这也就是我们平时说的M0,也叫做基础货币。央行的负债这一点咱们搞明白了,它的资产就相对容易理解了。央行的资产主要可以分成两大类。第一,各类证券securities,比如说美国国债以及央行购买的其他债券,比如说什么MBS ,房贷资产化债券,以及疫情期间,央行购买了很多企业的债券。第二类大资产就是金融机构贷款。比如说各大银行从央行借的这个贷款之类的。这就是美联储的资产负债表。美联储对宏观经济的几乎全部的政策都可以反映在对这张表格上。这张表左右两侧必须相等,这就意味着当美联储想要去改变这个表格中任意测的数字时候,表格的另一侧就必须发生变化。所以美联储所谓的印钱,它并不是所谓的单纯的印钱,它一定有对应的其他操作。想要理解美联储究竟如何缩表,我们首先需要理解它是如何扩表的。所谓扩表就是让这个表格的这个两边数字同时增加,以达到货币供给的目的。具体的做法就是央行去公开市场上购买表格左侧的这些国债以及其他债券。比如央行从市场上购买了一亿美金的美国国债,么这张表的右侧的基础货币部分就需要增加一亿美元。这就是增加货币的供应,就是咱们常说的美联储印钱,实际上美联储不需要真的去印钱。他直接在这张表上改一下数字就行了。在经济危机的时候,比如说2008年以及2020年,美联储都会去市场上大量地购买债券,以实现向市场注入货币,刺激经济的目的。这个过程呢就是所谓的QE( quantitative easing)量化宽松政策。这个QE 或者说货币供应最直接的结果就是导致利率下降和通货膨胀。利率下降可以通过两方面来解释。第一个就是当美联储在市场购买债券的时候,就会导致债券的需求增加,价格上升,而债券的价格和收益率呈负相关,债券价格上升,收益率下降,进而传导到整个经济,导致利率下降。其实单纯的通过货币供给关系,也能理解为什么增加货币供应会导致利率降低。利率其实就是借钱的成本了。当市场上货币少的时候,借钱就难,所以利率就高。当市场货币供应增加的时候,借钱就会更加易,所以利率就会降低。这个扩表或者说QE的第二个结果呢就是通货膨胀,钱印多了,钱就不值钱了。这个我们就不展开讲了。美联储通过QE 扩表,最终的目的是希望通过向市场增加货币供应,降低利率,让借钱变得更便宜,增加流动性。以达到刺激经济的目的。
这两年各位的股票大涨,房子大涨,新房贷的利率降低。直接都得益于QE政策。但是任何事情它都有两面性,通货膨胀就是这个QE的副作用。于是美联储就宣布要开始缩表加息了。我们明白了扩表的原理,么缩表呢就很容易理解了,它是扩表的逆操作,它的直接目的就是要让这资产负债表两边的数字同时减小,以达到减少流通货币的目的。它所带来的效果也是和扩表的效果是相反的。缩表的方法就是美联储主席说的三点:第一,在三月份之前逐渐减少并停止购买。这叫做tapering。第二步,一系列的加息。我们刚才在讲扩表和QE的时候提到,当美联储在公开市场上购买债券的时候,就会达到降息的目的。加息就是这个过程的逆向操作。美联储直接抛售资产负债表上的这些债券,就会让央行的资产负债表有缩小的动力。这种加息的做法是最直接的,对市场的冲击也最明显。利率的上升会降低股市的估值,尤其是成长股的估值。最近的科技股遭受重创也是这个原因。第三个缩表的办法就叫做balance sheet run off。 美联储不是买了很多的债券吗?这些债券呢都是有到期时间的这所谓的balance sheet ran off,就是当这些债券到期被偿还之后,美联储就直接从账本上把左右两侧对应的数字消掉,而不选择把资金再次用到购买新的债券。很多媒体把这个所谓的run off 本身翻译成缩表,我认为这样不准确。因为咱们能看到所谓的缩表,就是让这个资产负债表的数字减少。它的方法有很多,是一个综合性的结果。而balance sheet ran off 只是其中一个而已。通过这三个方法组合,美联储就能够实现缩小资产负债表,减少流通的货币,提高利率,从而控制通货膨胀。但是这种做法也有它的副作用,就是它会抑制经济的发展。美联储主席在听证会上认为,美国经济能够承受这个缩表产生的负面作用。但是鲍威尔之前也说通胀是可控的,但是现在都8.5%了。所以。想要同时做到抑制通货膨胀和减少对经济的负面效应,还是相当有难度的。现在咱们已经了解了美联储将会如何缩表加息。2022年的投资上会有什么变化呢?股市是否会崩盘呢?楼市是否会低迷呢?
The information provided is of general nature only and does not take into account your personal objectives, financial situations or needs. Before acting on any information provided, you should consider whether the information is suitable for you and your personal circumstances and if necessary, seek appropriate professional advice. All opinions, conclusions, forecasts or recommendations are reasonably held at the time of compilation but are subject to change without notice. Past performance is not an indication of future performance. Go Markets Pty Ltd, ABN 85 081 864 039, AFSL 254963 is a CFD issuer, and trading carries significant risks and is not suitable for everyone. You do not own or have any interest in the rights to the underlying assets. You should consider the appropriateness by reviewing our TMD, FSG, PDS and other CFD legal documents to ensure you understand the risks before you invest in CFDs. These documents are available here.
免责声明:文章来自 GO Markets 分析师和参与者,基于他们的独立分析或个人经验。表达的观点、意见或交易风格仅代表作者个人,不代表 GO Markets 立场。建议,(如有),具有“普遍”性,并非基于您的个人目标、财务状况或需求。在根据建议采取行动之前,请考虑该建议(如有)对您的目标、财务状况和需求的适用程度。如果建议与购买特定金融产品有关,您应该在做出任何决定之前了解并考虑该产品的产品披露声明 (PDS) 和金融服务指南 (FSG)。
Bitcoin rebounded 7% to touch $94,000 this week as two of the world's largest asset managers doubled down on their conviction that this cycle could break from crypto's boom-bust past.
BlackRock CEO Larry Fink and COO Rob Goldstein declared tokenisation "the next major evolution in market infrastructure,” comparing its potential to the introduction of electronic messaging systems in the 1970s.
Tokenised real-world assets have exploded from $7 billion to $24 billion in just one year, with certain projections expecting tokenised instruments to comprise 10-24% of portfolios by 2030.
Total RWA Value
Grayscale's latest research also put forward the case that this cycle will not follow Bitcoin’s predictable four-year pattern. Their analysis shows this cycle has had no parabolic price surge like previous cycles, and capital is flowing through regulated ETPs and corporate treasuries rather than retail speculation.
Grayscale has boldly predicted Bitcoin will reach new all-time highs next year based on this data, with near-term catalysts including a likely Federal Reserve rate cut and advancing crypto legislation.
AI Boom Creating a Memory Chip Supply Crisis
The AI revolution has had an unexpected ripple effect on conventional memory chips (DRAM).
Post-ChatGPT launch in 2022, chipmakers pivoted aggressively toward high-bandwidth memory (HBM) chips — the components that power AI data centres.
Samsung and SK Hynix, who control roughly 70% of the global DRAM market, transitioned large portions of their production away from conventional chips.
This worked in the short term, but data centre operators are now replacing old servers, and PC and smartphone sales have exceeded expectations (all of which require DRAM).
This saw DRAM supplier inventories fall to just two to four weeks in October, down from 13 to 17 weeks in late 2024.
DRAM spot prices nearly tripled in September this year, while in Tokyo's electronics district, popular gaming memory modules have surged from 17,000 yen to over 47,000 yen in recent weeks.
Google, Amazon, Microsoft, and Meta have all approached Micron with open-ended orders, agreeing to purchase whatever the company can deliver, regardless of price.
Samsung, Micron, and SK Hynix shares have rallied 96%, 168%, and 213% YTD, respectively, thanks to the increased DRAM demand.
Ironically, this recent price surge has seen DRAM chip margins approach those of the advanced HBM chips, meaning non-AI memory could now become equally profitable to produce.
Every trader has had that moment where a seemingly perfect trade goes astray.
You see a clean chart on the screen, showing a textbook candle pattern; it seems as though the market planets have aligned, and so you enthusiastically jump into your trade.
But before you even have time to indulge in a little self-praise at a job well done, the market does the opposite of what you expected, and your stop loss is triggered.
This common scenario, which we have all unfortunately experienced, raises the question: What separates these “almost” trades from the truly higher-probability setups?
The State of Alignment
A high-probability setup isn’t necessarily a single signal or chart pattern. It is the coming together of several factors in a way that can potentially increase the likelihood of a successful trade.
When combined, six interconnected layers can come together to form the full “anatomy” of a higher-probability trading setup:
Context
Structure
Confluence
Timing
Management
Psychology
When more of these factors are in place, the greater the (potential) probability your trade will behave as expected.
Market Context
When we explore market context, we are looking at the underlying background conditions that may help some trading ideas thrive, and contribute to others failing.
Regime Awareness
Every trading strategy you choose to create has a natural set of market circumstances that could be an optimum trading environment for that particular trading approach.
For example:
Trending regimes may favour momentum or breakout setups.
Ranging regimes may suit mean-reversion or bounce systems.
High-volatility regimes create opportunity but demand wider stops and quicker management.
Investing time considering the underlying market regime may help avoid the temptation to force a trending system into a sideways market.
Simply looking at the slope of a 50-period moving average or the width of a Bollinger Band can suggest what type of market is currently in play.
Sentiment Alignment
If risk sentiment shifts towards a specific (or a group) of related assets, the technical picture is more likely to change to match that.
For example, if the USD index is broadly strengthening as an underlying move, then looking for long trades in EURUSD setups may end up fighting headwinds.
Setting yourself some simple rules can help, as trading against a potential tidal wave of opposite price change in a related asset is not usually a strong foundation on which to base a trading decision.
Key Reference Zones
Context also means the location of the current price relative to levels or previous landmarks.
Some examples include:
Weekly highs/lows
Prior session ranges, e.g. the Asian high and low as we move into the European session
Major “round” psychological numbers (e.g., 1.10, 1000)
A long trading setup into these areas of market importance may result in an overhead resistance, or a short trade into a potential area of support may reduce the probability of a continuation of that price move before the trade even starts.
Market Structure
Structure is the visual rhythm of price that you may see on the chart. It involves the sequences of trader impulses and corrections that end up defining the overall direction and the likelihood of continuation:
Uptrend: Higher highs (HH) and higher lows (HL)
Downtrend: Lower highs (LH) and lower lows (LL)
Transition: Break in structure often followed by a retest of previous levels.
A pullback in an uptrend followed by renewed buying pressure over a previous price swing high point may well constitute a higher-probability buy than a random candle pattern in the middle of nowhere.
Compression and Expansion
Markets move through cycles of energy build-up and release. It is a reflection of the repositioning of asset holdings, subtle institutional accumulation, or a response to new information, and may all result in different, albeit temporary, broad price scenarios.
Compression: Evidenced by a tightening range, declining ATR, smaller candles, and so suggesting a period of indecision or exhaustion of a previous price move,
Expansion: Evidenced by a sudden breakout, larger candle bodies, and a volume spike, is suggestive of a move that is now underway.
A breakout that clears a liquidity zone often runs further, as ‘trapped’ traders may further fuel the move as they scramble to reposition.
A setup aligned with such liquidity flows may carry a higher probability than one trading directly into it.
Confluence
Confluence is the art of layering independent evidence to create a whole story. Think of it as a type of “market forensics” — each piece of confirmation evidence may offer a “better hand’ or further positive alignment for your idea.
There are three noteworthy types of confluence:
Technical Confluence – Multiple technical tools agree with your trading idea:
Moving average alignment (e.g., 20 EMA above 50 EMA) for a long trade
A Fibonacci retracement level is lining up with a previously identified support level.
Momentum is increasing on indicators such as the MACD.
Multi-Timeframe Confluence – Where a lower timeframe setup is consistent with a higher timeframe trend. If you have alignment of breakout evidence across multiple timeframes, any move will often be strengthened by different traders trading on different timeframes, all jumping into new trades together.
3. Volume Confluence – Any directional move, if supported by increasing volume, suggests higher levels of market participation. Whereas falling volume may be indicative of a lesser market enthusiasm for a particular price move.
Confluence is not about clutter on your chart. Adding indicators, e.g., three oscillators showing the same thing, may make your chart look like a work of art, but it offers little to your trading decision-making and may dilute action clarity.
Think of it this way: Confluence comes from having different dimensions of evidence and seeing them align. Price, time, momentum, and participation (which is evidenced by volume) can all contribute.
Timing & Execution
An alignment in context and structure can still fail to produce a desired outcome if your timing is not as it should be. Execution is where higher probability traders may separate themselves from hopeful ones.
Entry Timing
Confirmation: Wait for the candle to close beyond the structure or level. Avoid the temptation to try to jump in early on a premature breakout wick before the candle is mature.
Retests: If the price has retested and respected a breakout level, it may filter out some false breaks that we will often see.
Then act: Be patient for the setup to complete. Talking yourself out of a trade for the sake of just one more candle” confirmation may, over time, erode potential as you are repeatedly late into trades.
Session & Liquidity Windows
Markets breathe differently throughout the day as one session rolls into another. Each session's characteristics may suit different strategies.
For example:
London Open: Often has a volatility surge; Range breaks may work well.
New York Overlap: Often, we will see some continuation or reversal of morning trends.
Asian Session: A quieter session where mean-reversion or range trading approaches may do well
Trade Management
Managing the position well after entry can turn probability into realised profit, or if mismanaged, can result in losses compounding or giving back unrealised profit to the market.
Pre-defined Invalidation
Asking yourself before entry: “What would the market have to do to prove me wrong?” could be an approach worth trying.
This facilitates stops to be placed logically rather than emotionally. If a trade idea moves against your original thinking, based on a change to a state of unalignment, then considering exit would seem logical.
Scaling & Partial Exits
High-probability trade entries will still benefit from dynamic exit approaches that may involve partial position closes and adaptive trailing of your initial stop.
Trader Psychology
One of the most important and overlooked components of a higher-probability setup is you.
It is you who makes the choices to adopt these practices, and you who must battle the common trading “demons” of fear, impatience, and distorted expectation.
Let's be real, higher-probability trades are less common than many may lead you to believe.
Many traders destroy their potential to develop any trading edge by taking frequent low-probability setups out of a desire to be “in the market.”
It can take strength to be inactive for periods of time and exercise that patience for every box to be ticked in your plan before acting.
Measure “You” performance
Each trade you take becomes data and can provide invaluable feedback. You can only make a judgment of a planned strategy if you have followed it to the letter.
Discipline in execution can be your greatest ally or enemy in determining whether you ultimately achieve positive trading outcomes.
Bringing It All Together – The Setup Blueprint
Final Thoughts
Higher-probability setups are not found but are constructed methodically.
A trader who understands the “higher-probability anatomy” is less likely to chase trades or feel the need to always be in the market. They will see merit in ticking all the right boxes and then taking decisive action when it is time to do so.
It is now up to you to review what you have in place now, identify gaps that may exist, and commit to taking action!