第一阶段花了十年时间真的基本布局完成,特斯拉也逐渐为大众所接受,于是马斯克在2016年公布了Master Plan的2.0版本,也就是计划的第二阶段,提出要创造高效且美观的太阳能板,扩大电动车产品线以满足细分市场需求,包括但不限于大型卡车,轻型卡车和公共运输系统,还强调了人工智能与自动驾驶的价值,并宣称在实现特斯拉全自动驾驶后达成Tesla Network。就当前的实际情况看,第二阶段已经略有雏形但并未完成,电动卡车还未量产,全自动驾驶正在路上,人工智能时不时火爆一下,但缺乏持续性。但不可否认的是,马斯克为特斯拉制定的Master Plan的第一部分和第二部分思路清晰,目标明确,过去近二十年特斯拉一直在为实现计划而努力,这也是是该公司的重要纲领战略,在许多方面为特斯拉的成功铺平了道路,也引领了整个产业的变革。那么对于其Master plan 的3.0版本 ,自然成为了全世界的焦点。其实在 2022 年 3 月,也就是Master plan 2 发布六年后,马斯克就在推特上宣布他正在制定特斯拉总体规划第 3 部分,如今一年过去,3月1号终于要到揭开其神秘面纱的时候了。今天我们就一起来预测下,Master Plan的第三阶段可能会包含哪些概念。根据马斯克去年的推文,他曾预告第三阶段将涉及扩大Tesla至巨大规模,带领人类走出化石能源,大力发展人工智能,计划会包含马斯克的另外两家公司,包括Space X和The Boring Company。
马斯克之前表示,在下一个十年也就是2030年左右,会建立12个年产量在150-200万台特斯拉的工厂,并表示年产2000万台电动车是可实现的。所以Master Plan 3肯定包含巨大规模化,例如如何规模化获取电池材料,按照一台车100Kwh的平均电池来算,特斯拉2000万台就是需要2Twh,这是一个天文数字,要知道中国电池生产霸主宁德时代2021年的电池年产量仅170.39Gwh,而整个中国的产量也只有219.7Gwh,2Twh这个量级的电池如何实现,让我们拭目以待。另外,马斯克在回答员工问题的全公司会议上提到过,为了转移地球的整个能源基础设施和交通基础设施,必须有一个非常高的电池规模,他必须要从大约 300Twh 的车辆和储能装机容量向后推算,那么如果从采矿供能的角度来看,又需要多少能量去开采矿?相关的矿股又能受到多久的暴涨周期?举个例子,最近马斯克和印度尼西亚眉来眼去,据说接近达成50亿美元的镍材料交易订单,当然这些消息在官方公布前都是不能作为参考的,仅仅是折射出了一个可能的信号。还有一点就是机器人领域,这其实在Master plan 2中已经触及了,Optimus机器人可以解决劳动力短缺问题,并大大降低成本,那么自然也能为特斯拉生产制造的规模化贡献力量。特斯拉计划让机器人随着时间的推移逐步改进,最终能够执行更广泛的任务,使其在商业和消费应用领域都有用武之地。因此机器人领域也很可能是马斯克会在Master Plan中涉及的话题。
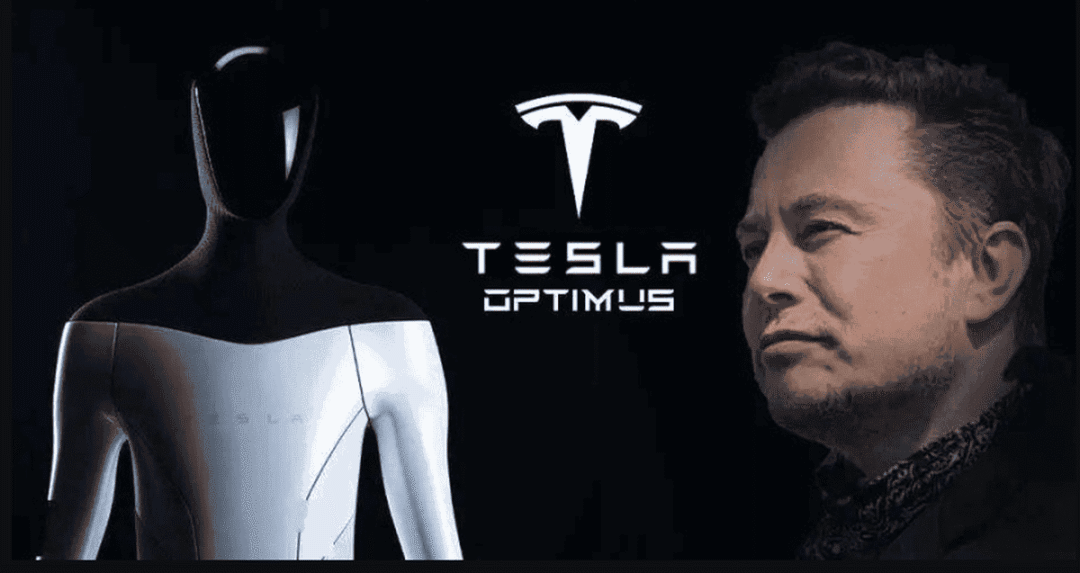
The information provided is of general nature only and does not take into account your personal objectives, financial situations or needs. Before acting on any information provided, you should consider whether the information is suitable for you and your personal circumstances and if necessary, seek appropriate professional advice. All opinions, conclusions, forecasts or recommendations are reasonably held at the time of compilation but are subject to change without notice. Past performance is not an indication of future performance. Go Markets Pty Ltd, ABN 85 081 864 039, AFSL 254963 is a CFD issuer, and trading carries significant risks and is not suitable for everyone. You do not own or have any interest in the rights to the underlying assets. You should consider the appropriateness by reviewing our TMD, FSG, PDS and other CFD legal documents to ensure you understand the risks before you invest in CFDs. 免责声明:文章来自 GO Markets 分析师和参与者,基于他们的独立分析或个人经验。表达的观点、意见或交易风格仅代表作者个人,不代表 GO Markets 立场。建议,(如有),具有“普遍”性,并非基于您的个人目标、财务状况或需求。在根据建议采取行动之前,请考虑该建议(如有)对您的目标、财务状况和需求的适用程度。如果建议与购买特定金融产品有关,您应该在做出任何决定之前了解并考虑该产品的产品披露声明 (PDS) 和金融服务指南 (FSG)。
If you have ever wondered why a forex pair moves sharply on a single Tuesday afternoon, the answer often sits inside one number: the cash rate.
On 5 May 2026, the Reserve Bank of Australia (RBA) raised its cash rate target by 25 basis points (bps) to 4.35%. The decision unwound much of the easing cycle traders had spent the previous year debating. Markets repriced quickly, and the Australian dollar moved against major peers as traders digested the decision.
When one rate decision changes the market mood
For new traders, decisions like this can feel chaotic.
The chart moves before the headline finishes loading. Spreads widen. Stop levels can be tested in seconds. The financial media then fills with confident takes that often disagree with one another.
This playbook is designed to help you make sense of that chaos. Not by predicting the next move, but by understanding how the cash rate works, how it can ripple through markets, and how to prepare a process before the next decision lands.
Important
This article is general market commentary and education only. It does not constitute personal financial advice. Trading CFDs carries significant risk and may not be suitable for everyone.
Part 01
The 101 explainer
Build a clear, foundational understanding before going anywhere near a setup.
The Basics
What the cash rate is, in plain English
The cash rate is the interest rate that commercial banks charge each other for overnight, unsecured loans. The cash rate target is the level a central bank officially sets to steer that market.
In Australia, the RBA sets the cash rate target to manage inflation and employment. While the names vary, each acts as an anchor for the following equivalents:
United States: Federal Funds Rate
United Kingdom: Bank Rate
Eurozone: Main Refinancing Rate
New Zealand: Official Cash Rate
A simple way to think about it is as the wholesale price of money. When that wholesale price rises, the retail prices linked to it, such as mortgage rates, business loans, savings rates and bond yields, often move higher too. When it falls, borrowing costs across the economy tend to ease.
For traders, this is the macro anchor. It is not just a number on an economic calendar; it influences currencies, indices, commodities, and yield-sensitive stocks.
Where the world's major policy rates sit in May 2026
Headline cash rate equivalents at major central banks, expressed in per cent.
Illustrative
Source. Reserve Bank of Australia, US Federal Reserve, Bank of England, European Central Bank, Bank of Japan and Reserve Bank of New Zealand official statements, figures as at May 2026. Educational illustration.
Why It Matters
Why the cash rate matters more than new traders expect
Central bank decisions are among the most closely watched events on the market calendar. That is because one rate decision can influence several markets at once, from currencies and bond yields to share indices, commodities and the cost of holding leveraged positions overnight.
It affects more than currencies
For CFD traders, this matters for two main reasons. First, leverage can magnify both gains and losses when markets are volatile. Around a central bank decision, price can move quickly, spreads can widen and risk controls become especially important.
It can change holding costs
Second, the swap or holding cost on a CFD position is linked to the underlying cash rate. When rates change, the cost of carrying a position overnight may also change. For example, a pair like AUD/JPY can behave differently when the yield gap between Australia and Japan is wide compared with when it is narrow.
Markets can reprice quickly
New traders often underestimate how fast markets can react. A central bank can shift expectations with one sentence in a statement or press conference.
Markets do not wait for the next quarterly review. They often adjust as soon as the message changes.
Vocabulary
The key terms to know
You do not need to memorise every term in this list. These are the ones that come up most often around cash rate decisions.
Cash rate target
The interest rate level set by a central bank to anchor the economy.
Basis points (bps)
1bp = 0.01%. A 25bps move is a 0.25% change in rates.
Repricing
Markets adjusting expectations instantly after new info.
Hawkish vs Dovish: Hawkish leans toward higher rates (supports currency); Dovish leans toward lower rates (weighs on currency).
Yield Differential: The rate gap between two economies that drives capital flows.
Carry trade
Investing in high-yield via low-yield borrowing.
Risk-on/off
Market mood favouring growth vs safe-havens.
Trimmed Mean
Inflation measure that filters out volatile price swings.
Swap or Rollover:
The overnight interest charge/credit for leveraged positions.
Watch for triple swaps on Wednesdays which account for weekend settlement.
Position Sizing
What a 25 bps move may cost you
Basis points can sound abstract until you connect them to position size. Here is a simplified way to show why a small percentage move can matter for a CFD trader. A standard one-lot position in major FX is 100,000 units of the base currency and a 25 bps shift in the underlying cash rate is 0.25% per year.
The point is not the exact cents. It is that small-sounding percentage changes can compound on leveraged positions held for weeks or months.
Position size
Annual exposure to a 25 bps shift
Approximate daily impact
Standard lot, 100,000 units
About 250 units
About 0.68 units
Mini lot, 10,000 units
About 25 units
About 0.07 units
Micro lot, 1,000 units
About 2.50 units
About 0.01 units
Note. Figures are illustrative and shown in the quote currency of the pair. Educational illustration only.
How it works in real market conditions
A central bank decision is rarely just about the rate change itself. The market reaction is shaped by three layers: the decision, the statement, and any press conference or projections.
On 5 May 2026, the RBA raised the cash rate to 4.35%. While the hike was the headline, the statement and subsequent press conference provided the context that allowed markets to reprice bond yields and currency pairs in real time.
AUD/USD often spikes, fades, then trends after a rate decision
Stylised intraday reaction in the first 90 minutes around a hawkish RBA surprise.
Illustrative
Source. Stylised illustration based on typical post-decision price behaviour. Educational purposes only. Liquidity can shift quickly: In the first 5 to 15 minutes after a decision, spreads can widen and fills can slip. High-frequency systems can digest language faster than humans, and mean reversion is common before a clearer trend emerges.
Market Dynamics
How central banks ripple across assets
Cash rate decisions rarely affect one market in isolation. They trigger a domino effect through currencies, yields, and volatility at varying speeds.
This kind of sector dispersion is not just an equities story. The same monetary tightening can produce sharply different outcomes across consumer segments, business sizes and parts of the wider economy, a dynamic sometimes called a K-shaped economy.
Major FX pairs
AUD/USD, EUR/USD, and JPY crosses respond directly to yield differentials.
Short-end yields
The 2-year government bond often acts as a leading indicator for currency moves.
Stock indices
High rates discount future earnings, weighing heavily on growth and tech names.
Gold & safe havens
Bullion reacts to real yields and the USD; hawkish shifts usually pressure gold prices.
Energy markets
Prices feed into inflation expectations, creating a feedback loop for central bank policy.
Market dispersion
When index components move in opposite directions following a rate change.
A tightening cycle can split the ASX 200
Illustrative
Stylised illustration of sector dispersion through a tightening cycle, with index levels rebased to 100.
Source. Stylised illustration based on typical sector behaviour during tightening cycles. Outcomes vary by cycle. Educational purposes only.
The Beginner Trap
What many new traders miss
Markets react to the gap between expectations and reality. A hike that is fully priced in can lead to a falling currency; a hold with hawkish guidance can trigger a rally. The chart is only one part of the story. The setup may look simple, but the risk rarely is.
"Success in these events comes from understanding what is already priced in, and what would change the view if it does not play out that way."
Common mistakes to avoid
• Trading headlines: The initial print is often misleading. Wait for the second wave (statement/press conference).
• Binary leverage: Volatility hits stops harder. Scale risk down into known event risks.
• Chasing moves: Entering late usually means buying exhaustion. Wait for clear retracements.
• Narrative vs. trade: A clear story doesn't guarantee a setup. Ask: "What is already in the price?"
• Indicator myopia: No single signal captures global flows. Watch yields and cross-asset confirmation.
• No Invalidation: Without a clear "I am wrong" level, traders hold losing positions far too long.
Next Strategic Step
Master the volatility cycle
Understanding how the cash rate moves the market is only half the battle. Learn how to read the "Fear Gauge" to identify when volatility creates high-probability entry points.