热门话题在AI大热的今天,不断的有优秀的科技公司崭露头角,其中英伟达,Microsoft等等公司更是发光发热,今天也和大家介绍一个较为不错的公司,Cisco Systems,思科系统公司。
Cisco Systems,思科系统公司(纳斯达克股票代码:CSCO)一直是信息技术和网络领域的全球领导者。尽管经济形势出现波动,但它始终表现出韧性。思科成立于1984年,总部位于加利福尼亚州圣何塞,是一家跨国技术集团。专业从事网络硬件、软件、通讯设备等高科技产品的开发、制造、销售和服务。如今,思科在超过165个国家/地区开展业务,拥有超过75,000名员工。
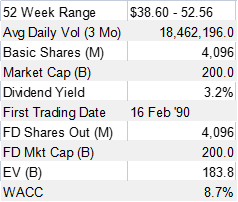
(Source:FactSet)
股票表现截至2023年5月23日,思科股价为48.82美元,较去年同期大幅上涨。该股票经历了大幅增长,反映出其令人印象深刻的运营和财务业绩。52周区间为38.6美元至52.56 美元,表明过去一年股票表现一致。
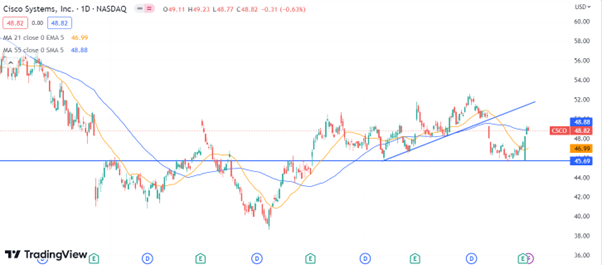
(Source:Tradingview)
思科的股价在今年还是很有意思的,开年开始上涨,但是到4月份跌破了上升趋势线,在45支撑位不破的情况下,迎来了一波反弹。目前上方阻力位置在52左右。最近的财务状况其2023年第三季度报告中,思科公布的净收入为32.1亿美元,即每股收益0.78美元,高于去年同期6%。该公司的收入为146亿美元,同比增长14%,超出分析师的预期。这些积极的财务业绩凸显了思科强大的资产负债表和产生稳定收入的能力,即使在全球不确定性的情况下也是如此。
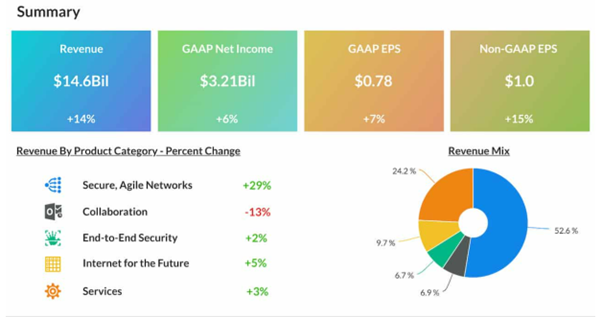
(Source:Alphastreet)
思科系统行业分析行业概况Cisco Systems 在信息技术和网络行业运营。该部门构成了数字时代的支柱,推动了全球经济各个部门的连通性、生产力和创新。该行业包括几个部分,包括网络设备、软件、服务和电信。在当前的数字时代,各类企业的日常运营都依赖于网络。该行业对于管理组织内部及其外部接口的数据、资源和通信需求至关重要。市场动态信息技术和网络行业在各种因素的推动下经历了显著增长:数字化转型:许多企业正在进行数字化转型,导致对网络解决方案和服务的需求增加。这推动了行业的增长。云采用:向基于云的解决方案的日益转变是另一个关键驱动因素。随着越来越多的企业迁移到云端,对高效、安全和强大的网络解决方案的需求正在上升。网络安全问题:随着数字数据和在线交易的增加,网络安全威胁也在增加。这推动了对能够提供足够安全性的高级网络解决方案的需求。远程工作趋势:全球COVID-19大流行导致远程工作激增,需要可靠、安全和可扩展的远程连接解决方案。5G技术:5G技术的出现是另一个关键因素。预计它将显著提高网络的速度和效率,从而带来新的应用和增加的需求。竞争力在快速的技术进步和创新的推动下,该行业的特点是竞争激烈。主要竞争对手包括Juniper Networks、Arista Networks、华为和Hewlett Packard Enterprise 等公司。这场竞争促使包括思科在内的公司不断创新和发展他们的产品以保持市场相关性。思科系统公司的立场Cisco Systems 是该行业的知名企业,拥有广泛的产品组合和强大的全球影响力。它已经证明了其有效适应不断变化的市场动态和技术进步的能力。该公司转向软件和服务的战略,以及对网络安全和云技术的关注,为未来的增长奠定了良好的基础。然而,它必须不断创新并在竞争中保持领先地位才能保持其市场地位。估值
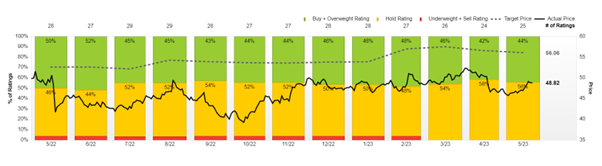
市场对于思科的股价估值是相对比较保守的,目前来说平均价格在56美元左右。购买评级买入和持有属于55开。总结考虑到上述因素,思科股票的前景是乐观的。它提供健康的股息收益率,拥有强大的资产负债表,并且在一个具有高增长潜力的行业中运营。但是,建议投资者密切关注上述风险以及公司缓解这些风险的能力。思科稳健的财务业绩、战略收购和强大的领导力使公司处于有利的发展位置。5G的扩展和数字化程度的提高带来了巨大的增长机会。然而,不应低估与激烈竞争、政策变化和技术演进相关的风险。对于长期投资者而言,思科提供了可靠的投资机会,前提是他们能够接受与技术行业相关的风险。对于短线交易者而言,股票的波动可能提供获利机会。目前来看,价格在45美元左右有着重要的支撑位,而上方之前的高位52美元也有着相对强势的阻力,若是价格上破52美元,那么上行空间将被打开。免责声明:GO Markets分析师或外部发言人提供的信息基于其独立分析或个人经验。所表达的观点或交易风格仅代表其个人;并不代表GO Markets的观点或立场。联系方式:墨尔本 03 8658 0603悉尼 02 9188 0418中国地区(中文) 400 120 8537中国地区(英文) +248 4 671 903作者:Neo Yuan | GO Markets 分析师

The information provided is of general nature only and does not take into account your personal objectives, financial situations or needs. Before acting on any information provided, you should consider whether the information is suitable for you and your personal circumstances and if necessary, seek appropriate professional advice. All opinions, conclusions, forecasts or recommendations are reasonably held at the time of compilation but are subject to change without notice. Past performance is not an indication of future performance. Go Markets Pty Ltd, ABN 85 081 864 039, AFSL 254963 is a CFD issuer, and trading carries significant risks and is not suitable for everyone. You do not own or have any interest in the rights to the underlying assets. You should consider the appropriateness by reviewing our TMD, FSG, PDS and other CFD legal documents to ensure you understand the risks before you invest in CFDs. 免责声明:文章来自 GO Markets 分析师和参与者,基于他们的独立分析或个人经验。表达的观点、意见或交易风格仅代表作者个人,不代表 GO Markets 立场。建议,(如有),具有“普遍”性,并非基于您的个人目标、财务状况或需求。在根据建议采取行动之前,请考虑该建议(如有)对您的目标、财务状况和需求的适用程度。如果建议与购买特定金融产品有关,您应该在做出任何决定之前了解并考虑该产品的产品披露声明 (PDS) 和金融服务指南 (FSG)。