热门话题WeWork 破产,投资WeWork的故事为什么不靠谱?WeWork Inc. 从未弄清楚如何赚钱。但创始人Adam Neumann仍是亿万富翁,哪怕如今已经破产,身价仍然为 17 亿美元。WeWork拥有190亿美元的负债和150亿美元的资产。包括软银集团公司和愿景基金在内的长期投资者将进一步增加在该合资企业中承受的巨额损失。WeWork Inc.周三首次出现在破产法庭,启动了长达数月的程序,且该公司无力偿还超过40亿美元的借款。

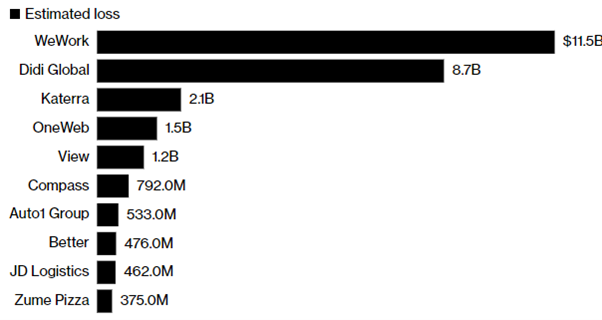
2019年,公司估值达到470亿美元,成为当时美国估值最高的创业公司。但是,他提供的服务却并没有很强的稀缺性。商业物业办公租赁。并且,该模式需要大量现金流,一旦现金流为负,很容易倒闭。2021年,WeWork营收25.7亿美元,净亏损约为44.4亿美元,2022年营收约32. 5亿美元,净亏约22.9亿美元。此前WeWork通过与一家收购公司合并上市时,诺伊曼拥有23 亿美元的财富,其中近三分之一持有 WeWork 股票。但之后,它们的跌幅已超过 99%。咱也不知道,为什么机构这么看好这家公司,还是说只是一个击鼓传花的游戏。大鱼吃小鱼,软银为了营造一个繁荣的IPO项目。在经济不景气的这几年,WeWork有很多大笔支出,其中包括 1.85 亿美元的竞业禁止协议、1.06 亿美元的和解付款以及诺伊曼旗下 We Holdings 向软银出售股票所获得的 5.78 亿美元。同时,孙正义为WeWork提供了高额贷款和担保。WeWork 的破产给亿万富翁孙正义创立并领导的软银造成了约 115 亿美元的股权损失,另外还有 22 亿美元的债务悬而未决。一笔生意亏了上百亿美金。孙正义在WeWork身上亏掉了106亿美元,他还在滴滴身上也亏掉了110亿美元。连续的大额亏损也让他的投资能力受到质疑。孙正义旗下基金亏损情况:
而对于创始人Adam来说,从2022年8月开始,重点就放在新的项目Flow上面,将经营多户住宅物业,旨在培养主人翁感和社区感。从商业地产回归到住宅地产。并成功获得10亿美金风投。作为一家上市公司,WeWork从未实现盈利,净亏损总计 30 亿美元。他的出发点是承诺提供一个与同事共度时光的有趣空间,提供桶装啤酒、乒乓球桌和大量舒适的休闲空间,供人们喝酒吹牛。但很明显,对于社交属性来说,为WeWork买单的公司并不多。在澳洲,也有几家WeWork的地点,但并没有招满公司。而WeWork的竞争对手也很多,其中不少先后破产或跑路。原因在于疫情之后,商业物业的青睐程度下降。很多人和企业开始Work from home,居家办公。同时远程办公开始流行。这件事情很难靠谱的原因就在于,成功只有一种情况,而每一个因素的变化,都会导致公司快速亏损:经济衰退、居家办公、利率上涨、竞争出现。而这四个因素在疫情后快速出现。作为“二房东”的WeWork,首当其冲承受了所有,但是不见得他的客户们,也有充足的租金继续在WeWork办公。因为WeWork的群体并不是中大型公司,这些中大型公司都有自己独立的办公室。比如GO Markets,在墨尔本有两层办公室,在悉尼也是独立海景办公室。因为中大型公司是不会share分享办公场地的,需要有一定的保密性和正规性。什么样的人会在WeWork办公呢?sole trader或者IT服务类的会在WeWork办公,也就是本来就是可以work from home的人会选择WeWork。但是疫情后,澳洲居家办公可以抵扣税务,同时上涨的房租或者利率,让大家不愿意拿闲钱再去租一个工位或者小办公室,很多时候谈事情,在咖啡店就可以了。所以,WeWork的倒闭是时间问题,除非一直有资金输血。我们在做股票投资的时候,优先要投资未来有成长正现金流的生意,孙正义失败也在于他过于依赖于估值游戏,忽略了投资本身的核心:公司是要赚钱的。免责声明:GO Markets分析师或外部发言人提供的信息基于其独立分析或个人经验。所表达的观点或交易风格仅代表其个人;并不代表GO Markets的观点或立场。联系方式:墨尔本 03 8658 0603悉尼 02 9188 0418中国地区(中文) 400 120 8537中国地区(英文) +248 4 671 903作者:Jacky Wang | GO Markets 亚洲投研部主管

The information provided is of general nature only and does not take into account your personal objectives, financial situations or needs. Before acting on any information provided, you should consider whether the information is suitable for you and your personal circumstances and if necessary, seek appropriate professional advice. All opinions, conclusions, forecasts or recommendations are reasonably held at the time of compilation but are subject to change without notice. Past performance is not an indication of future performance. Go Markets Pty Ltd, ABN 85 081 864 039, AFSL 254963 is a CFD issuer, and trading carries significant risks and is not suitable for everyone. You do not own or have any interest in the rights to the underlying assets. You should consider the appropriateness by reviewing our TMD, FSG, PDS and other CFD legal documents to ensure you understand the risks before you invest in CFDs. 免责声明:文章来自 GO Markets 分析师和参与者,基于他们的独立分析或个人经验。表达的观点、意见或交易风格仅代表作者个人,不代表 GO Markets 立场。建议,(如有),具有“普遍”性,并非基于您的个人目标、财务状况或需求。在根据建议采取行动之前,请考虑该建议(如有)对您的目标、财务状况和需求的适用程度。如果建议与购买特定金融产品有关,您应该在做出任何决定之前了解并考虑该产品的产品披露声明 (PDS) 和金融服务指南 (FSG)。