热门话题
4. Pilbara Minerals Ltd (ASX: PLS)
Pilbara Minerals Ltd市值为13.70 billion在澳大利亚运营勘探,开发和运营矿产资源,主要持有位于西澳Pilbara地区的 Pilgangoora 锂钽项目 100% 的权益。Pilgangoora矿体是世界上最大的硬岩锂矿床之一,在全球锂供应链中具有重要的战略意义。澳大利亚该地区拥有世界上最重要的矿业辖区之一,因此配备一流配套的基础设施,包括道路和港口并且收到争渡的安全法规支持。过去几年中,全球下游企业对于锂矿需求的快速增长,而全球了锂供应上澳洲占全球总产量80%。因此对于行业来说,受需求增长推动,锂价格有进一步上升的空间。5. Mineral Resources Ltd (ASX: MIN)
Mineral Resources是一家以铁矿石和锂为主的采矿服务公司,市值高达13.45 billion以提供安全,高质量,低成本的采矿业业务而闻名。此外,公司拥有位于西澳的Mount Marion和Wodgina锂项目的权益。公司净利润率高为34%,同时公司主要的运营业务被分为三大部门:采矿服务部门,大宗商品部门和中央业务部分。这三大业务为公司带来的收入占比如下图所示。
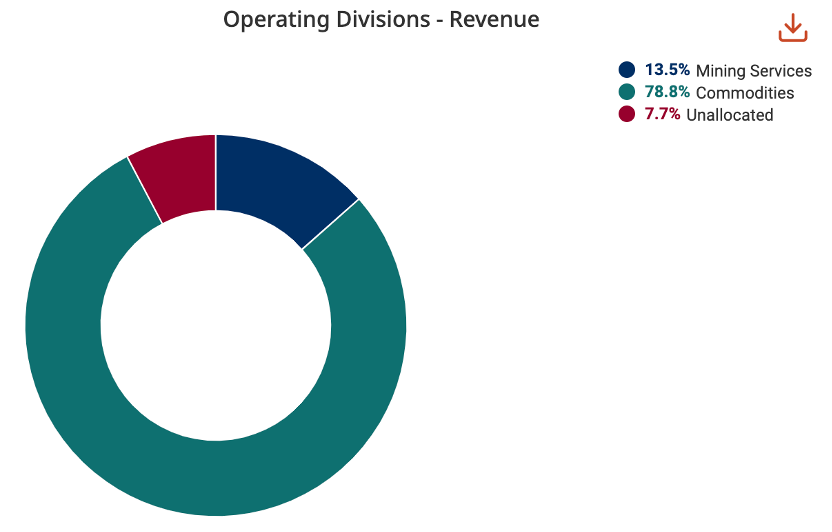
Mineral Resource收入来源按地区区分主要分成澳大利亚,中国,新加坡和国际。在2021财年,分别占公司整体收入的14.6%,8.6% 和76.8%。同时,Mineral Resource还是澳大利亚电池材料矿产开采行业三大龙头公司之一,其他两家分别为Windfield Holding和Glencore Operations Australia。MIN的市场份额为8%。其中Windfield Holding总部位于Perth并由中国公司天齐锂业和美国Albemarle共同所有。预计未来5年,锂矿石生产行业由于电池供应链规模不断扩大发展前景良好。6. IGO Ltd (ASX: IGO)
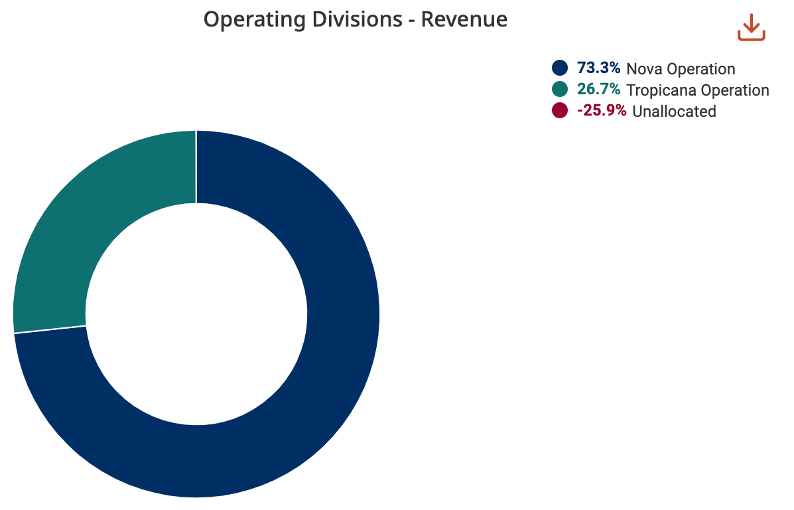
IGO是以开发和运营以金属为重点的勘探和开采公司,市值达到11.02 billion。同时IGO面向未来的技术,进军包括交通电气化、能源储存和可再生能源发电等领域。公司主要项目有Nova 镍铜钴业务,Nova业务部门收入为6.688亿澳元占21财年收入的73.3%,主要生产镍(51.8%)、钴(2.5%)、铜(12.8%)和银(0.2%)。Tropicana业务已于2021年5月被出售。但是2021财年公司运营收入主要来源是Nova和Tropicana两个矿产的运营收入(占比如下图所示),因此公司主要收入来源是Nova 镍铜钴业务。
IGO公司新增锂业务部门主要由于2021财年末最后一天宣布和天齐锂业股权合资企业中占有49%的权益。IGO拥有Greenbushes锂矿的间接51%的股权同时拥有Kwinana氢氧化锂精炼厂。Greenbushes锂矿拥有全球硬岩锂矿中最高级别的矿石储备,Kwinana氢氧化锂精炼厂则是全球首批全自动电池级氢氧化锂设施之一。同时,全球碳酸锂需求飙升导致碳酸锂价格上涨80%,Greenbushes锂矿将会为IGO带来折旧前利润大约2.8亿澳元。IGO净利润率88.5%远高于行业平均,净收入增长为253.8%。7. Northern Star Resources Ltd (ASX: NST) 9.01B
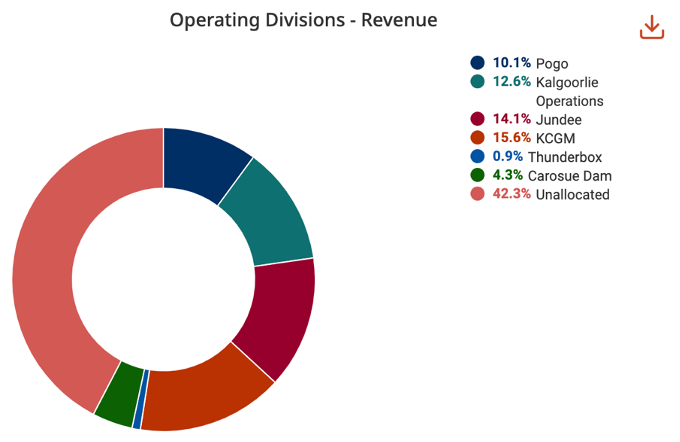
Northern Star Resources是一家9.01 billion市值的黄金矿商。公司主要从事金矿的勘探、开发、开采和加工,并出售精炼黄金。公司主要运营的部门包括Yandal生产中心(包括位于西澳大利亚的 Jundee、Thunderbox),Kalgoorlie生产中心(包括East Kundana合营资产——Northern Star所占权益为51%和Kanowna Belle金矿)和Pogo生产中心。净利润率高为37.4%但是资金周转率低仅为0.2收入占比中14.1%。
8. Lynas Rare Earths Ltd (ASX: LYC)
Lynas Rare Earths 是市值为7.54B的稀土公司,主要从事澳大利亚和马来西亚的稀有矿物勘探,开发,提取和加工。稀土氧化物(REO)在高科技和低碳行业中起到了至关重要的作用,同时具备出量稀少,不可再生和加工难度大等特点。需求大,供应少导致稀土价格一直飙升。而澳洲作为资源大国,以410万吨储量排名世界第六,生产力位居世界第四。

Lynas Rare Earths是除中国外唯一一家同时具备稀土开采和加工的企业,也是全球第二大稀土生产商。公司主要运营位于西澳的Mt Weld,这是世界公认最高品质的稀土矿山之一。Lynas将从Mt Weld初步开采的原料运至位于马拉西亚Gebeng的原料工厂,从而生产高质量的稀土材料。同时,Lynas在马拉西亚运营的工厂是世界上最大的单一稀土加工厂。Lynas Rare Earths净利润率高达32.1%,并且在2017-21财年年度增长率高达21.2%。
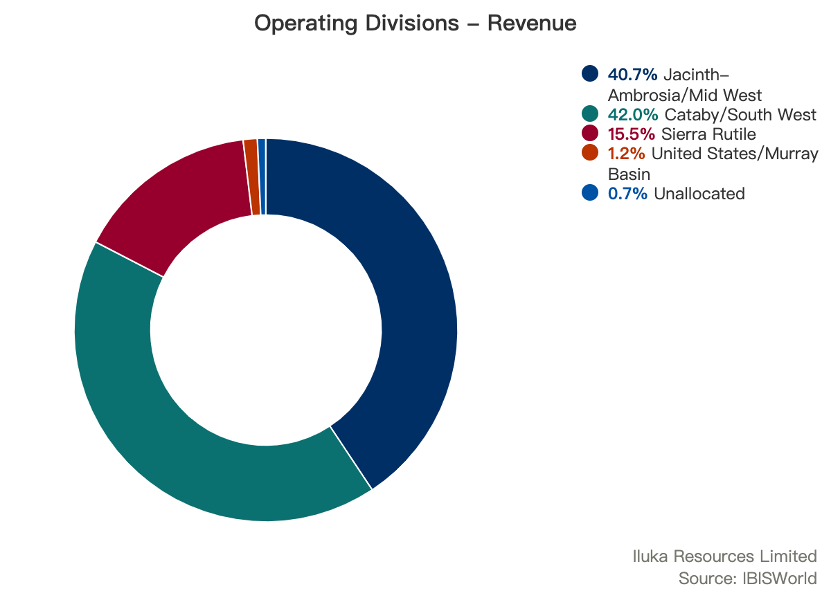
9. Iluka Resources (ASX: ILU) 4.28B
Iluka Resources 从事勘探,开发和加工矿砂业务。Iluka Resources是全球锆石主要生产商,市场占有率约三分之一。主要是开采砂矿中的钛铁矿、金红石和锆石三种重矿物。这些材料主要用于陶瓷、油漆、航天和医疗。该公司的主要部门包括 Jacinth-Ambrosia/Mid West (JA/MW)、Cataby/South West (C/SW)、Sierra Rutile (SRL)、美国/Murray Basin (US/MB)。JA/MW 部门包括位于南澳大利亚的 Jacinth-Ambrosia 的采矿业务,以及位于南澳大利亚中西部的 Narngulu 矿物分离厂的相关加工业务。是世界上最大的锆石矿,用于制造陶瓷,包括地板和墙砖和卫生洁具,以及铸造方面的应用。锆石也用于制造锆化学制品,这些制品有一系列的衍生应用,包括锆金属。同时,该项目还生产金红石和用于合成金红石钛铁矿。C/SW 部门包括位于西澳大利亚的 Cataby 的采矿活动和合成金红石窑 2 的钛铁矿加工。SRL 部门包括塞拉利昂的综合矿砂开采和加工业务。而Iluka Resources的运营收入主要来源就是这几个地方的采矿业务(如下图所示)。
砂矿行业在过去的五年内以每年1.4%对速度增长达到31亿澳元,并且预计在家下来行业表现依旧强劲,预计未来继续增长。10. Liontown Resources Ltd (ASX: LTR)
Liontown Resources主要业务在电池金属材料的勘探和开发,拥有3.74 billion的市值。公司开发供应电动汽车和储能行业所需的矿物。主要业务项目包括Kathleen Valley, Buldania 和 Lithium Hydroxide Refinery,这些项目都依赖都位于西澳大利亚州的矿区。Liontown Resources作为的锂开发商主要业务Kathleen Valley项目是位于Perth东北部约680公里处,是全澳最好的矿区之一。矿区产能为250万吨/年及锂辉石精矿50万吨/年。还计划在未来扩建至产量增至400万吨/年及锂辉石精矿70万吨/年。同时,Liontown Resources在今年Kathleen Valley锂项目的电力供应合同授予澳大利亚独立电力生产商Zenith Energy,预计2024年上半年建成澳大利亚最大的离网可再生能源发电能力。同时,特斯拉也是Liontown Resources的合作商之一,两家公司于2022年签署买卖合约。协议将于2024生效,第一年提供给特斯拉10万干公吨锂辉石精矿,之后每年供应15万干公吨接近Kathleen Valley项目总产能的三分之一。总体宏观总结从整体来看,西澳矿业为全国的重中之重。澳洲多家知名矿业公司都依赖着西澳各大矿区的支持。从以上多家西澳矿业公司分析,各家都有着自身的竞争优势。例如专注于差异化策略:专注于稀土的Lynas Rare Earths, 专注于黄金的黄金矿商Northern Star Resources,专注于电池金属材料的Liontown Resources。也有专注低成本来强化竞争优势的Lynas Rare Earths,澳洲的原料开采到马来西亚工厂的加工一条龙降低成本,从而造就高达32.1%的净利润率。有市场份额占比极高的Fortescue Metals Group Ltd (ASX: FMG)(占比5%)和Woodside Energy Ltd (ASX: WDS)(占比3%-4%)业务稳定,利润稳定增长。澳洲采矿业整个行业呈现高利润,高收入增长和高壁垒,因此投资采矿业公司对于投资者来说是充满前景的选择。大宗商品价格、汇率变动、全球供应趋势、产量变化以及国内外对大宗商品的需求都严重影响矿业部门的业绩。在过去的五年采矿业一直保持增长,并且表现出稳定的市场需求。免责声明:GO Markets分析师或外部发言人提供的信息基于其独立分析或个人经验。所表达的观点或交易风格仅代表其个人;并不代表GO Markets的观点或立场。联系方式:墨尔本 03 8658 0603悉尼 02 9188 0418中国地区(中文) 400 120 8537中国地区(英文) +248 4 671 903作者:Sherry Lin | GO Markets 助理分析师

The information provided is of general nature only and does not take into account your personal objectives, financial situations or needs. Before acting on any information provided, you should consider whether the information is suitable for you and your personal circumstances and if necessary, seek appropriate professional advice. All opinions, conclusions, forecasts or recommendations are reasonably held at the time of compilation but are subject to change without notice. Past performance is not an indication of future performance. Go Markets Pty Ltd, ABN 85 081 864 039, AFSL 254963 is a CFD issuer, and trading carries significant risks and is not suitable for everyone. You do not own or have any interest in the rights to the underlying assets. You should consider the appropriateness by reviewing our TMD, FSG, PDS and other CFD legal documents to ensure you understand the risks before you invest in CFDs. 免责声明:文章来自 GO Markets 分析师和参与者,基于他们的独立分析或个人经验。表达的观点、意见或交易风格仅代表作者个人,不代表 GO Markets 立场。建议,(如有),具有“普遍”性,并非基于您的个人目标、财务状况或需求。在根据建议采取行动之前,请考虑该建议(如有)对您的目标、财务状况和需求的适用程度。如果建议与购买特定金融产品有关,您应该在做出任何决定之前了解并考虑该产品的产品披露声明 (PDS) 和金融服务指南 (FSG)。