如果个人要想发一颗卫星的话,一般要怎么操作呢?从世界范围来讲,如果你要想发一颗卫星,简单来说大概分四步。第一步,你要想发射卫星,自己制造也好,购买也罢,先要有一颗。中国的话,中国航天科技集团下属的中国卫星就是专门承接此类业务的。根据大小以及功能,价格所不同,一颗北斗卫星的成本大概在七到八亿元人民币左右;第二步就是发射,目前,世界上几个能发射洲际导弹的国家都有稳定安全发射卫星能力,大都也都承接卫星发射的业务;第三就是需要像刚才提到的ITU提出申请,申请卫星频段和轨道,防止卫星在天上发生碰撞;第四,很多国家都会有自己的监管机构,所以同样还要通过国家级别的申请和审核。最后,在发射之后,如果需要跟卫星通讯联系,比如发出一些调整姿态的指令,接受一些回传的信息,还需要有地面通讯设备,所以还得有个地面站。卫星从发射到管理维护,目前都有比较成熟的市场和服务。以上所有发射前发射后的服务都有不止一家公司可选。对于私人卫星来说,现在比较常见的服务形式就是卫星轨道交付。这就好比精装修的房子,你只要选好户型,甚至连家具都能给包了。你只要提出需求,对方可以从卫星制造发射升空到后续维护管理,给你几个不同方案,你从中选择即可。私人的商业发射公司中比较有名的几家美国公司,比如蓝色起源,比如理查德维京的virgin orbit,波音也在进行一项名为CST-100的载人飞船研究计划。所以先不说star link 贴身飞过天宫空间站的事,发射卫星这个事貌似并没有我们平常想象的门槛那么高。目前在轨卫星大概六千多颗,其中百分之六十都是失效卫星,也就是所谓太空垃圾天上交通拥挤的事儿,已经不是一天两天了。如果搜索太空碎片的话,还会搜到一些有意思的新闻,比如中国进行的反卫星武器实验造成的一些碎片,使得国际空间站不得不采取躲避措施。这次实验是2007年的时候中国用反卫星武器摧毁了自己的一颗退役的气象卫星。实验成功的同时造成了三千多片太空碎片。根据美国的报道,这些碎片在2011年和2019年两次和国际空间站擦肩而过,俄罗斯也进行过一次反卫星武器实验。美国严厉谴责俄罗斯这种不负责任而且危险的行为。看了很多报道,总体感觉这几个太空大国互相谴责对方是常态。
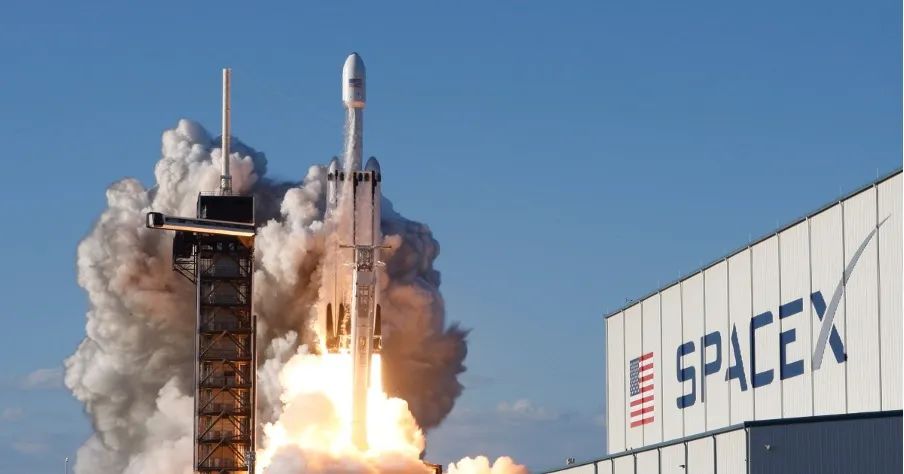
马斯克所有的公司都不是先驱者,特斯拉汽车、猎鹰火箭或者脑机接口都是在前人的基础上进行了产品开发,更好的适合市场需求,同时大幅度降低了成本。Space X 按照时间来说,在所有卫星发射企业当中不算早。但是目前来说,这家公司跑得最快,发射成本最低。它最大的贡献就是在确保成功率和大载荷的前提下,大大降低了发射成本。Star Link 目前在轨一千七百多颗卫星,最终计划将发射四万两千颗卫星,覆盖世界上大多数人口。
The information provided is of general nature only and does not take into account your personal objectives, financial situations or needs. Before acting on any information provided, you should consider whether the information is suitable for you and your personal circumstances and if necessary, seek appropriate professional advice. All opinions, conclusions, forecasts or recommendations are reasonably held at the time of compilation but are subject to change without notice. Past performance is not an indication of future performance. Go Markets Pty Ltd, ABN 85 081 864 039, AFSL 254963 is a CFD issuer, and trading carries significant risks and is not suitable for everyone. You do not own or have any interest in the rights to the underlying assets. You should consider the appropriateness by reviewing our TMD, FSG, PDS and other CFD legal documents to ensure you understand the risks before you invest in CFDs. 免责声明:文章来自 GO Markets 分析师和参与者,基于他们的独立分析或个人经验。表达的观点、意见或交易风格仅代表作者个人,不代表 GO Markets 立场。建议,(如有),具有“普遍”性,并非基于您的个人目标、财务状况或需求。在根据建议采取行动之前,请考虑该建议(如有)对您的目标、财务状况和需求的适用程度。如果建议与购买特定金融产品有关,您应该在做出任何决定之前了解并考虑该产品的产品披露声明 (PDS) 和金融服务指南 (FSG)。
If you have ever wondered why a forex pair moves sharply on a single Tuesday afternoon, the answer often sits inside one number: the cash rate.
On 5 May 2026, the Reserve Bank of Australia (RBA) raised its cash rate target by 25 basis points (bps) to 4.35%. The decision unwound much of the easing cycle traders had spent the previous year debating. Markets repriced quickly, and the Australian dollar moved against major peers as traders digested the decision.
When one rate decision changes the market mood
For new traders, decisions like this can feel chaotic.
The chart moves before the headline finishes loading. Spreads widen. Stop levels can be tested in seconds. The financial media then fills with confident takes that often disagree with one another.
This playbook is designed to help you make sense of that chaos. Not by predicting the next move, but by understanding how the cash rate works, how it can ripple through markets, and how to prepare a process before the next decision lands.
Important
This article is general market commentary and education only. It does not constitute personal financial advice. Trading CFDs carries significant risk and may not be suitable for everyone.
Part 01
The 101 explainer
Build a clear, foundational understanding before going anywhere near a setup.
The Basics
What the cash rate is, in plain English
The cash rate is the interest rate that commercial banks charge each other for overnight, unsecured loans. The cash rate target is the level a central bank officially sets to steer that market.
In Australia, the RBA sets the cash rate target to manage inflation and employment. While the names vary, each acts as an anchor for the following equivalents:
United States: Federal Funds Rate
United Kingdom: Bank Rate
Eurozone: Main Refinancing Rate
New Zealand: Official Cash Rate
A simple way to think about it is as the wholesale price of money. When that wholesale price rises, the retail prices linked to it, such as mortgage rates, business loans, savings rates and bond yields, often move higher too. When it falls, borrowing costs across the economy tend to ease.
For traders, this is the macro anchor. It is not just a number on an economic calendar; it influences currencies, indices, commodities, and yield-sensitive stocks.
Where the world's major policy rates sit in May 2026
Headline cash rate equivalents at major central banks, expressed in per cent.
Illustrative
Source. Reserve Bank of Australia, US Federal Reserve, Bank of England, European Central Bank, Bank of Japan and Reserve Bank of New Zealand official statements, figures as at May 2026. Educational illustration.
Why It Matters
Why the cash rate matters more than new traders expect
Central bank decisions are among the most closely watched events on the market calendar. That is because one rate decision can influence several markets at once, from currencies and bond yields to share indices, commodities and the cost of holding leveraged positions overnight.
It affects more than currencies
For CFD traders, this matters for two main reasons. First, leverage can magnify both gains and losses when markets are volatile. Around a central bank decision, price can move quickly, spreads can widen and risk controls become especially important.
It can change holding costs
Second, the swap or holding cost on a CFD position is linked to the underlying cash rate. When rates change, the cost of carrying a position overnight may also change. For example, a pair like AUD/JPY can behave differently when the yield gap between Australia and Japan is wide compared with when it is narrow.
Markets can reprice quickly
New traders often underestimate how fast markets can react. A central bank can shift expectations with one sentence in a statement or press conference.
Markets do not wait for the next quarterly review. They often adjust as soon as the message changes.
Vocabulary
The key terms to know
You do not need to memorise every term in this list. These are the ones that come up most often around cash rate decisions.
Cash rate target
The interest rate level set by a central bank to anchor the economy.
Basis points (bps)
1bp = 0.01%. A 25bps move is a 0.25% change in rates.
Repricing
Markets adjusting expectations instantly after new info.
Hawkish vs Dovish: Hawkish leans toward higher rates (supports currency); Dovish leans toward lower rates (weighs on currency).
Yield Differential: The rate gap between two economies that drives capital flows.
Carry trade
Investing in high-yield via low-yield borrowing.
Risk-on/off
Market mood favouring growth vs safe-havens.
Trimmed Mean
Inflation measure that filters out volatile price swings.
Swap or Rollover:
The overnight interest charge/credit for leveraged positions.
Watch for triple swaps on Wednesdays which account for weekend settlement.
Position Sizing
What a 25 bps move may cost you
Basis points can sound abstract until you connect them to position size. Here is a simplified way to show why a small percentage move can matter for a CFD trader. A standard one-lot position in major FX is 100,000 units of the base currency and a 25 bps shift in the underlying cash rate is 0.25% per year.
The point is not the exact cents. It is that small-sounding percentage changes can compound on leveraged positions held for weeks or months.
Position size
Annual exposure to a 25 bps shift
Approximate daily impact
Standard lot, 100,000 units
About 250 units
About 0.68 units
Mini lot, 10,000 units
About 25 units
About 0.07 units
Micro lot, 1,000 units
About 2.50 units
About 0.01 units
Note. Figures are illustrative and shown in the quote currency of the pair. Educational illustration only.
How it works in real market conditions
A central bank decision is rarely just about the rate change itself. The market reaction is shaped by three layers: the decision, the statement, and any press conference or projections.
On 5 May 2026, the RBA raised the cash rate to 4.35%. While the hike was the headline, the statement and subsequent press conference provided the context that allowed markets to reprice bond yields and currency pairs in real time.
AUD/USD often spikes, fades, then trends after a rate decision
Stylised intraday reaction in the first 90 minutes around a hawkish RBA surprise.
Illustrative
Source. Stylised illustration based on typical post-decision price behaviour. Educational purposes only. Liquidity can shift quickly: In the first 5 to 15 minutes after a decision, spreads can widen and fills can slip. High-frequency systems can digest language faster than humans, and mean reversion is common before a clearer trend emerges.
Market Dynamics
How central banks ripple across assets
Cash rate decisions rarely affect one market in isolation. They trigger a domino effect through currencies, yields, and volatility at varying speeds.
This kind of sector dispersion is not just an equities story. The same monetary tightening can produce sharply different outcomes across consumer segments, business sizes and parts of the wider economy, a dynamic sometimes called a K-shaped economy.
Major FX pairs
AUD/USD, EUR/USD, and JPY crosses respond directly to yield differentials.
Short-end yields
The 2-year government bond often acts as a leading indicator for currency moves.
Stock indices
High rates discount future earnings, weighing heavily on growth and tech names.
Gold & safe havens
Bullion reacts to real yields and the USD; hawkish shifts usually pressure gold prices.
Energy markets
Prices feed into inflation expectations, creating a feedback loop for central bank policy.
Market dispersion
When index components move in opposite directions following a rate change.
A tightening cycle can split the ASX 200
Illustrative
Stylised illustration of sector dispersion through a tightening cycle, with index levels rebased to 100.
Source. Stylised illustration based on typical sector behaviour during tightening cycles. Outcomes vary by cycle. Educational purposes only.
The Beginner Trap
What many new traders miss
Markets react to the gap between expectations and reality. A hike that is fully priced in can lead to a falling currency; a hold with hawkish guidance can trigger a rally. The chart is only one part of the story. The setup may look simple, but the risk rarely is.
"Success in these events comes from understanding what is already priced in, and what would change the view if it does not play out that way."
Common mistakes to avoid
• Trading headlines: The initial print is often misleading. Wait for the second wave (statement/press conference).
• Binary leverage: Volatility hits stops harder. Scale risk down into known event risks.
• Chasing moves: Entering late usually means buying exhaustion. Wait for clear retracements.
• Narrative vs. trade: A clear story doesn't guarantee a setup. Ask: "What is already in the price?"
• Indicator myopia: No single signal captures global flows. Watch yields and cross-asset confirmation.
• No Invalidation: Without a clear "I am wrong" level, traders hold losing positions far too long.
Next Strategic Step
Master the volatility cycle
Understanding how the cash rate moves the market is only half the battle. Learn how to read the "Fear Gauge" to identify when volatility creates high-probability entry points.