The Australian Consumer data was released today with Consumer Price Index rising to 6.1% over the past 12 months. For the quarter, the CPI rose by 1.8% which was 0.1% lower then what analysts expected the figure to be. This was also lower then the 2.1% jump seen in the previous March quarter.
The most significant contributors to the increase were new dwellings, +5.6%, and automotive fuel +4.2%. Whilst the overall numbers were only slightly off what was expected, the update provided some small relief to a market that has been dealing with record high-inflation. Australian Treasurer, Jim Chalmers stated that “Inflation is high and rising.
It will get tougher before it gets easier.” In response the XJO, (ASX200) saw a big spike, shooting up by 0.36% in the 5-minutes post the announcement. Conversely, the AUDUSD dropped from $0.6946 to $0.6913 in the half hour after the announcement as the market adjusts the value of the AUD to the likely lower interest rates. Bond Market responds The bond market responded by lowering its predicted interest rate hike next Tuesday by the Reserve bank of Australia.
The interbank futures were implying a 16% chance for a 75-basis point shift before the announcement. However, now the bond market is pricing in a 92% chance of 50 basis point move. Commonwealth Bank of Australia has also confirmed its expectation of a 50-point hike at the next meeting.
The bond futures market is also adjusted its prediction of a cash rate of 3.18% by the end of the year against the 3.38% that was forecast before the meeting. With important data to come out of the USA tonight including Q/Q advance GDP figures as well as the Federal Reserve’s Cash Rate announcement, the end of the week may very well continue to be volatile.
By
GO Markets
本文由 GO Markets 的分析師及撰稿人撰寫,內容基於其獨立分析或個人經驗。文中所表達的觀點、意見或交易風格均屬作者個人,並不代表或反映 GO Markets 的立場。任何提供的建議均屬一般性,並未考慮您的個人目標、財務狀況或需求。在採取任何行動之前,請考慮該建議是否適合您的目標、財務狀況與需求。若該建議涉及購買特定金融產品,請於作出任何決定前,先閱讀我們網站上提供的《產品揭露聲明書》(Disclosure Statement, DS)及其他法律文件。
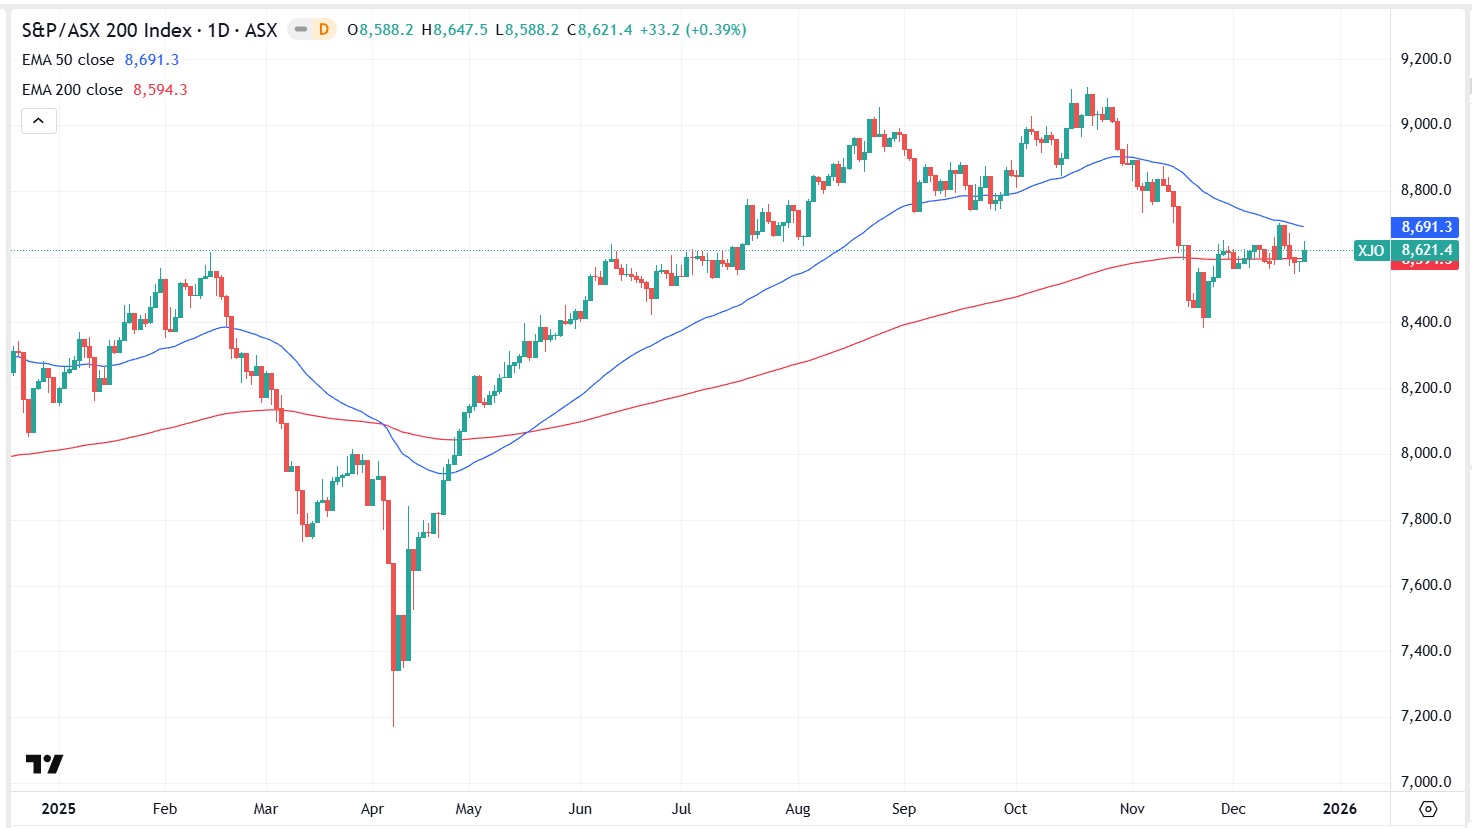
In 2025, the ASX 200 closed around 8,621 points and was up approximately 6% year to date (YTD) as of 19 December close. Market direction was most sensitive to Reserve Bank of Australia (RBA) expectations, commodity prices and China-linked demand, and (to a lesser extent) moves in the Australian dollar (AUD). The index recovered from November’s pullback, but remained below October’s record close.
Key 2025 drivers included:
RBA policy expectations: Sentiment was shaped by shifting views on the timing and extent of rate moves. The November pullback reflected repricing towards a longer pause and higher uncertainty around whether the next move could be a hike rather than a cut, particularly as jobs and inflation data surprised.
Resources and China sensitivity: With a meaningful resources weight, the index responded to iron ore stability, strong gold prices and relative firmness in base metals. China data and any perceived policy support (including signals from the People’s Bank of China (PBOC)) remained important for the export backdrop. A relatively stable AUD also reduced currency-related noise for exporters.
Index composition and market structure: The ASX 200’s heavier tilt to materials and banks, and lower exposure to high-growth technology, meant it often lagged tech-led global rallies, but tended to hold up better when AI and growth valuations were questioned.
Corporate earnings: Reporting season outcomes influenced valuation support. In September’s half-year reporting season, around 33% of ASX 200 companies beat expectations, which helped underpin pricing around current levels.
Current state
The ASX 200 was roughly 5% below its late-October record high close of 9,094 points. After the November retracement, support around 8,400 appeared to hold and buying interest improved. The 50-day EMA near 8,730 (a prior consolidation area) was a commonly watched near-term reference, noting technical indicators can be unreliable.
What to watch in January
China and commodity demand: Growth, trade and any fresh stimulus inference from the PBOC may affect sentiment.
Domestic inflation and labour data: CPI and jobs prints are key inputs into RBA expectations.
Key levels and follow-through: The post-November rebound may need continued demand to sustain momentum.
Source: Trading View
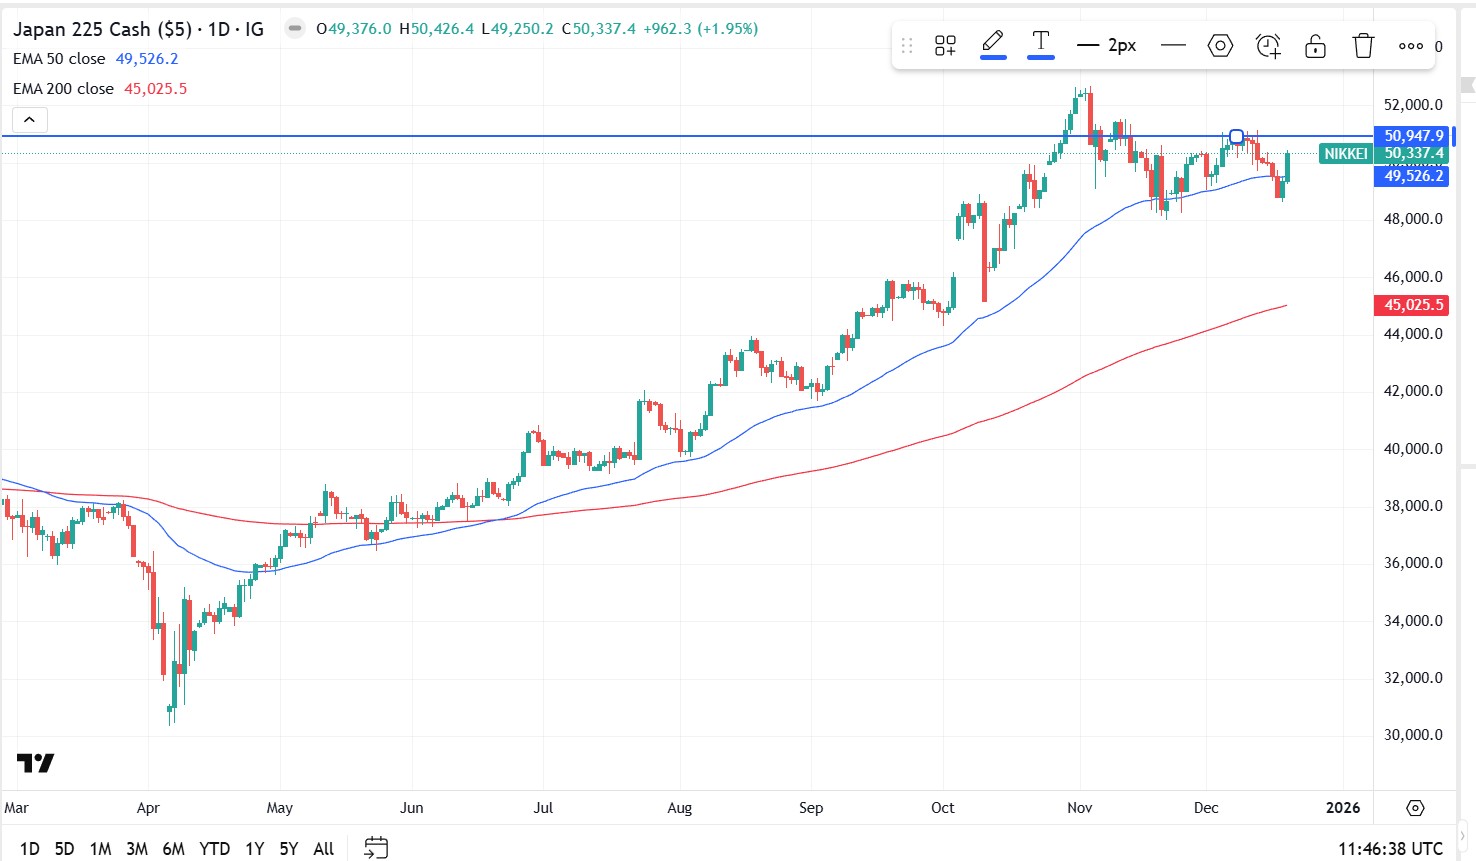
What moved the Nikkei 225 in 2025?
In 2025, the Nikkei 225 traded around 39,200 points and was up approximately 21% year to date (YTD). Market direction was most sensitive to moves in the Japanese yen (JPY) and Bank of Japan (BOJ) communication, with the index consolidating after multi-decade highs. While broader signals remained constructive, consolidation can resolve either higher or lower.
Key influences included:
JPY movements and earnings translation: A weaker JPY can boost the reported value of overseas earnings for some exporters, although it may also increase input and import costs. The net impact often depends on company hedging practices and varies by sector, with effects most evident in export-heavy industries such as automotive, industrials and parts of technology manufacturing.
Gradual BOJ policy transition: The BOJ continued to step away from ultra-easy settings, but tightening was generally cautious. Markets largely priced a slow, conditional normalisation, which helped limit downside, even as policy headlines created bouts of volatility.
Corporate governance reforms: Ongoing improvements in capital efficiency and shareholder returns supported interest from overseas investors. Share buybacks, stronger balance-sheet discipline and improved return on equity (ROE) contributed to re-rating in parts of the market.
Global cyclical exposure: The Nikkei moved with shifts in global manufacturing sentiment and expectations for US growth, particularly during risk-on phases associated with AI-related capital spending.
Current state
After pushing to multi-decade highs earlier in the year, the Nikkei spent time consolidating but has remained structurally strong. Price sits above key long-term moving averages, and some technicians watch the 50-day exponential moving average (EMA) as a potential reference level (noting these indicators can be unreliable). Currency swings and shifting BOJ expectations were commonly cited as contributors to much of the second-half volatility, although pullbacks were generally met with buying interest.
What to watch in January for Japan
JPY volatility: Sharper yen moves, especially if driven by BOJ or Federal Reserve expectations, could quickly change exporter earnings assumptions.
BOJ communication: Small changes in language on inflation persistence or bond market operations may move sentiment.
Global growth data: US and China manufacturing and trade prints remain key inputs for an externally focused economy.
The ASX 200 closed out the 2025 financial year on a high, reaching a new intra-month peak of 8,592 in June and within touching distance of the all-time record. The index delivered a 1.4% total return for the month, rounding off a strong final quarter with a 9.5% return and locking in a full-year gain of 13.8% — its best performance since 2021.This strong finish all came down to the postponement of the Liberation Day tariffs. From the April 7 lows through to the end of the financial year, the ASX followed the rest of the world. Mid-cap stocks were the standout performers, beating both large and small caps as investors sought growth opportunities away from the extremes of the market. Among the sectors, Industrials outperformed Resources, benefiting from more stable earnings and supportive macroeconomic trends tied to infrastructure and logistics.But the clear winner was Financials, which contributed an incredible 921 basis points to the overall index return. CBA was clearly the leader here, dominating everything with 457 basis points on its own. Westpac, NAB, and others also played a role, but nothing even remotely close to CBA. The Industrials and Consumer Discretionary sectors made meaningful contributions, adding 176 and 153 basis points, respectively. While Materials, Healthcare, and Energy all lagged, each detracting around 45 to 49 basis points. Looking at the final quarter of the financial year, Financials were by far the biggest player again, adding 524 basis points — more than half the quarter’s total return of 9.5%. Apart from a slight drag from the Materials sector, all other parts of the market made positive contributions. Real Estate, Technology, and Consumer Discretionary followed behind as key drivers. Once again, CBA was the largest individual contributor, adding 243 basis points in the quarter, while NAB, WBC, and Macquarie Group added a combined 384 basis points. On the other side of the ledger, key underperformers included BHP, CSL, Rio Tinto, Treasury Wine Estates, and IDP Education, which all weighed on quarterly performance.One of the most defining features of the 2025 financial year was the dominance of price momentum as a market driver — something we as traders must be aware of. Momentum strategies far outpaced more traditional, fundamental-based approaches such as Growth, Value, and Quality. The most effective signal was a nine-month momentum measure (less the most recent month), which delivered a 31.2% long-short return. The more commonly used 12-month price momentum factor was also highly effective, returning 23.6%. By contrast, short-term reversals buying last month’s losers and selling last month’s winners was the worst-performing approach, with a negative 16.4% return. Compared to the rest of the world, the Australian market was one of the strongest trades for momentum globally, well ahead of both the US and Europe, despite its relatively slow overall performance.Note: these strategies are prone to reversal, and in the early days of the new financial year, there has been a notable shift away from momentum-based trading to other areas. Now is probably too early to say whether this marks a sustained change, but it cannot be ignored, and caution is always advised.The second big story of FY26 will be CBA. CBA’s growing influence was a key story of FY25. Its weight in the index rose by an average of 2.1 percentage points across the year, reaching an average of 11.5% by June. That helped push the spread between the Financials and Resources sectors to 15.8 percentage points — the widest gap since 2018. Despite the strong cash returns, market valuations are eye-watering; at one point during June, CBA became the world’s most expensive bank on price metrics. The forward price-to-earnings multiple now sits at 18.9 times. This is well above the long-term average of 14.7 and higher than the 10-year benchmark of 16.1. Meanwhile, the dividend yield has slipped to 3.4%, down from the historical average of 4.4%. Earnings momentum remains soft, with FY25 growth estimates still tracking at 1.4%, and FY26 forecast at a moderate 5.4%. This suggests that recent gains have come more from expanding valuation multiples than from actual earnings upgrades, making the August reporting date a catalyst day for it and, by its size, the market as a whole.On the macro front, attention now turns to the Reserve Bank of Australia. The central bank cut the cash rate by 25 basis points to 3.6% at its July meeting. Recent commentary from the RBA has taken on a more dovish tone, with benign inflation data and ongoing global uncertainty expected to outweigh the strength of the labour market. The RBA appears to be steering toward a neutral policy stance, and markets will be watching for further signals on how that shift will be managed. Recent economic data has been mixed. May retail sales were weaker than expected, while broader household spending indicators held up slightly better. Building approvals saw a smaller-than-hoped-for bounce, employment remains strong, but productivity is low. Inflation is now at a 3-year low and falling; all this points to underlying support from the RBA’s easing bias both now and into the first half of FY26.As we move into FY26, the key questions are:
Can fundamentals wrestle back control over momentum?
Will earnings growth catch up to price to justify valuations?
How will policy decisions from the RBA and other central banks shape investor sentiment in an ever-volatile world?
While the early signs suggest a possible rotation, the jury is still out on whether this marks a new phase for the Australian market or just a brief pause in the rally that defined FY25.
While recent data has shown core inflation moderating, core PCE is on track to average below target at just 1.6% annualised over the past three months.Federal Reserve Chair Jerome Powell made clear that concerns about future inflation, especially from tariffs, remain top of mind.“If you just look backwards at the data, that’s what you would say… but we have to be forward-looking,” Powell said. “We expect a meaningful amount of inflation to arrive in the coming months, and we have to take that into account.”While the economy remains strong enough to buy time, policymakers are closely monitoring how tariff-related costs evolve before shifting policy. Powell also stated that without these forward-looking risks, rates would likely already be closer to the neutral rate, which is a full 100 basis points from current levels.
2. The Unemployment Rate anchor
Powell repeatedly cited the 4.2% unemployment rate during the press conference, mentioning it six times as the primary reason for keeping rates in restrictive territory. At this level, employment is ahead of the neutral rate.“The U.S. economy is in solid shape… job creation is at a healthy level,” Powell added that real wages are rising and participation remains relatively strong. He did, however, acknowledge that uncertainty around tariffs remains a constraint on future employment intentions.If not for a decline in labour force participation in May, the unemployment rate would already be closer to 4.6%. Couple this with the continuing jobless claims ticking up and hiring rates subdued, risks are building around labour market softening.
3. Autumn Meetings are Live
While avoiding firm forward guidance, Powell hinted at a timeline:“It could come quickly. It could not come quickly… We feel like the right thing to do is to be where we are… and just learn more.”This suggests the Fed will remain on hold through the July meeting, using the summer to assess incoming data, particularly whether tariffs meaningfully push inflation higher. If those effects prove limited and unemployment begins to rise, the stage could be set for a rate cut in September.
In 2025, the ASX 200 closed around 8,621 points and was up approximately 6% year to date (YTD) as of 19 December close. Market direction was most sensitive to Reserve Bank of Australia (RBA) expectations, commodity prices and China-linked demand, and (to a lesser extent) moves in the Australian dollar (AUD). The index recovered from November’s pullback, but remained below October’s record close.
Key 2025 drivers included:
RBA policy expectations: Sentiment was shaped by shifting views on the timing and extent of rate moves. The November pullback reflected repricing towards a longer pause and higher uncertainty around whether the next move could be a hike rather than a cut, particularly as jobs and inflation data surprised.
Resources and China sensitivity: With a meaningful resources weight, the index responded to iron ore stability, strong gold prices and relative firmness in base metals. China data and any perceived policy support (including signals from the People’s Bank of China (PBOC)) remained important for the export backdrop. A relatively stable AUD also reduced currency-related noise for exporters.
Index composition and market structure: The ASX 200’s heavier tilt to materials and banks, and lower exposure to high-growth technology, meant it often lagged tech-led global rallies, but tended to hold up better when AI and growth valuations were questioned.
Corporate earnings: Reporting season outcomes influenced valuation support. In September’s half-year reporting season, around 33% of ASX 200 companies beat expectations, which helped underpin pricing around current levels.
Current state
The ASX 200 was roughly 5% below its late-October record high close of 9,094 points. After the November retracement, support around 8,400 appeared to hold and buying interest improved. The 50-day EMA near 8,730 (a prior consolidation area) was a commonly watched near-term reference, noting technical indicators can be unreliable.
What to watch in January
China and commodity demand: Growth, trade and any fresh stimulus inference from the PBOC may affect sentiment.
Domestic inflation and labour data: CPI and jobs prints are key inputs into RBA expectations.
Key levels and follow-through: The post-November rebound may need continued demand to sustain momentum.
Source: Trading View
What moved the Nikkei 225 in 2025?
In 2025, the Nikkei 225 traded around 39,200 points and was up approximately 21% year to date (YTD). Market direction was most sensitive to moves in the Japanese yen (JPY) and Bank of Japan (BOJ) communication, with the index consolidating after multi-decade highs. While broader signals remained constructive, consolidation can resolve either higher or lower.
Key influences included:
JPY movements and earnings translation: A weaker JPY can boost the reported value of overseas earnings for some exporters, although it may also increase input and import costs. The net impact often depends on company hedging practices and varies by sector, with effects most evident in export-heavy industries such as automotive, industrials and parts of technology manufacturing.
Gradual BOJ policy transition: The BOJ continued to step away from ultra-easy settings, but tightening was generally cautious. Markets largely priced a slow, conditional normalisation, which helped limit downside, even as policy headlines created bouts of volatility.
Corporate governance reforms: Ongoing improvements in capital efficiency and shareholder returns supported interest from overseas investors. Share buybacks, stronger balance-sheet discipline and improved return on equity (ROE) contributed to re-rating in parts of the market.
Global cyclical exposure: The Nikkei moved with shifts in global manufacturing sentiment and expectations for US growth, particularly during risk-on phases associated with AI-related capital spending.
Current state
After pushing to multi-decade highs earlier in the year, the Nikkei spent time consolidating but has remained structurally strong. Price sits above key long-term moving averages, and some technicians watch the 50-day exponential moving average (EMA) as a potential reference level (noting these indicators can be unreliable). Currency swings and shifting BOJ expectations were commonly cited as contributors to much of the second-half volatility, although pullbacks were generally met with buying interest.
What to watch in January for Japan
JPY volatility: Sharper yen moves, especially if driven by BOJ or Federal Reserve expectations, could quickly change exporter earnings assumptions.
BOJ communication: Small changes in language on inflation persistence or bond market operations may move sentiment.
Global growth data: US and China manufacturing and trade prints remain key inputs for an externally focused economy.
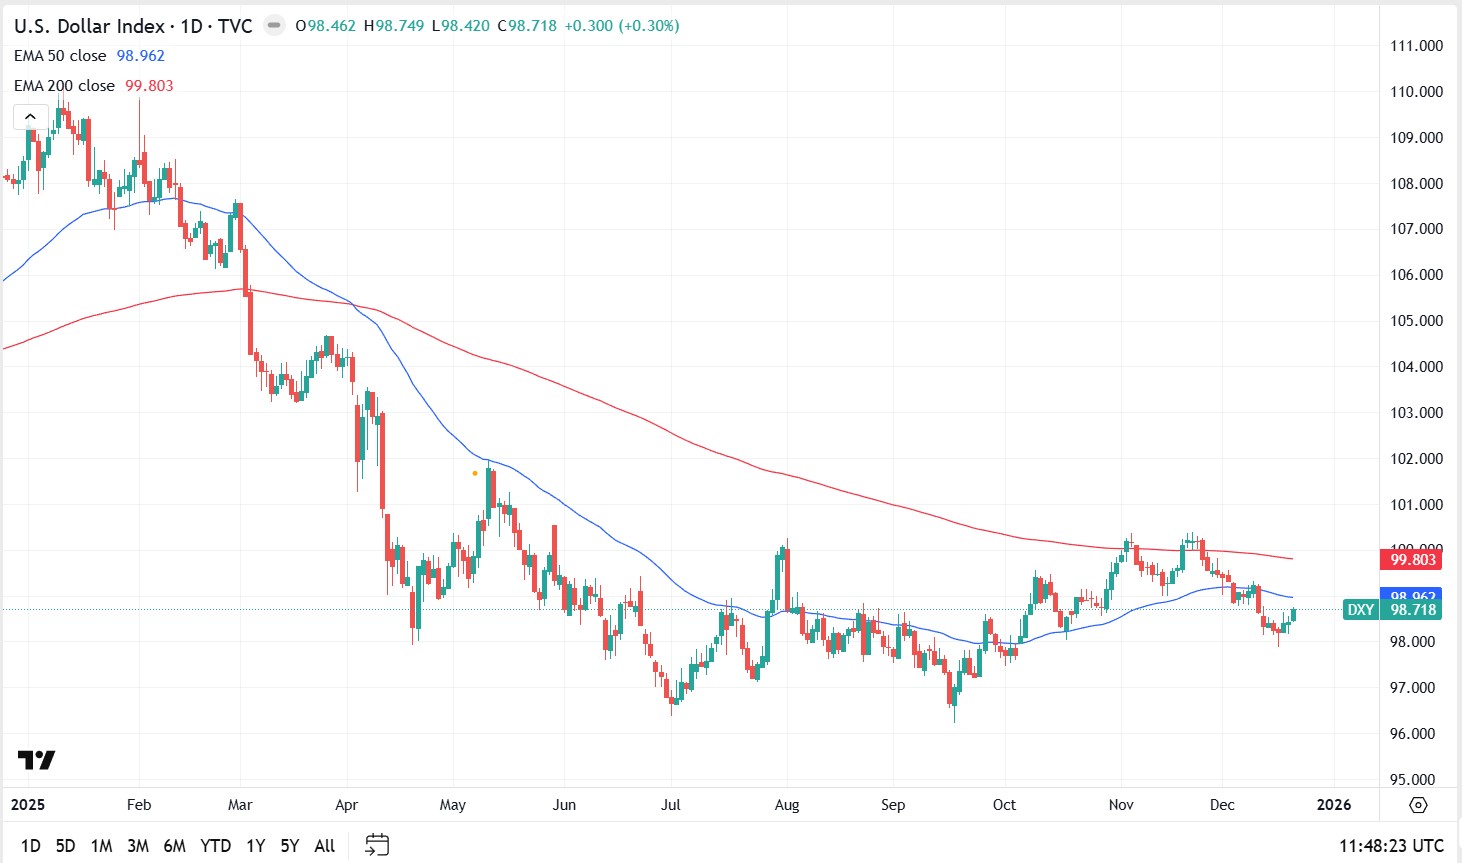
2025 has seen a material decline in the fortunes of the greenback. A technical structure breakdown early in the year was followed by a breach of the 200-day moving average (MA) at the end of Q1. The index then entered correction territory, printing a three-year low at the end of Q2.
Since then, we have seen attempts to build a technical base, including a re-test of the end-of-June lows in mid-September. However, buying pressure has not been strong enough to push price back above the technically critical and psychologically important 100 level.
What the levels suggest from here
As things stand, the index remains more than 10% lower for 2025. On this technical view, the index may revisit the 96 area. However, technical levels can fail and outcomes depend on multiple factors.
US dollar index
Source: TradingView
The key question for 2026
The key question remains: are we likely to see further losses in the early part of next year and beyond, or will current support hold?
We cannot assess the US dollar in isolation and any outlook is shaped by internal and global factors, not least its relative strength versus other major currencies. Many of these drivers are interrelated, but four potential headwinds stand out for any US dollar recovery. Collectively, they may keep downside pressure in play.
Four headwinds for any US dollar recovery
1. The US dollar as a safe-haven trade
One scenario where US dollar support has historically been evident is during major global events, slowdowns and market shocks. However, the more muted response of the US dollar during risk-off episodes this year suggests a shift away from the historical norm, with fewer sustained US dollar rallies.
Instead, throughout 2025, some investors appearedto favour gold, and at other times, FX and even equities, rather than into the US dollar. If this change in behaviour persists through 2026, it could make recovery harder, even if global economic pressure builds over the year ahead.
2. US versus global trade
Trade policy is harder to measure objectively, and outcomes can be difficult to predict. That said, trade battles driven by tariffs on US imports are often viewed as an additional potential drag on the US dollar.
The impact may be twofold if additional strain is placed on the US economy through:
a slowdown in global trade volumes as impacted countries seek alternative trade relationships, with supply chain distortions that may not favour US growth
pressure on US corporate profit margins as tariffs lift costs for importers
3. Removal of quantitative tightening
The Fed formally halted its balance sheet reduction, quantitative tightening (QT), as of 1 December 2025, ending a program that shrank assets by roughly US$2.4 trillion since mid-2022.
Traditionally, ending QT is seen as marginally negative for the US dollar because it stops the withdrawal of liquidity, can ease global funding conditions, and may reduce the scarcity that can support dollar demand. Put simply, more dollars in the system can soften the currency’s support at the margin, although outcomes have varied historically and often depend on broader financial conditions.
4. Interest rate differential
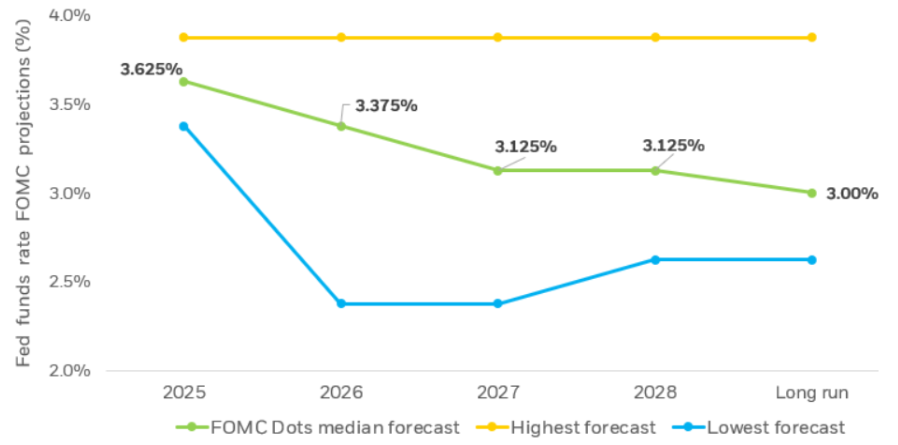
Interest rate differential (IRD) is likely to be a primary driver of US dollar strength, or otherwise, in the months ahead. The latest FOMC meeting delivered the expected 0.25% cut, with attention on guidance for what may come next.
Even after a softer-than-expected CPI print, markets have been reluctant to price aggressive near-term easing. At the time of writing, less than a 20% chance of a January cut is priced in, and it may be March before we see the next move.
The Fed is balancing sticky inflation against a jobs market under pressure, with the headline rate back at levels last seen in 2012. The practical takeaway is that a more accommodative stance may add to downward pressure on the US dollar.
Current expectations imply around two rate cuts through 2026, with the potential for further easing beyond that, broadly consistent with the median projections shown in the chart below. These are forecasts rather than guarantees, and they can shift as economic data and policy guidance evolve.
Source: US Federal Reserve, Summart of Economic Projections
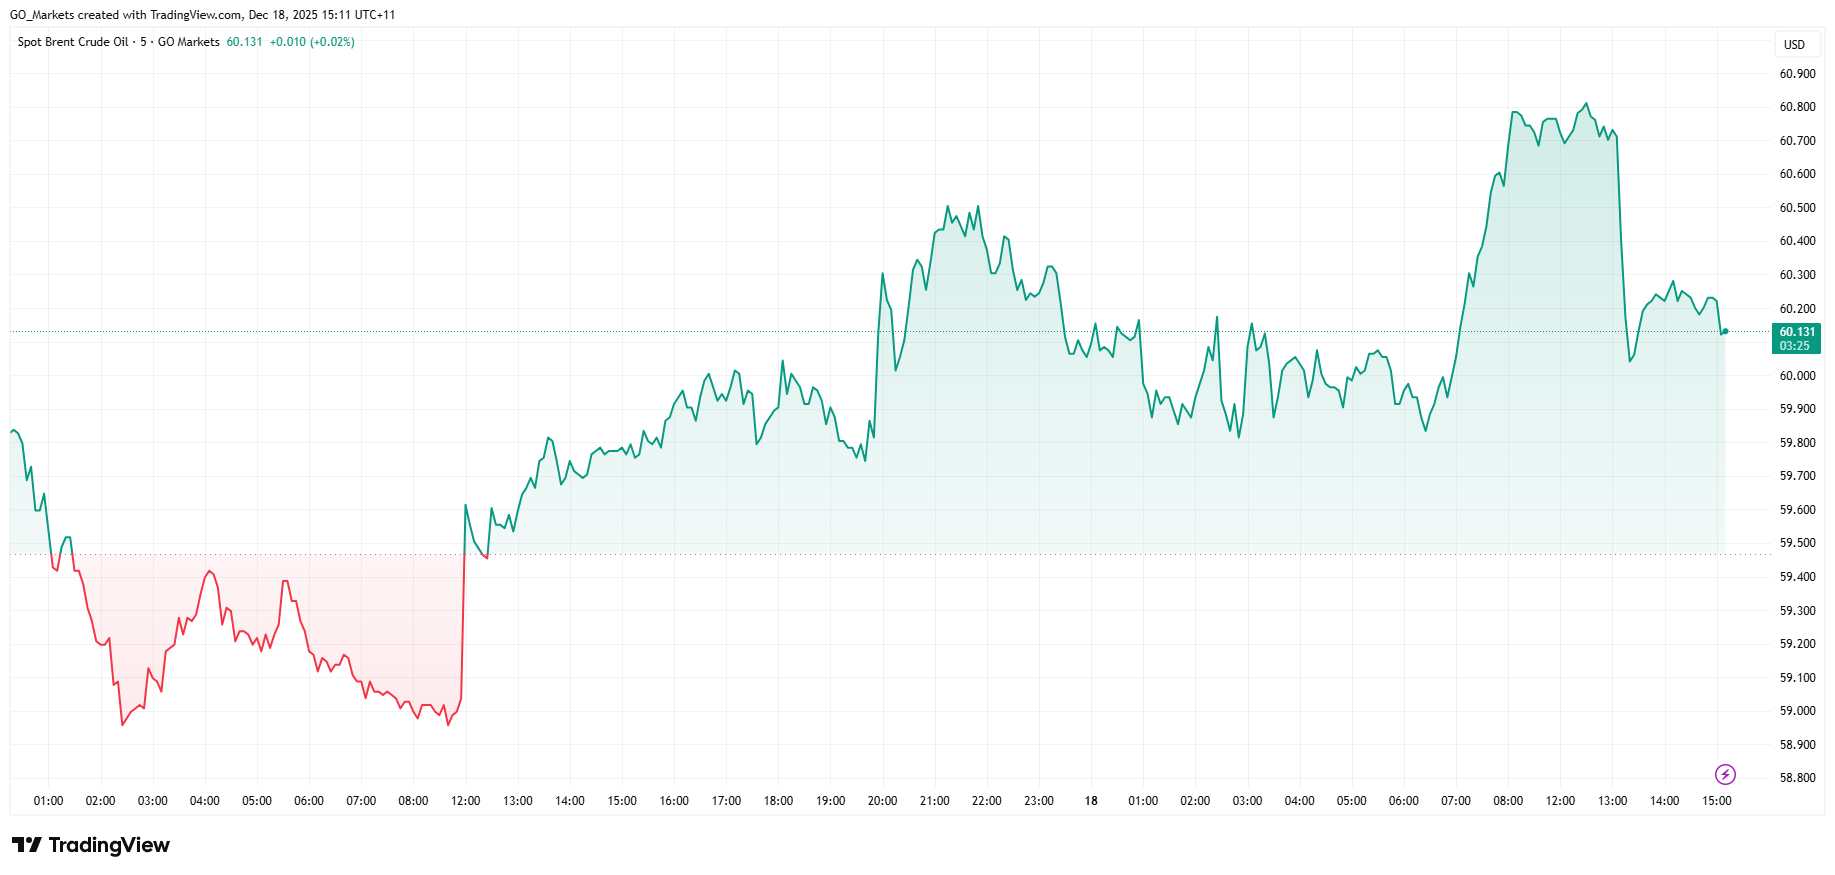
Donald Trump has officially declared the Maduro regime in Venezuela a foreign terrorist organisation and ordered a "total and complete blockade" of the country's sanctioned oil tankers.
The U.S. has positioned 11 warships in the Caribbean to enforce the blockade, which could remove 400,000 to 500,000 barrels daily from global supply.
The move sent crude prices jumping over 2% and sparked renewed concerns about supply stability heading into 2026.
UKOUSD 48-hour chart
White House Chief of Staff Susie Wiles succinctly summarised the situation as: “Trump wants to keep on blowing boats up until Maduro cries uncle."
Brent crude jumped 2.4% to $60.33 per barrel, while WTI climbed 2.6% to $56.69.
If crude maintains its $60 per barrel price, analysts project the blockade, combined with potential Russian sanctions, could push prices toward $70 as Venezuela's already-devastated economy faces collapse.
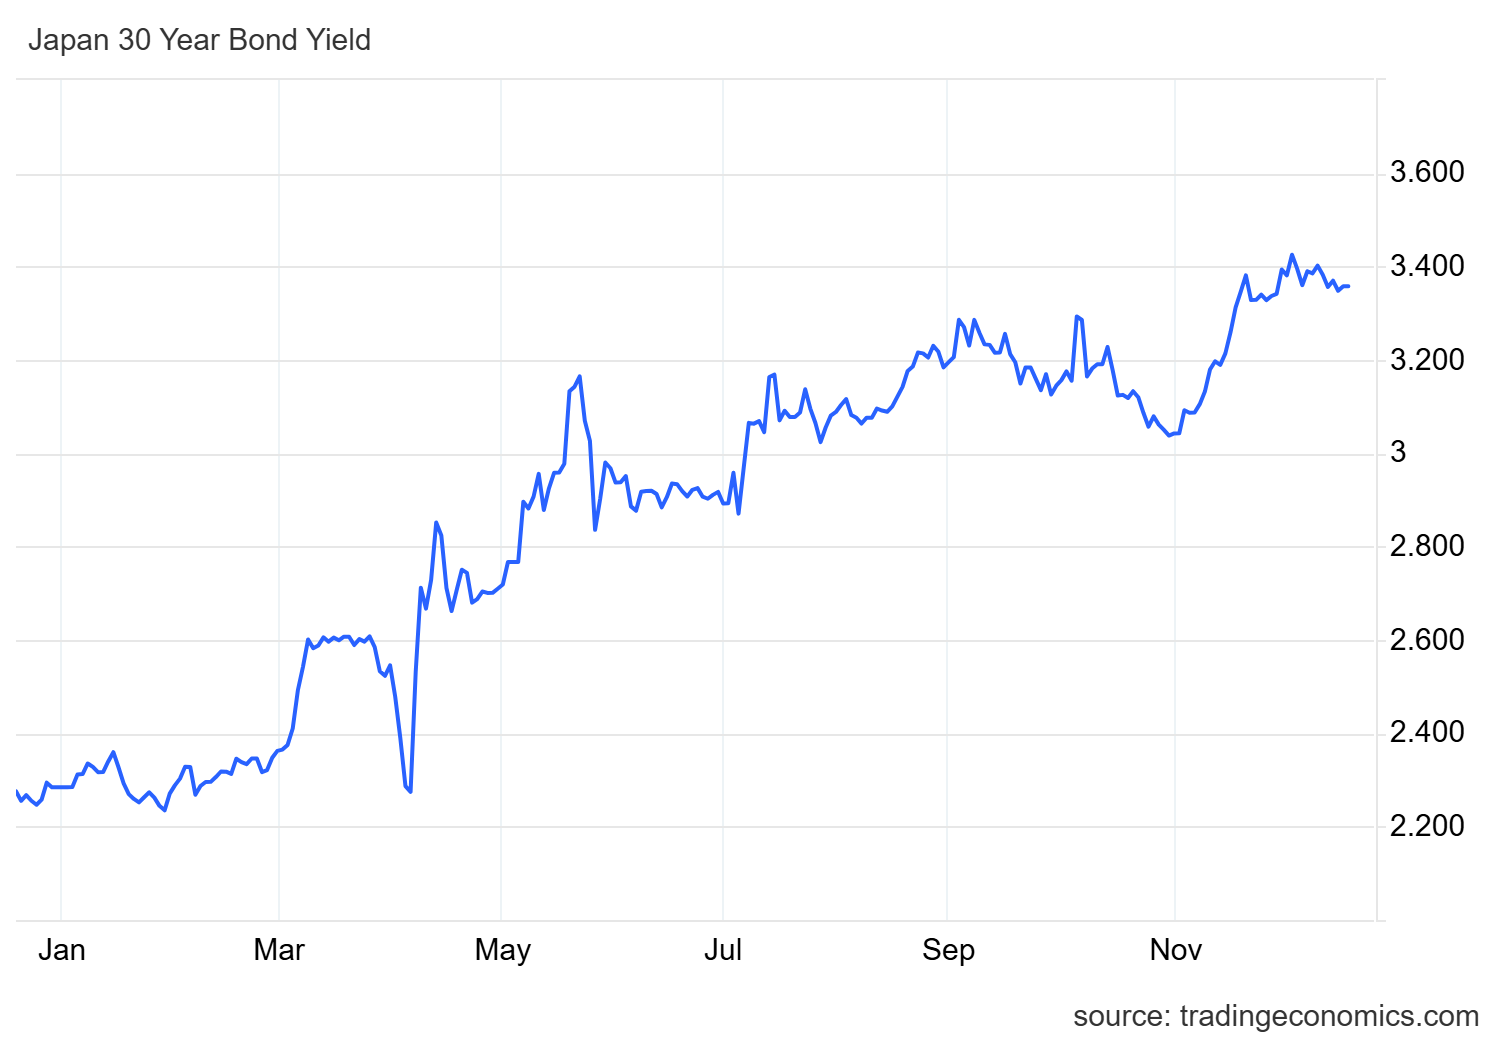
Bank of Japan to Hike Rates to Highest Level in Decades
The Bank of Japan is set to raise interest rates to their highest level in three decades this Friday, with Governor Kazuo Ueda expected to lift the benchmark rate from 0.5% to 0.75%.
While modest by global standards, this marks a landmark step in Japan's departure from decades of near-zero rates and unconventional easing.
The decision comes amid significant market turbulence. Japanese government bond yields have surged, with 30-year bonds hitting record highs and 10-year yields reaching 19-year peaks.
The volatility stems partly from concerns under new Prime Minister Sanae Takaichi, who recently approved a $118 billion stimulus package with over 60% financed through borrowing.
While Friday's hike appears certain, policymakers have signalled caution as they push rates toward levels estimated between 1% and 2.5%.
Ueda's post-meeting press conference will be closely watched for signals about future increases.
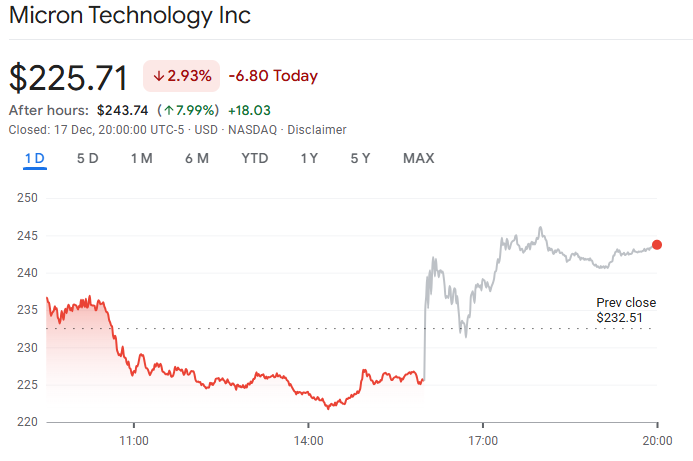
Micron Forecasts Blowout Earnings on Booming AI Market
Micron Technology is projecting second-quarter earnings of $8.42 per share, nearly double Wall Street's $4.78 estimate.
Micron shares surged 7% in after-hours trading as markets reacted to the news that the AI-driven memory chip race is showing no signs of slowing.
As one of only three major suppliers of high-bandwidth memory (HBM) chips alongside SK Hynix and Samsung, Micron sits at a chokepoint in AI infrastructure.
The HBM specialised chips are essential for training and deploying generative AI models, and current demand is dramatically outpacing supply.
CEO Sanjay Mehrotra revealed that supply tightness will extend beyond 2026, with Micron expecting to fulfil only 50-70% of key customer demand in the medium term.
Micron projects revenue of $18.70 billion this quarter versus analyst estimates of $14.20 billion. The company has retooled their operations toward AI applications, even dissolving its consumer "Crucial" brand to concentrate on AI data centre demand.
HBM chips are now the bottleneck in AI system performance, and suppliers who can deliver at scale have the potential to capture large amounts of value over the coming years.