Big global events like the Olympics can pull attention away from markets, shift participation, and thin out volume in pockets.
When that happens, liquidity can appear lighter, spreads can be less consistent, and short-term price action can become noisier, even if broader index-level volatility does not change materially.
So instead of asking “Do the Olympics create volatility?”, a more practical lens is to ask “What volatility events could show up during the Games?”
Quick facts
Evidence is generally weak that the Olympics themselves are a consistent, direct driver of market volatility.
Volatility spikes that occur during Olympic windows have often coincided with bigger forces already in motion, including macro stress, policy surprises, and geopolitics.
The more repeatable Olympics-linked impact tends to be around execution conditions, not a new fundamental market regime.
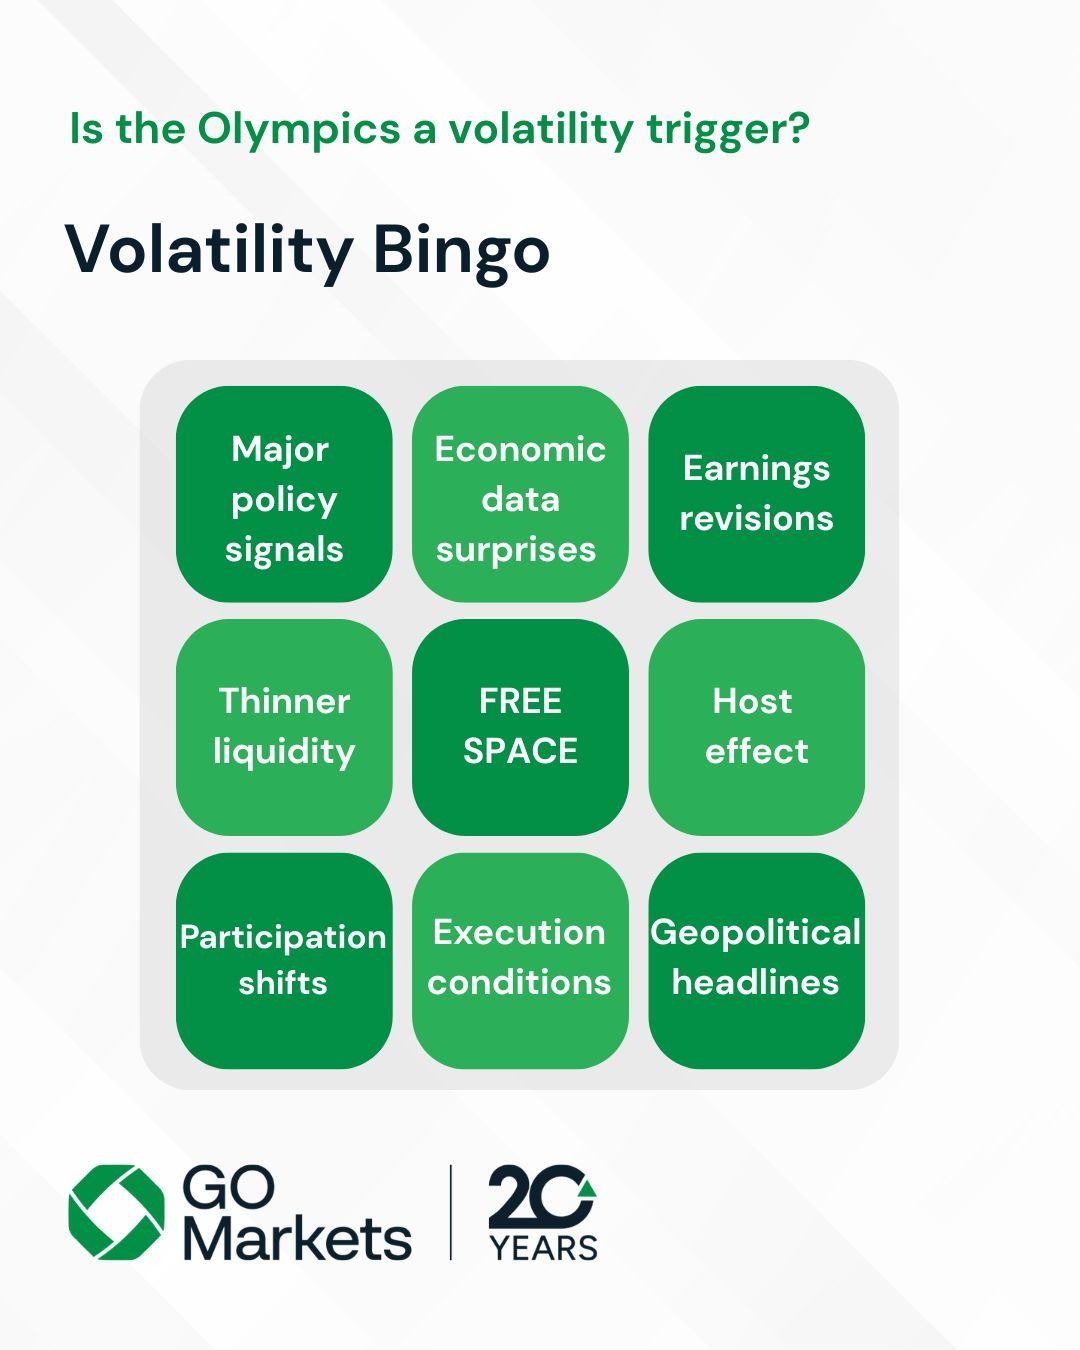
Olympic “volatility bingo”, how it works
Think of it as a checklist of common volatility triggers that can land while the world is watching.
Some “volatility bingo” squares are timeless, like central banks and geopolitics. Others are more modern, such as cyber disruption risk, climate activism, and social flashpoints surrounding host-city logistics.
When policy expectations shift, markets can move regardless of the calendar.
London 2012 is a reminder that the story was not sport. It was the Eurozone. In late July 2012, ECB President Mario Draghi delivered his “whatever it takes” remarks in London, at a time when sovereign stress was a dominant volatility theme.
Macro stress already underway
Beijing 2008 took place in a year defined by the global financial crisis, with volatility tied to credit stress and repricing risk appetite, not to the event itself. The Games ran from 8 August 2008 to 24 August 2008.
S&P500 dropped almost 50% over 6 months in 2008 | TradingView
Geopolitics and security
Regional conflict timing
During Beijing 2008, the Russia-Georgia conflict escalated in early August 2008, overlapping with the Olympic period. The market lesson is that geopolitical repricing does not pause for major broadcasts.
“After the closing ceremony” risk
Beijing 2022 ended on 20 February 2022. Russia’s full-scale invasion of Ukraine began on 24 February 2022, only days later.
This is a classic “bingo square” because it reinforces the same principle. A geopolitical escalation can land near a global event window without necessarily being caused by it.
Security incident headline shock
The Olympics have also been directly impacted by security events, even if those events are not “market drivers” on their own.
Two historic examples that shaped the broader security backdrop around major events are:
The Munich massacre during the 1972 Summer Games.
The 1996 Atlanta Olympics bombing in Centennial Olympic Park.
Security measures for Paris 2024 included AI-powered cameras | Adobe Stock
Modern host-city climate
Environmental and anti-Olympics protests
Host city activism is not new, but the themes have become more climate and infrastructure-focused.
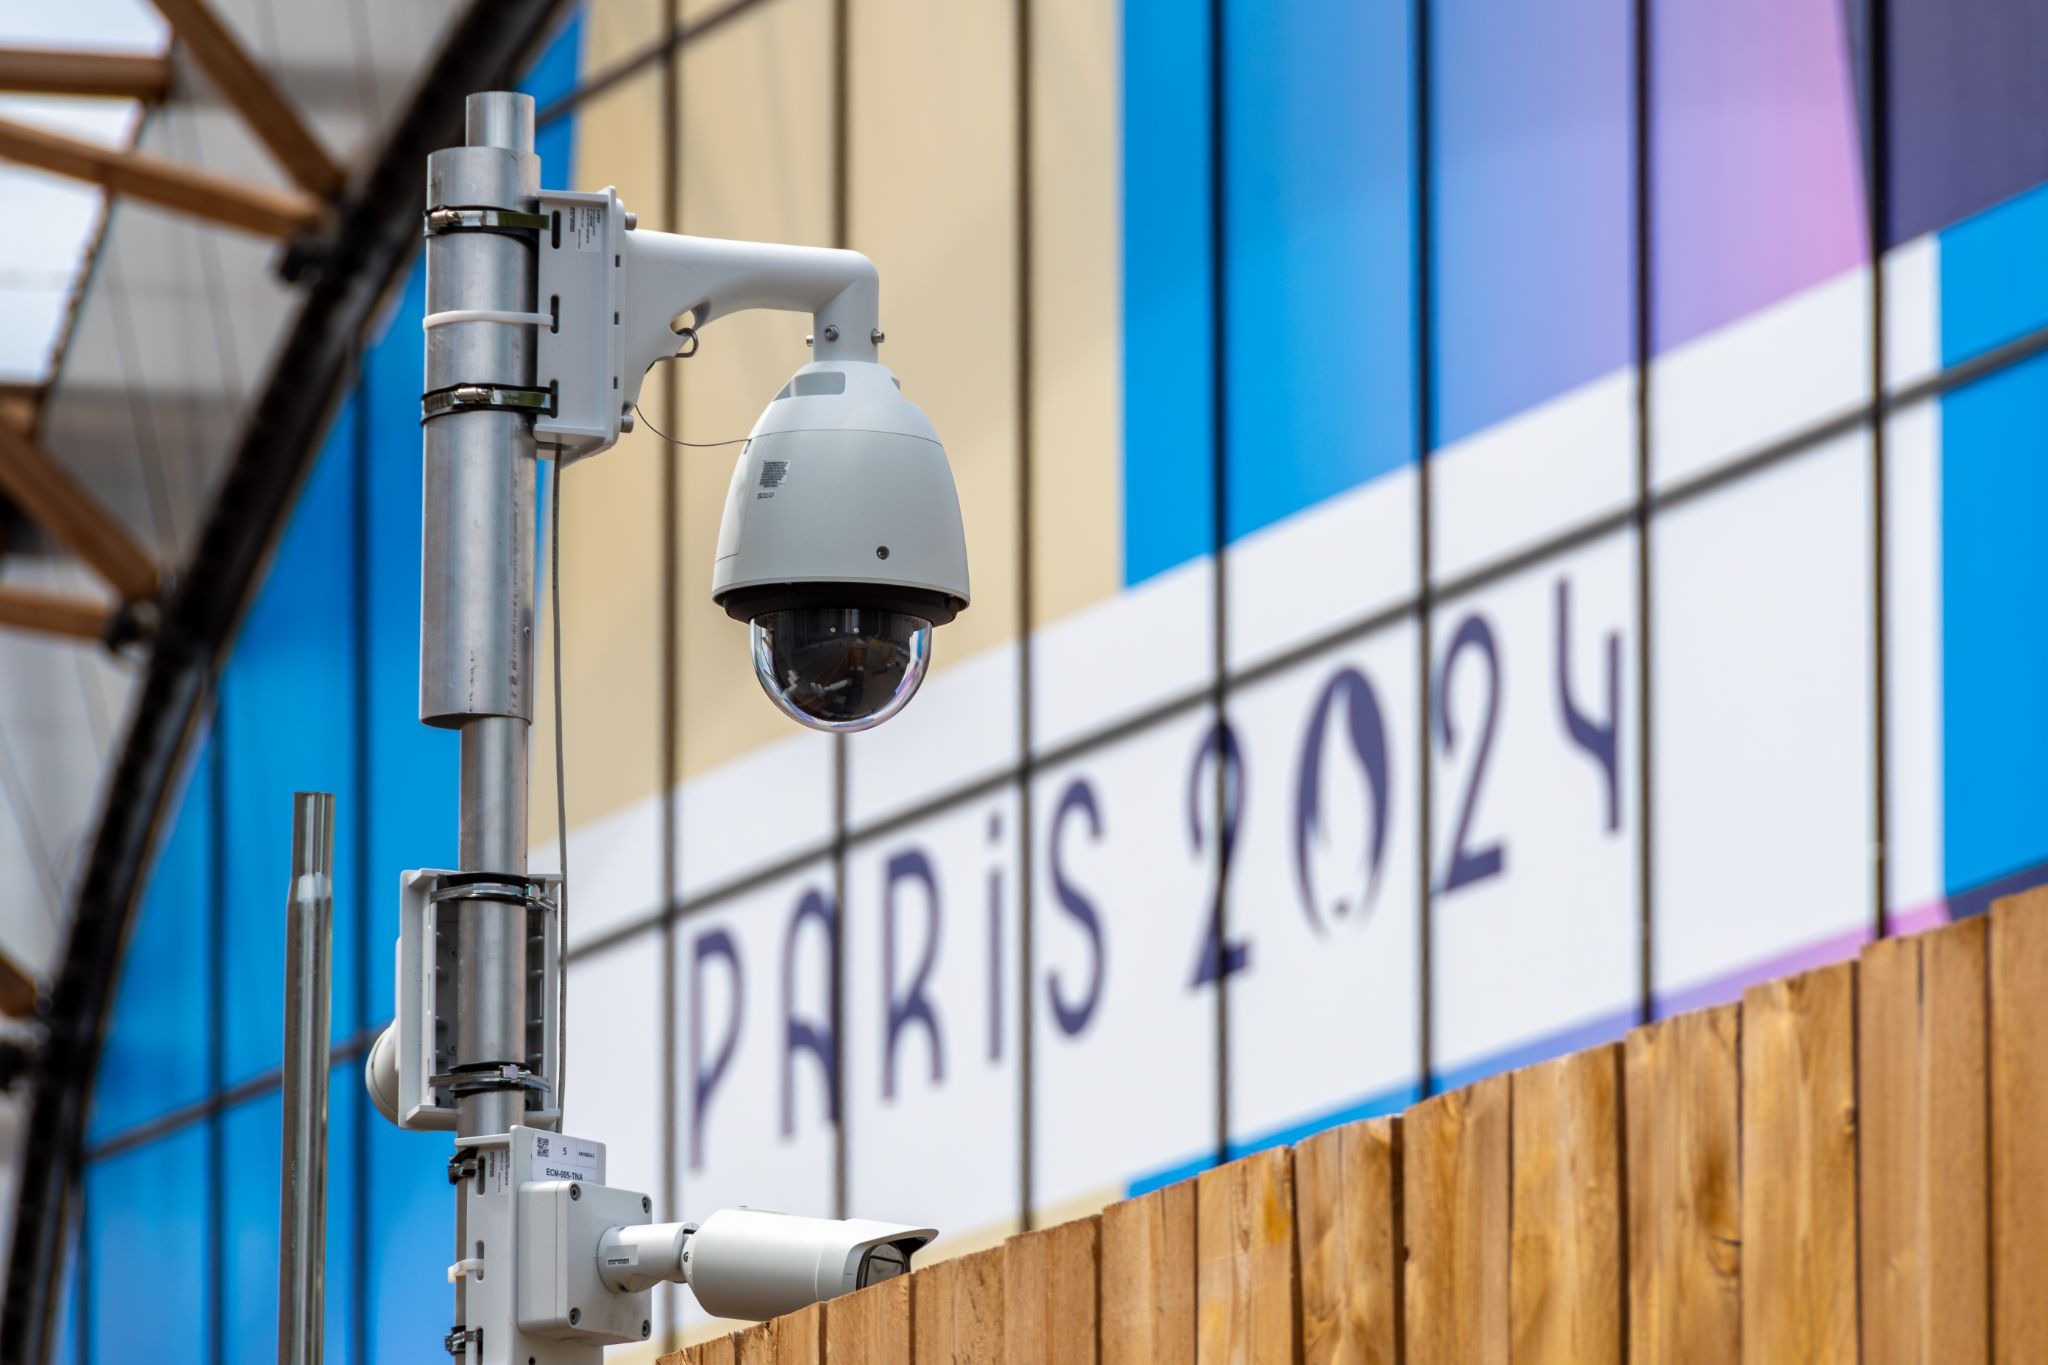
Paris 2024 saw organised protests and “counter-opening” events. Reporting around Paris also referenced environmental protest attempts by climate groups.
The current 2026 Winter Olympics opened amid anti-Olympics protests in Milan, with reporting that included alleged railway sabotage and demonstrations focused in part on the environmental impacts of Olympic infrastructure.
These types of headlines can matter for markets indirectly, through risk sentiment, transport disruption, policy response, and broader “instability” framing.
Cyber disruption risk
The cyber “bingo square” has become more prominent in modern Games.
France’s national cybersecurity agency ANSSI reported 548 cybersecurity events affecting Olympics-related entities that were reported to ANSSI between 8 May 2024 and 8 September 2024.
Even when events are contained, cyber incidents can still add noise to headlines and confidence.
Logistics and “can the event run” controversy
Sometimes the volatility link is not the Games, but the controversy around delivery.
Paris 2024 had high-profile scrutiny around the Seine and event readiness, alongside significant public spending to clean the river and ongoing debate about water quality risks.
Health and disruption narratives
Public health concerns
Rio 2016 is a reminder that health risk narratives can become part of the Olympic backdrop, even when the market impact is indirect.
Zika concerns were widely discussed ahead of the Games, including debate about global transmission risk and travel-related spread.
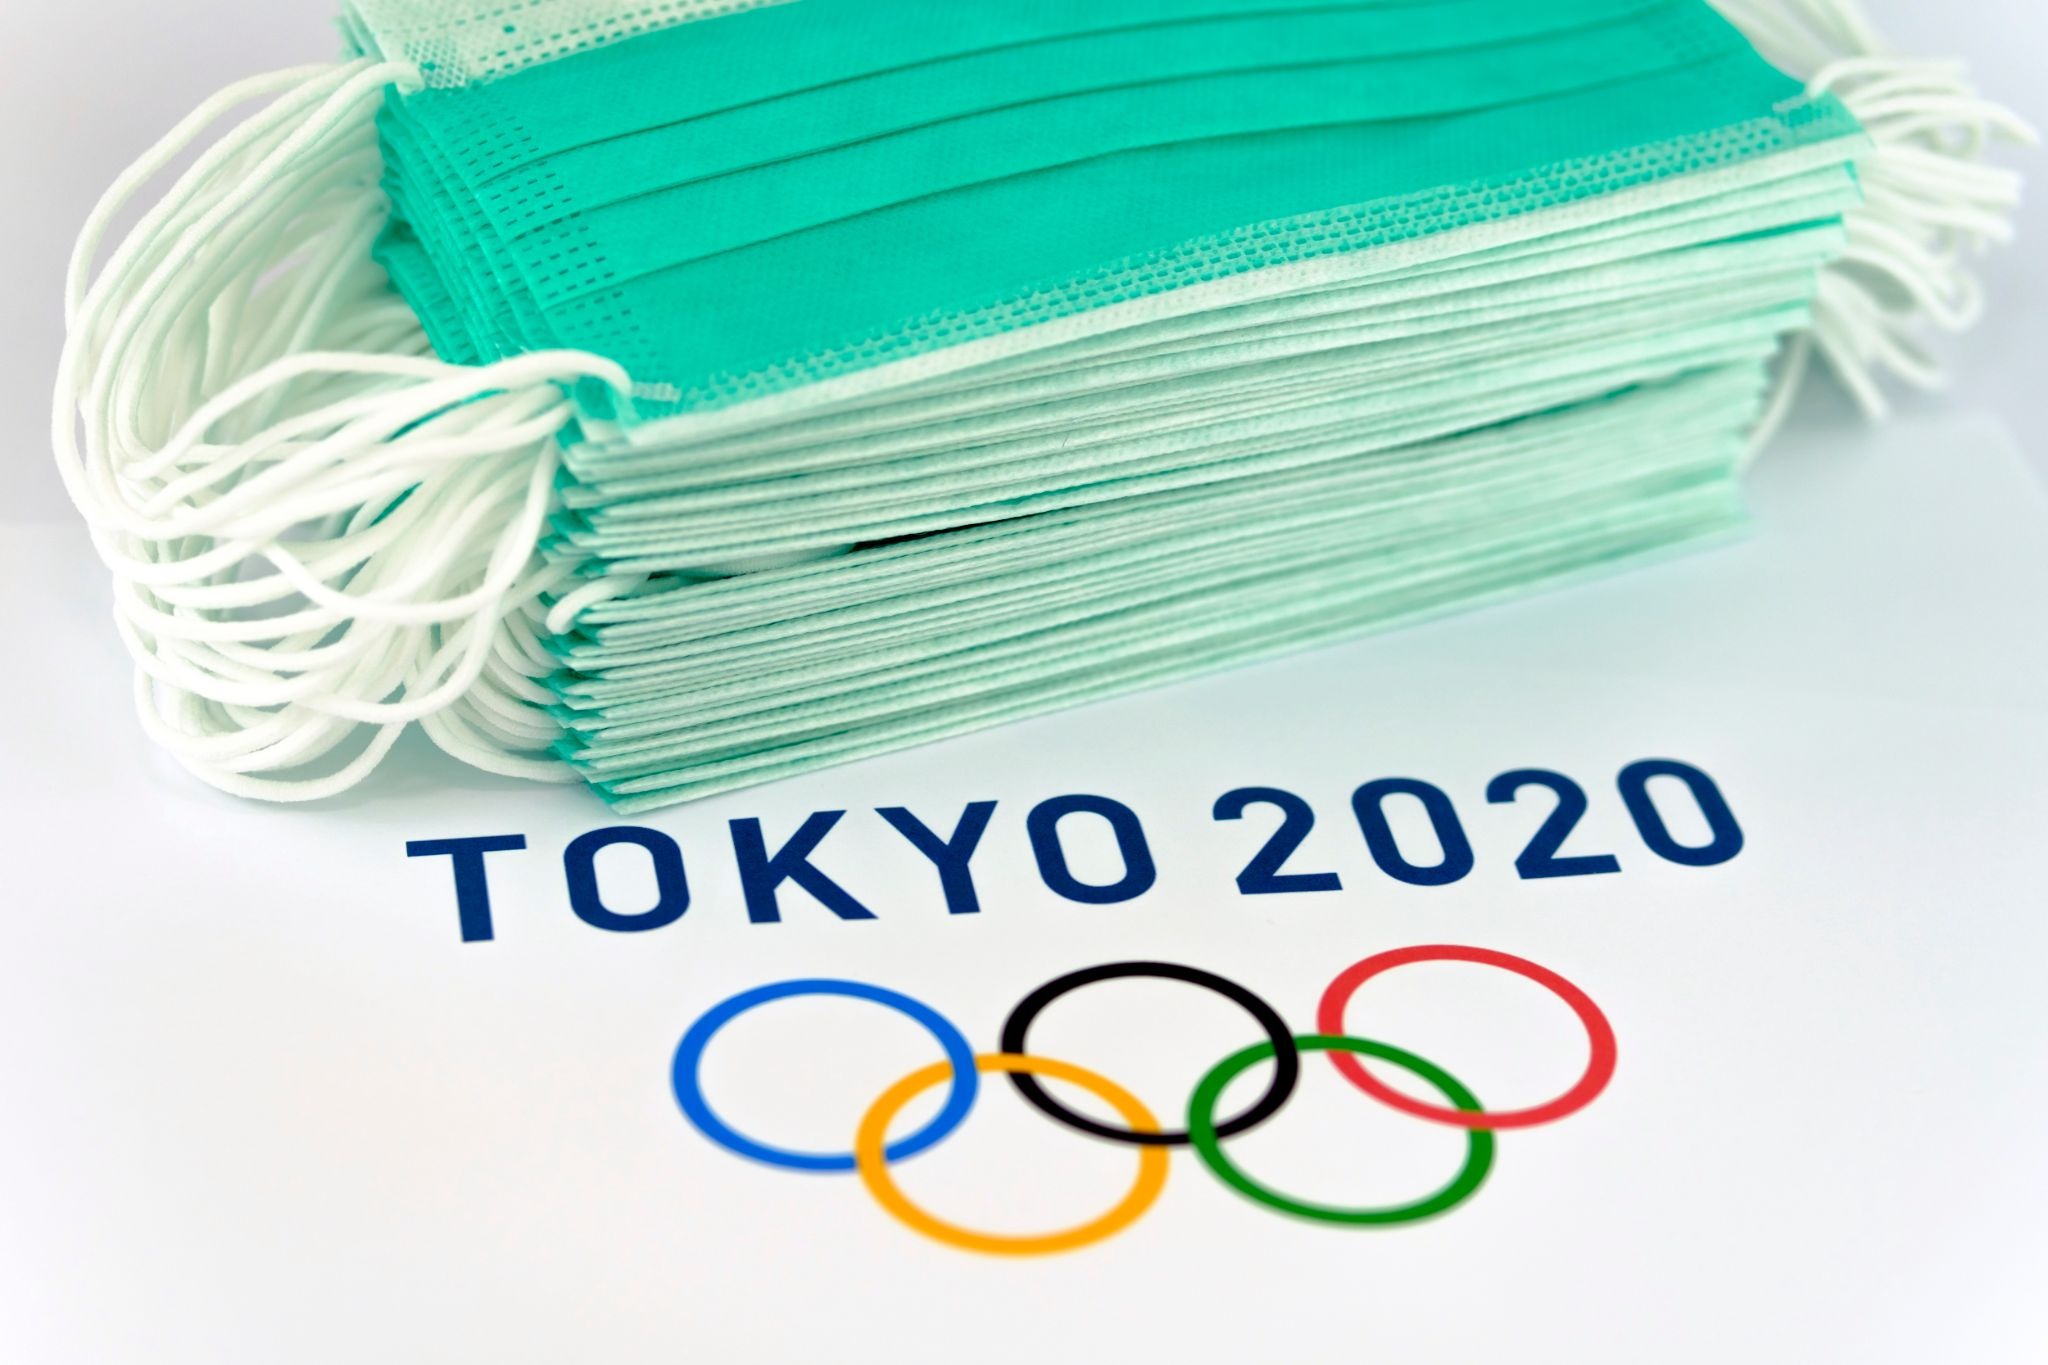
The “postponement era” memory
Tokyo 2020 was postponed to 2021 due to COVID-19, which underlined that global shock events can dominate everything else, including major sporting calendars.
Tokyo 2020 “COVID” Olympics | Adobe Stock
Practical takeaways for traders
The most repeatable Olympics-era shift is often not “more volatility”, but different execution conditions.
During major global events, some traders choose to watch spreads and depth for signs of thinning liquidity, trade less when conditions look choppy, and stay aware that geopolitical, cyber, and protest headlines can hit at any time.
In global markets of enormous scale, sport is usually not the catalyst. The bingo squares are.
By
Mike Smith
Mike Smith (MSc, PGdipEd)
Client Education and Training
Disclaimer: Articles are from GO Markets analysts and contributors and are based on their independent analysis or personal experiences. Views, opinions or trading styles expressed are their own, and should not be taken as either representative of or shared by GO Markets. Advice, if any, is of a ‘general’ nature and not based on your personal objectives, financial situation or needs. Consider how appropriate the advice, if any, is to your objectives, financial situation and needs, before acting on the advice. If the advice relates to acquiring a particular financial product, you should obtain our Disclosure Statement (DS) and other legal documents available on our website for that product before making any decisions.
If you've spent any time looking at a trading terminal, you've seen it. A news headline breaks, a chart line snaps, and suddenly everyone is rushing for the same exit or the same entrance. It looks like chaos. In practice, it is often a chain of mechanical responses.
This matters for a couple of reasons. Many readers assume the story is the trade. It is not. The story, whether it is an interest rate decision, a supply shock or an earnings miss, is the fuel and the playbook is the engine.
Below are seven core strategies often used in contracts for difference (CFDs) trading. With CFDs, you are not buying the underlying asset. You are speculating on the change in value. That means a trader can take a long position if the price rises, or a short position if it falls.
Seven strategies to understand first
1. Trend following (the establishment play)
Trend following works on the idea that a market already in motion can remain in motion until it meets a clear structural obstacle. Some market participants view it as a chart-based approach because it focuses on the prevailing direction rather than trying to call an exact turning point.
The rationale: The aim is to identify a clear directional bias, such as higher highs and higher lows, and follow that momentum rather than position against it.
What traders look for: Exponential moving averages (EMAs), such as the 50-day or 200-day EMA, are commonly used to interpret trend strength, though indicators can produce false signals and are not reliable on their own.
Source: GO Markets | Educational example only.
How it works: The 50-period EMA can act as a dynamic support level that rises as price rises. In an uptrend, some traders watch for the market to make a new higher high (HH), then pull back towards the EMA before moving higher again. Each higher low (HL) may suggest buyers are still in control.
When price touches or comes close to the 50-period EMA during that pullback, some traders treat that area as a potential decision zone rather than assuming the trend will resume automatically.
What to watch: The sequence of HHs and HLs is part of the structural evidence of a trend. If that sequence breaks, for example if price falls below the previous HL, the trend may be weakening and the setup may no longer hold.
2. Range trading (the ping-pong play)
Markets can spend long stretches moving sideways. That creates a range, where buyers and sellers are in temporary balance. Range trading is built around this behaviour, focusing on moves near the bottom and top of an established range.
The rationale: Price moves between a floor, known as support, and a ceiling, known as resistance. Moves near those boundaries can help define the width of the range.
What traders look for: Some traders use oscillators such as the Relative Strength Index (RSI) to help judge whether the asset looks overbought or oversold near each boundary.
Source: GO Markets | Educational example only.
How it works: The support level is a price zone where buying interest has historically been strong enough to stop the market from falling further. The resistance level is where selling pressure has historically prevented further gains.
When price approaches support, some traders look for signs of a potential rebound. When it approaches resistance, they look for signs that momentum may be fading. RSI readings below 35 can suggest the market is oversold near support, while readings above 65 can suggest it is overbought near resistance.
What to watch: The main risk in range trading is a breakout, when price pushes decisively through either level with strong momentum. This may signal the start of a new trend and using a stop-loss just outside the range on each trade may help manage that risk.
3. Breakouts (the coiled spring play)
Eventually, every range comes under pressure. A breakout happens when the balance shifts and price pushes through support or resistance. Markets alternate between periods of low volatility, where price moves sideways in a tight range, and high-volatility bursts where price can make a larger directional move.
The rationale: Quiet consolidation can sometimes be followed by a broader expansion in volatility. The tighter the compression, the more energy may be stored for the next move.
What traders look for: Bollinger Bands are often used to interpret changes in volatility. When the bands tighten, a squeeze is forming. Some market participants view a move outside the bands as a sign that conditions may be changing.
Source: GO Markets | Educational example only.
How it works: Bollinger Bands consist of a middle line, the 20-period moving average, and 2 outer bands that expand or contract based on recent price volatility. When the bands narrow and come close together, the squeeze, the market has been unusually calm.
This is often described as a coiled spring. Energy may be building, and a sharper move can follow. Some traders treat the first move through an outer band as an early clue on direction, rather than a definitive signal on its own.
What to watch: Not every squeeze leads to a powerful breakout. A false breakout occurs when price briefly moves outside a band, then quickly reverses back inside. Waiting for the candle to close outside the band, rather than entering mid-candle, can reduce the risk of being caught in a false move.
4. News trading (the deviation play)
This is event-driven trading. The focus is on the gap between what the market expected and what the data or headline actually delivered. Economic data releases, such as inflation figures (CPI), employment reports and central bank decisions, can cause sharp, fast moves in financial markets.
The rationale: High-impact releases, such as inflation data or central bank decisions, can force a fast repricing of assets. The bigger the surprise relative to expectations, the larger the move may be.
What traders look for: Traders often use an economic calendar to track timing. Some focus on how the market behaves after the initial reaction, rather than treating the first move as definitive.
Source: GO Markets | Educational example only.
How it works: Before the news, price may move in a calm, tight range as traders wait. When the data is released, if the actual reading differs significantly from the consensus expectation, repricing can happen fast.
Gold, for example, may spike sharply on a CPI reading that comes in above expectations. However, the candle can also print a very long upper wick, meaning price reached the spike high but was then rejected strongly. Sellers may step in quickly, and price may retrace. This spike-and-retrace pattern is one of the more recognisable setups in news trading.
What to watch: The direction and size of the initial spike do not always tell the full story. Wick length can offer an important clue. A long wick may suggest the initial move was rejected, while shorter wicks after a data release may indicate a more sustained directional move.
5. Mean reversion (the rubber-band play)
Prices can sometimes move too far, too fast. Mean reversion is built on the idea that an overextended move may drift back towards its historical average, like a rubber band pulled too tight, then snapping back.
The rationale: This is a contrarian approach. It looks for stretches of optimism or pessimism that may not be sustainable, and positions for a return to equilibrium.
What traders look for: A common example is price moving well away from a 20-day moving average (MA) while RSI also reaches an extreme reading. In that setup, traders watch for a move back towards the mean rather than a continuation away from it.
Source: GO Markets | Educational example only.
How it works: The 20-period MA represents the market's recent average price. When price moves into an extreme zone, such as more than 3 standard deviations above or below that average, it has moved a long way from its recent trend.
An RSI above 70 can suggest the market is stretched to the upside, while below 30 can suggest the same to the downside. Some mean reversion traders use these combined signals as a sign that a pullback towards the 20-period MA may be possible, rather than assuming the move will continue to extend.
What to watch: Mean reversion strategies can carry significant risk in strongly trending markets. A market can remain extended for longer than expected, and a position entered against the short-term trend can generate large drawdowns. Position sizing and clear stop-losses are critical.
6. Psychological levels (the big figure play)
Markets are driven by people, and people tend to focus on round numbers. US$100, US$2,000 or parity at 1.000 on a currency pair can act as magnets. In financial markets, certain price levels can attract a disproportionate amount of buying and selling activity, not because of technical analysis alone, but because of human psychology.
The rationale: Large orders, stop-losses and take-profit levels can cluster around these big figures, which may reinforce support or resistance. This self-reinforcing behaviour is one reason these rejections can become meaningful for traders.
What traders look for: Traders often watch how price behaves as it approaches a round number. The market may hesitate, reject the level or break through it with momentum. Multiple wick rejections at the same level may carry more weight than a single one.
Source: GO Markets | Educational example only.
How it works: When price approaches a round number from below, some traders watch for long upper wicks, the thin vertical line above the candle body. A long upper wick means price reached that level, but sellers stepped in aggressively and pushed it back down before the candle closed.
One wick rejection may be notable. Three in a cluster may be more significant. Some traders use this accumulated rejection as part of the case for a short (sell) setup at that level.
What to watch: Psychological levels can also act as magnets in the opposite direction. If price breaks through with conviction, the level may then act as support. A decisive close above the level, rather than just a wick break, can be an early sign that the rejection setup is no longer holding.
7. Sector rotation (the economic season play)
This is a macro strategy. As the economic backdrop changes, capital may move from higher-growth sectors into more defensive ones, and back again. Not all parts of the sharemarket move in the same direction at the same time.
The rationale: In a slowing economy, discretionary spending may weaken while demand for essential services can remain more stable. Investors may rotate capital between sectors accordingly.
What traders look for: With CFDs, some traders express this view through relative strength, taking exposure to a stronger sector while reducing or offsetting exposure to a weaker one.
Source: GO Markets | Educational example only.
How it works: During a growth phase, when the economy is expanding, investors tend to prefer growth-oriented sectors like technology. As the economic environment shifts, perhaps due to rising interest rates, slowing earnings or increasing recession risk, a rotation point may emerge.
In the slowdown phase, the pattern can reverse. Technology may weaken while utilities may strengthen, as investors move capital into defensive, income-generating sectors. Early signals can include relative underperformance in growth sectors combined with unusual strength in defensives.
What to watch: Sector rotation is not usually an overnight event. It typically unfolds over weeks to months. Tracking the ratio between two sectors, often shown in a relative strength chart, can make this shift visible before it becomes obvious in absolute price terms.
Why risk management is the engine of survival
The headline move is one thing. The market implication for your account is another. If you do not manage the mechanics, the strategy does not matter.
Because CFDs are traded on margin, a small market move may have an outsized impact on the account. If leverage is too high, even a minor wobble may trigger a margin call or automatic position closure, depending on the provider's terms. This is not a theoretical risk. It is a common reason new traders lose more than they expected on a trade that was directionally correct.
The market does not always move in a straight line. Sometimes, price gaps from one level to another, especially after a weekend or major news event and in those conditions, a stop-loss may not be filled at the exact requested price. That is known as slippage. It is one reason large positions may carry additional risk into major announcements.
Bottom line
The vehicle is powerful, but the playbook is what helps keep you on the road.
The obvious trade is often already priced in. What matters more is understanding which market condition is in front of you. Is it trending, ranging, breaking out or simply reacting to a headline?
Readers assessing leveraged products often focus on position sizing, risk limits and product disclosure before deciding whether the product is appropriate for them. The headlines will keep changing. The maths of risk management does not.
Disclaimer: This article is general information only and is intended for educational purposes. It explains common trading concepts and market behaviours and does not constitute financial product advice, a recommendation, or a trading signal. Any examples are illustrative only and do not take into account your objectives, financial situation or needs. CFDs are complex, leveraged products that carry a high level of risk. Before acting, consider the PDS and TMD and whether trading CFDs is appropriate for you. Seek independent advice if needed. Past performance is not a reliable indicator of future results.
If you have been following the tech story for the last decade, you have been trained to look at a very specific, very small patch of real estate in Northern California. But as we sit here in early 2026, the "connect-the-dots" moment for investors is this: the AI trade has stopped being about shiny software demos in Palo Alto and has started being about the physical industrialisation of compute.
We have entered the "Year of Proof". The world’s largest companies, the hyperscalers, are projected to spend a staggering US$650 billion on capital expenditures this year. But here’s the part most people miss: that money is not staying in Silicon Valley. It’s flowing to the "picks and shovels" players in Idaho, Washington, Colorado and even overseas.
If you want to understand where the actual return on investment (ROI) may be landing this earnings season, you have to look outside the 650 area code. The shift from AI hype to AI industrialisation is changing the map.
The full AI stack: from capex to consulting — GO Markets
Five companies · AI infrastructure play · 2026
The full AI stack: from capex to consulting
Infrastructure builders compared to the implementation bridge across the AI value chain
Note: Hyperscalers shown as 2026 CapEx spend. Accenture shown as cumulative advanced AI bookings ($11.5B through Q1 FY2026), reflecting its role as the adoption layer rather than the infrastructure layer.
Infrastructure (2026 CapEx projected)Implementation bridge (cumulative AI bookings)
Hyperscaler CapEx: Early 2026 analyst estimates, midpoint of ranges. Amazon approx. 100% YoY, Alphabet approx. 100%, Meta approx. 87%, Microsoft approx. 50%.
Accenture: Cumulative advanced AI bookings $11.5B through Q1 FY2026. Q1 AI bookings $2.2B (up 76% YoY), AI revenue $1.1B (up 120% YoY) across 1,300+ clients.
Five companies shaping the next phase of AI
Micron Technology (MU), Boise, Idaho
Micron is the "memory backbone" of the current cycle. While everyone was watching the chip designers, many overlooked the fact that AI chips are far less useful without high-bandwidth memory (HBM). Micron is currently viewed by some analysts as a strong buy because its capacity is reportedly sold out through the end of 2026. Analysts are also eyeing a 457% jump in earnings per share (EPS) as the memory cycle reaches what some describe as a robust peak.
Microsoft (MSFT), Redmond, Washington
Microsoft is the enterprise backbone of this transition. It has moved beyond simple chatbots and is now building what analysts call "Intelligence Factories". While the stock has faced pressure recently over capacity constraints, underlying demand for Azure AI is reportedly still running ahead of capacity. The broader bull case is that Microsoft is moving into "Agentic AI", systems that do not just talk to users but may also execute multi-step business workflows.
Amazon is playing a long-term game of vertical integration. To reduce its reliance on expensive third-party hardware, it’s building its own AI chips in-house. Amazon Web Services (AWS) remains the primary driver of profitability, and the company is using its retail data to train specialised models that many Silicon Valley start-ups may struggle to replicate.
Palantir Technologies (PLTR), Denver, Colorado
If Micron provides the memory and Microsoft the platform, Palantir provides the "operating system" for the modern AI factory. The company has posted strong momentum, with US commercial sales recently growing 93% year over year. It’s often framed as a bridge between raw data and corporate profitability, which remains a key focus for investors in 2026.
Accenture (ACN), Dublin, Ireland
You cannot just "plug in" AI. Businesses often need to redesign processes around it, and that’s where Accenture comes in.
The company is viewed as an implementation bridge, with one analyst arguing that "GenAI needs Accenture" to move from pilot programs to production though the cautionary angle is that the AI story has not fully excited investors here yet because consulting revenue can take longer to show up than chip sales.
What could happen next?
The chart maps the three time horizons likely to shape the next phase of the AI industrialisation trade.
In the near term, markets are still reacting to chipmaker earnings, guidance, and any signs of capacity strain. Over the next month, attention shifts to the real-world inputs behind AI growth, especially power, financing, and infrastructure. By the 60-day window, the key question is whether AI spending is broadening into a wider market re-rating or running ahead of near-term returns.
Across all three periods, the focus is the same: proof. Investors are looking for signs that AI capital expenditure is translating into real demand for energy, land, and industrial capacity. That is why updates from companies tied to power and data centre buildout matter more than ever.
What could happen next — GO Markets
Scenario planning · March 2026
What could happen next
Three time horizons, three scenarios to watch across the AI industrialisation cycle
Next 2 weeks
Chipmaker reports
Possible
Market volatility continues as traders digest the latest reports from chipmakers like Micron
Upside scenario
"Bulletproof" guidance from remaining infrastructure names triggers a sector-wide relief rally
Watch for
Any mention of "capacity constraints" or "supply bottlenecks" in earnings calls
Next 30 days
Energy and rates
Possible
Focus shifts to "real economy" energy players like NextEra that power the data centres
Downside scenario
Rising oil prices from Middle East conflict act as a tax on tech margins, rotating into defensives
Action point
Monitor Fed language on rates. Higher for longer makes $650B capex bills far more expensive to finance
Next 60 days
The great dispersion
Possible
Market rewards companies with real AI revenue and punishes those still stuck in experimentation
Upside scenario
NextEra Energy (NEE) data centre announcements in late April/May trigger a utility renaissance rally
Downside scenario
An "air pocket" in profits occurs where debt-funded investment outpaces revenue gains
Watch
May reports from Texas Pacific Land (TPL) — is data centre land demand still "red hot"?
Action point
Review your portfolio for geographic diversity. The AI story is now a global power race
The psychological trap
The emotional trap many traders fall into right now is recency bias. You have seen NVIDIA and the "Magnificent 7" win for so long that it feels like they are the only way to play this. But the "obvious" trade is often the one that has already been priced in. Before acting, ask yourself: "Am I buying this stock because I understand its role in the physical AI supply chain, or because I’m afraid of missing the next leg of a rally that started two years ago?"
Disclaimer: This content is general information only and should not be relied on as personal financial advice or a recommendation to buy, sell, or hold any financial product. References to companies or themes, including AI-related stocks, are illustrative only. Share and derivative markets can move sharply, and concentrated sectors such as AI and technology may experience elevated volatility, valuation risk, and liquidity risk. If you trade derivatives such as CFDs, leverage can magnify both gains and losses. Past performance is not a reliable indicator of future performance.
If you've spent any time looking at a trading terminal, you've seen it. A news headline breaks, a chart line snaps, and suddenly everyone is rushing for the same exit or the same entrance. It looks like chaos. In practice, it is often a chain of mechanical responses.
This matters for a couple of reasons. Many readers assume the story is the trade. It is not. The story, whether it is an interest rate decision, a supply shock or an earnings miss, is the fuel and the playbook is the engine.
Below are seven core strategies often used in contracts for difference (CFDs) trading. With CFDs, you are not buying the underlying asset. You are speculating on the change in value. That means a trader can take a long position if the price rises, or a short position if it falls.
Seven strategies to understand first
1. Trend following (the establishment play)
Trend following works on the idea that a market already in motion can remain in motion until it meets a clear structural obstacle. Some market participants view it as a chart-based approach because it focuses on the prevailing direction rather than trying to call an exact turning point.
The rationale: The aim is to identify a clear directional bias, such as higher highs and higher lows, and follow that momentum rather than position against it.
What traders look for: Exponential moving averages (EMAs), such as the 50-day or 200-day EMA, are commonly used to interpret trend strength, though indicators can produce false signals and are not reliable on their own.
Source: GO Markets | Educational example only.
How it works: The 50-period EMA can act as a dynamic support level that rises as price rises. In an uptrend, some traders watch for the market to make a new higher high (HH), then pull back towards the EMA before moving higher again. Each higher low (HL) may suggest buyers are still in control.
When price touches or comes close to the 50-period EMA during that pullback, some traders treat that area as a potential decision zone rather than assuming the trend will resume automatically.
What to watch: The sequence of HHs and HLs is part of the structural evidence of a trend. If that sequence breaks, for example if price falls below the previous HL, the trend may be weakening and the setup may no longer hold.
2. Range trading (the ping-pong play)
Markets can spend long stretches moving sideways. That creates a range, where buyers and sellers are in temporary balance. Range trading is built around this behaviour, focusing on moves near the bottom and top of an established range.
The rationale: Price moves between a floor, known as support, and a ceiling, known as resistance. Moves near those boundaries can help define the width of the range.
What traders look for: Some traders use oscillators such as the Relative Strength Index (RSI) to help judge whether the asset looks overbought or oversold near each boundary.
Source: GO Markets | Educational example only.
How it works: The support level is a price zone where buying interest has historically been strong enough to stop the market from falling further. The resistance level is where selling pressure has historically prevented further gains.
When price approaches support, some traders look for signs of a potential rebound. When it approaches resistance, they look for signs that momentum may be fading. RSI readings below 35 can suggest the market is oversold near support, while readings above 65 can suggest it is overbought near resistance.
What to watch: The main risk in range trading is a breakout, when price pushes decisively through either level with strong momentum. This may signal the start of a new trend and using a stop-loss just outside the range on each trade may help manage that risk.
3. Breakouts (the coiled spring play)
Eventually, every range comes under pressure. A breakout happens when the balance shifts and price pushes through support or resistance. Markets alternate between periods of low volatility, where price moves sideways in a tight range, and high-volatility bursts where price can make a larger directional move.
The rationale: Quiet consolidation can sometimes be followed by a broader expansion in volatility. The tighter the compression, the more energy may be stored for the next move.
What traders look for: Bollinger Bands are often used to interpret changes in volatility. When the bands tighten, a squeeze is forming. Some market participants view a move outside the bands as a sign that conditions may be changing.
Source: GO Markets | Educational example only.
How it works: Bollinger Bands consist of a middle line, the 20-period moving average, and 2 outer bands that expand or contract based on recent price volatility. When the bands narrow and come close together, the squeeze, the market has been unusually calm.
This is often described as a coiled spring. Energy may be building, and a sharper move can follow. Some traders treat the first move through an outer band as an early clue on direction, rather than a definitive signal on its own.
What to watch: Not every squeeze leads to a powerful breakout. A false breakout occurs when price briefly moves outside a band, then quickly reverses back inside. Waiting for the candle to close outside the band, rather than entering mid-candle, can reduce the risk of being caught in a false move.
4. News trading (the deviation play)
This is event-driven trading. The focus is on the gap between what the market expected and what the data or headline actually delivered. Economic data releases, such as inflation figures (CPI), employment reports and central bank decisions, can cause sharp, fast moves in financial markets.
The rationale: High-impact releases, such as inflation data or central bank decisions, can force a fast repricing of assets. The bigger the surprise relative to expectations, the larger the move may be.
What traders look for: Traders often use an economic calendar to track timing. Some focus on how the market behaves after the initial reaction, rather than treating the first move as definitive.
Source: GO Markets | Educational example only.
How it works: Before the news, price may move in a calm, tight range as traders wait. When the data is released, if the actual reading differs significantly from the consensus expectation, repricing can happen fast.
Gold, for example, may spike sharply on a CPI reading that comes in above expectations. However, the candle can also print a very long upper wick, meaning price reached the spike high but was then rejected strongly. Sellers may step in quickly, and price may retrace. This spike-and-retrace pattern is one of the more recognisable setups in news trading.
What to watch: The direction and size of the initial spike do not always tell the full story. Wick length can offer an important clue. A long wick may suggest the initial move was rejected, while shorter wicks after a data release may indicate a more sustained directional move.
5. Mean reversion (the rubber-band play)
Prices can sometimes move too far, too fast. Mean reversion is built on the idea that an overextended move may drift back towards its historical average, like a rubber band pulled too tight, then snapping back.
The rationale: This is a contrarian approach. It looks for stretches of optimism or pessimism that may not be sustainable, and positions for a return to equilibrium.
What traders look for: A common example is price moving well away from a 20-day moving average (MA) while RSI also reaches an extreme reading. In that setup, traders watch for a move back towards the mean rather than a continuation away from it.
Source: GO Markets | Educational example only.
How it works: The 20-period MA represents the market's recent average price. When price moves into an extreme zone, such as more than 3 standard deviations above or below that average, it has moved a long way from its recent trend.
An RSI above 70 can suggest the market is stretched to the upside, while below 30 can suggest the same to the downside. Some mean reversion traders use these combined signals as a sign that a pullback towards the 20-period MA may be possible, rather than assuming the move will continue to extend.
What to watch: Mean reversion strategies can carry significant risk in strongly trending markets. A market can remain extended for longer than expected, and a position entered against the short-term trend can generate large drawdowns. Position sizing and clear stop-losses are critical.
6. Psychological levels (the big figure play)
Markets are driven by people, and people tend to focus on round numbers. US$100, US$2,000 or parity at 1.000 on a currency pair can act as magnets. In financial markets, certain price levels can attract a disproportionate amount of buying and selling activity, not because of technical analysis alone, but because of human psychology.
The rationale: Large orders, stop-losses and take-profit levels can cluster around these big figures, which may reinforce support or resistance. This self-reinforcing behaviour is one reason these rejections can become meaningful for traders.
What traders look for: Traders often watch how price behaves as it approaches a round number. The market may hesitate, reject the level or break through it with momentum. Multiple wick rejections at the same level may carry more weight than a single one.
Source: GO Markets | Educational example only.
How it works: When price approaches a round number from below, some traders watch for long upper wicks, the thin vertical line above the candle body. A long upper wick means price reached that level, but sellers stepped in aggressively and pushed it back down before the candle closed.
One wick rejection may be notable. Three in a cluster may be more significant. Some traders use this accumulated rejection as part of the case for a short (sell) setup at that level.
What to watch: Psychological levels can also act as magnets in the opposite direction. If price breaks through with conviction, the level may then act as support. A decisive close above the level, rather than just a wick break, can be an early sign that the rejection setup is no longer holding.
7. Sector rotation (the economic season play)
This is a macro strategy. As the economic backdrop changes, capital may move from higher-growth sectors into more defensive ones, and back again. Not all parts of the sharemarket move in the same direction at the same time.
The rationale: In a slowing economy, discretionary spending may weaken while demand for essential services can remain more stable. Investors may rotate capital between sectors accordingly.
What traders look for: With CFDs, some traders express this view through relative strength, taking exposure to a stronger sector while reducing or offsetting exposure to a weaker one.
Source: GO Markets | Educational example only.
How it works: During a growth phase, when the economy is expanding, investors tend to prefer growth-oriented sectors like technology. As the economic environment shifts, perhaps due to rising interest rates, slowing earnings or increasing recession risk, a rotation point may emerge.
In the slowdown phase, the pattern can reverse. Technology may weaken while utilities may strengthen, as investors move capital into defensive, income-generating sectors. Early signals can include relative underperformance in growth sectors combined with unusual strength in defensives.
What to watch: Sector rotation is not usually an overnight event. It typically unfolds over weeks to months. Tracking the ratio between two sectors, often shown in a relative strength chart, can make this shift visible before it becomes obvious in absolute price terms.
Why risk management is the engine of survival
The headline move is one thing. The market implication for your account is another. If you do not manage the mechanics, the strategy does not matter.
Because CFDs are traded on margin, a small market move may have an outsized impact on the account. If leverage is too high, even a minor wobble may trigger a margin call or automatic position closure, depending on the provider's terms. This is not a theoretical risk. It is a common reason new traders lose more than they expected on a trade that was directionally correct.
The market does not always move in a straight line. Sometimes, price gaps from one level to another, especially after a weekend or major news event and in those conditions, a stop-loss may not be filled at the exact requested price. That is known as slippage. It is one reason large positions may carry additional risk into major announcements.
Bottom line
The vehicle is powerful, but the playbook is what helps keep you on the road.
The obvious trade is often already priced in. What matters more is understanding which market condition is in front of you. Is it trending, ranging, breaking out or simply reacting to a headline?
Readers assessing leveraged products often focus on position sizing, risk limits and product disclosure before deciding whether the product is appropriate for them. The headlines will keep changing. The maths of risk management does not.
Disclaimer: This article is general information only and is intended for educational purposes. It explains common trading concepts and market behaviours and does not constitute financial product advice, a recommendation, or a trading signal. Any examples are illustrative only and do not take into account your objectives, financial situation or needs. CFDs are complex, leveraged products that carry a high level of risk. Before acting, consider the PDS and TMD and whether trading CFDs is appropriate for you. Seek independent advice if needed. Past performance is not a reliable indicator of future results.
Last week was as consequential as advertised. The RBA hiked, the Fed held, and markets barely had time to process any of it before reports emerged that Israel had struck Iran's South Pars gas field.
The week ahead brings fewer central bank decisions, but it may be just as important for markets. Flash PMIs will offer the first broad read on whether the war is already showing up in business confidence. Australia's February CPI is the domestic data point that matters most for the RBA's next move. And the oil market remains the dominant macro variable.
Quick facts
Brent crude spiked above $110 per barrel after Israel struck Iran's South Pars gas field for the first time.
Flash PMIs for Australia, Japan, the eurozone, UK, and the US all land Tuesday.
Australia's February CPI lands Wednesday, the first inflation read since the back-to-back RBA hikes.
Oil: From crisis to emergency
The oil situation deteriorated significantly last week. Brent crude has now surged roughly 80% since the war began on 28 February.
The 18 March strike on Iran's South Pars gas field was the first time upstream oil and gas infrastructure has been targeted.
Iran responded to the strike by threatening to target facilities across Saudi Arabia, the UAE and Qatar. If any of these threats are executed, the global oil shock would escalate from a supply disruption to a direct attack on the region's production capacity.
Analysts are now saying $150 Brent is achievable and $200 is not outside the realm of possibility. The 1970s Arab oil embargo resulted in a quadrupling of prices, and the current shock is already being described in those terms by senior energy executives.
For markets this week, oil is the dominant variable. Any signal of ceasefire, diplomatic progress or resumed Hormuz shipping could likely trigger a correction in oil prices. Any Iranian strike on Gulf infrastructure could send them higher.
Monitor
Daily vessel transit numbers through the Strait of Hormuz.
Iranian retaliation against Gulf infrastructure, a strike on Saudi or UAE facilities would be a major escalation.
When and how American and European IEA reserves reach the market.
Qatar's South Pars disruption is affecting the European LNG market.
Trump statements that could cause intraday oil price movement.
Global Flash PMIs: The first read on an economy at war
Tuesday delivers the S&P Global flash PMI estimates for March across every major economy simultaneously.
This will be the first data set to capture how manufacturers and services firms are responding to $100+ oil, the Strait of Hormuz blockade, and the broader uncertainty created by the war in the Middle East.
The key question for each economy is whether the oil price surge and war uncertainty have dented business confidence, suppressed new orders or pushed input price indices to new multi-year highs.
Given that oil crossed $100 before the survey window closed for most economies, input cost readings could be significantly elevated.
Key dates
S&P Global Flash Australia PMI: Tuesday 24 March, 9:00 am AEDT
S&P Global Flash Japan PMI: Tuesday 24 March, 11:30 am AEDT
HSBC Flash India PMI: Tuesday 24 March, 4:00 pm AEDT
HCOB Flash France PMI: Tuesday 24 March, 7:15 pm AEDT
The RBA hiked for the second meeting in a row on 17 March, lifting the cash rate to 4.10% in a narrow 5-4 vote.
Governor Bullock described it as a "very active discussion" where the direction of policy was not in question, only the timing.
This week will see the release of February's CPI as the first read to capture any of the oil shock. The trimmed mean, which strips out volatile items including fuel, will be the number the RBA watches most closely. A reading above 3.5% could cement the case for a May hike. A softer result could revive the argument for a pause.
ANZ and NAB have both stated expectations of a third hike in May, taking the cash rate to 4.35%.
Key dates
ABS Consumer Price Index (CPI): Wednesday 25 March, 11:30 am AEDT
Monitor
Trimmed mean inflation as the RBA's preferred measure.
Fuel and energy components that could separate the oil shock from domestic price pressure.
Housing and services inflation as sticky components driving the RBA's long-run concern.